International Journal of Geosciences
Vol.3 No.5(2012), Article ID:24941,8 pages DOI:10.4236/ijg.2012.35105
Variations of Natural Soil Salinity in an Arid Environment Using Underground Watertable Effects on Salinization of Soils in Irrigated Perimeters in South Tunisia
1Faculty of Science of Tunis, Department of Geology, Tunis, Tunisia
2Tunisian Oil Company, Tunis, Tunisia
Email: lazzez.marzoug@laposte.net
Received June 4, 2012; revised August 9, 2012; accepted September 5, 2012
Keywords: Oasis; Irrigation Water; Superficial Water Table; Salinity; Drainage; Tunisia
ABSTRACT
In arid and semi-arid regions, salinity is a serious and chronic problem for agriculture. The aim of this study is to evaluate the hydromorphical and salinity risks, and to evaluate the relationship and the possible interfering between the water table and the soil on the oasis of Gabes. The topic is very important, especially for nations around the oceans in arid and semi-arid regions. The effect of the gypsum alkalinity in the soil salinity has investigated. The chemical characteristic of used water irrigation (salinity saturation) and their impact factor in the productivity area. Moreover, in this study the program of examination need to put fifteen piesometres by CRAD (Regional Commissariat of Agriculture Development) in the city of Gabes to controlling the variation of water levels in the superficial water table and their change chemical quality. The experimental measure of this program needs a yearly observation and investigation during April and May to evaluate the hydromorphical and salinity risks on the oasis of Gabes. The relationship and the possible interfering between the water table and the soil has evaluate in such condition.
1. Introduction
The sustainability of irrigated agriculture in many arid or semiarid areas is threatened by a combination of factors including poor quality irrigation water, poor or no drainage [1]. The irrigation water exploited in Gabes oasis since 1958, resulting from drilling kept globally the same sulphate mixed chemical water and facies. This water is classified as having high risk of salinization and a middle risk of alcalinisation. From the ionic composition of the saturated paste of representative soils of the oasis, we noticed a clear increase of the concentration of cations (Na+, Ca2+, Mg2+) and anions (Cl– and ) compared with those of the irrigation water. Soils solutions are globally flooded by gypsum crust. For several years, irrigation used drilling water characterized by a mixed sulphate facies, which is probably responsible for gypsum accumulation in all oasis soils. Gypsum concentrations exhibit a clear increasing gradient from surface to the deepest soil profiles. Gypsum encrusting and crusts overlying superficial water table are occupying different horizons according to topography and local drainage conditions. Soil salinity is an escalating problem worldwide. Naturally occurring salt-affected soils cover about 900 hectares in the Gabes oasis, which represent about 3% of the south Tunisian continental surface earth’s, and up to 100 ha have been salinized due to irrigation [1,2]. The irrigation in the study field applied with different levels of water salinity [3]. Under arid climate conditions on the change of soil salinity based on field experiment and simulation outcomes from the revised depth-salinity model.
The aims of this study are to assess the hydromorphical and salinity risks and to evaluate the relationship and the possible interfering between the water table and soil on the oasis of Gabes. The topic is very important, especially for nations around the oceans in arid and semi-arid regions.
2. Geographic Study
Tunisia is located at the northern edge of North Africa, bounded by the Mediterranean Sea, Algeria and Libya. The study area situated in central eastern Tunisia and shows Mid-Cretaceous deposits comprising carbonates, gypsum, marl, clay, sandstone, limestone and dolostone. The latter extend for over 100 km and include the Northern and southern Chotts.The oasis extends directly in the North of Gabes in the Southern Tunisia. This oasis extends over of 900 ha (Figure 1).
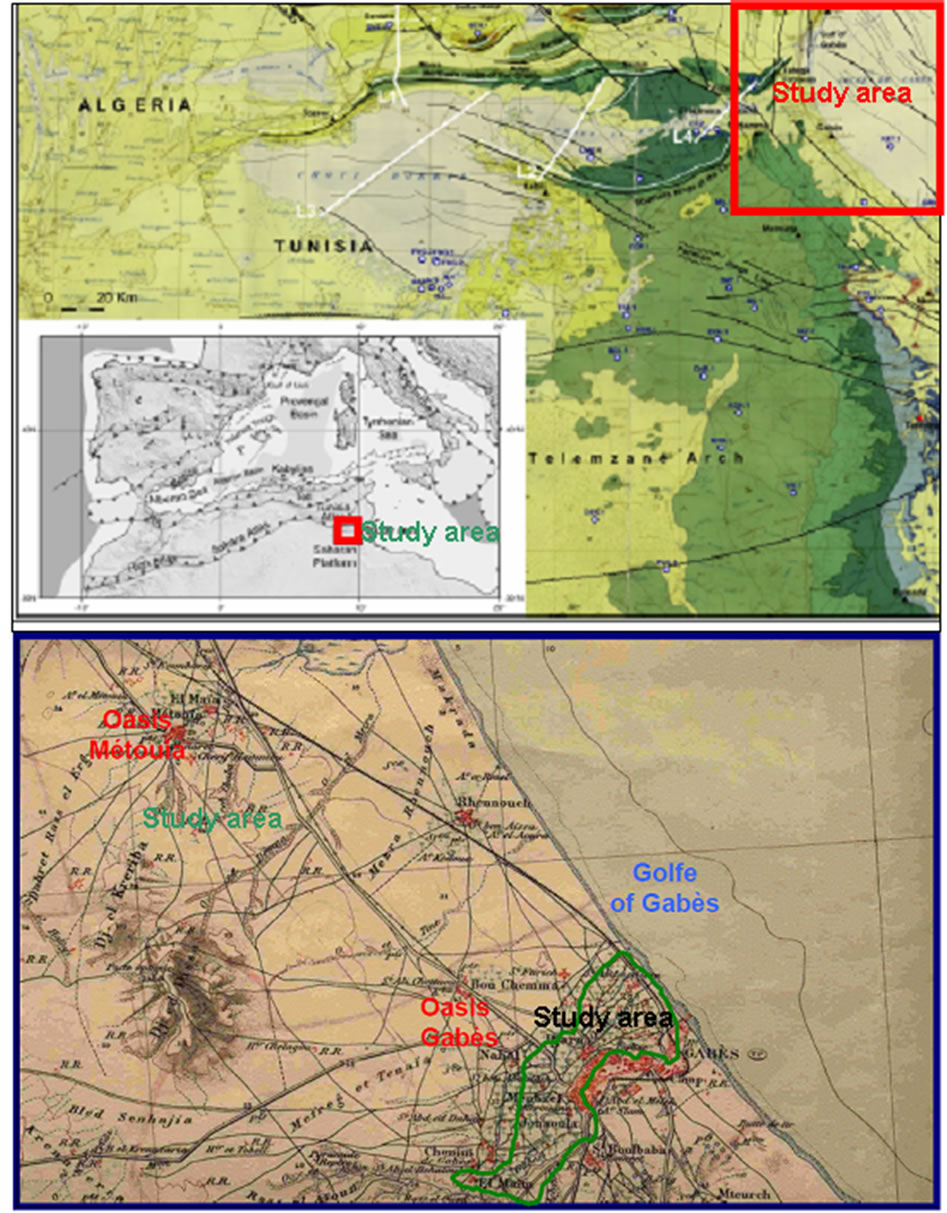
Figure 1. Localisation map of the study area.
3. Characterisation of the Superficial Watertable
The relationship between depth salinity in the study area used fifteen piezometres distributed in the all surface. It is important to talk about that the set of connections consists at in attendance in forty-three piezometres, the others are sealed, which have places near the oasis.
During this study, we realized two campaigns in the beginning of the February and August; the study must be cleaning all the drains before the sampling of water.
The measurement of the watertable depth by an electric probe and depth-salinity variation inside the oasis are studied.
The analysis of the chemical interactions, we break up earth three pedological profiles:
The first profile in a part of land irrigated in the low zone of the oasis (Chott Essalam); the second profile in a part of land irrigated in the median zone of the oasis (Naahel) and the third Profile in a part of land irrigated in the upstream zone of the oasis (Chenini).
In each one of these profiles, we take a sample every 20 cm deep. All the water level samples taking are studied by analysis in the laboratory of their chemical composition.
In this study area (Oasis), we take samples of water to analysis and use this chemical composition in the irrigation of the Gabes oasis in South Tunisia [4].
The CRDA of Gabes suggested installing some sections of drains buried in the oasis of Gabes to test their performance, they are constitute by four buried drains in an open-air primary drain with a general salinity gradient of 0.45 % and a distance end to end of 330 m each one.
To estimate the connections of buried drainage, we finished a series of observation of the watertable level from side to side.
4. Variation of the Watertable Depth
The spatial variation maps of the watertable depth obtained on bases of the measures registered during both campaigns realized during February and August months (Figures 2 and 3).
In irrigated areas, secondary salinization has a double origin: the irrigation water and the rising of the underground watertable. In five irrigated perimeters situated in the North, the centre of the Oasis, salinization from underground waters has been studied by tests of simple correlation between the water depth and its salinity on the one hand and the hydromorphie of the soil horizons on the other hand. The most significant tests of correlation appeared in the watertable salinization of the higher soil horizons. The perimeters of the low valley of the Gabes seem to be the least affected by this origin of salinization in spite of their fine texture and the presence of the watertable at low enough depths. The examination of both maps above presented show the existence of two main zones:
Present a degradation of the dark blue colour (zones with watertable depth 40 cm) towards the white colour (zones with watertable depth 300 cm). The isopieze 80 cm separating the class of zones powerfully hydromorphes zones. The hydromorphes zones represent on maps. In white line, while the isopieze 140 cm separating the class of hydromorphes zones from the non-hydromorphes zone is represent in blue line (Figures 2 and 3).
A very affected zone by the hydromorphie, extends on the Central and the Northeast part of the oasis, which characterized by a low topography and by a network of little maintained drainage. A small affected zone by the hydromorphie of depth located in the Southern sector of the oasis on the left rift valley of Owed Gabes, where we have a natural drainage towards the owed. This zone presents a better capacity for the oasis productivity because it frequently drained and salts are without difficulty wash down.
The spatial variation of the depth of the watertable is a function of several parameters such as the topography and the mode of management of the irrigation and the drainage. The critical depths are important enough for fine textured soils and vary between 1.6 and 2.0 m according to the perimeters and the campaigns of measurements. They are lower for the sandy textured soils and
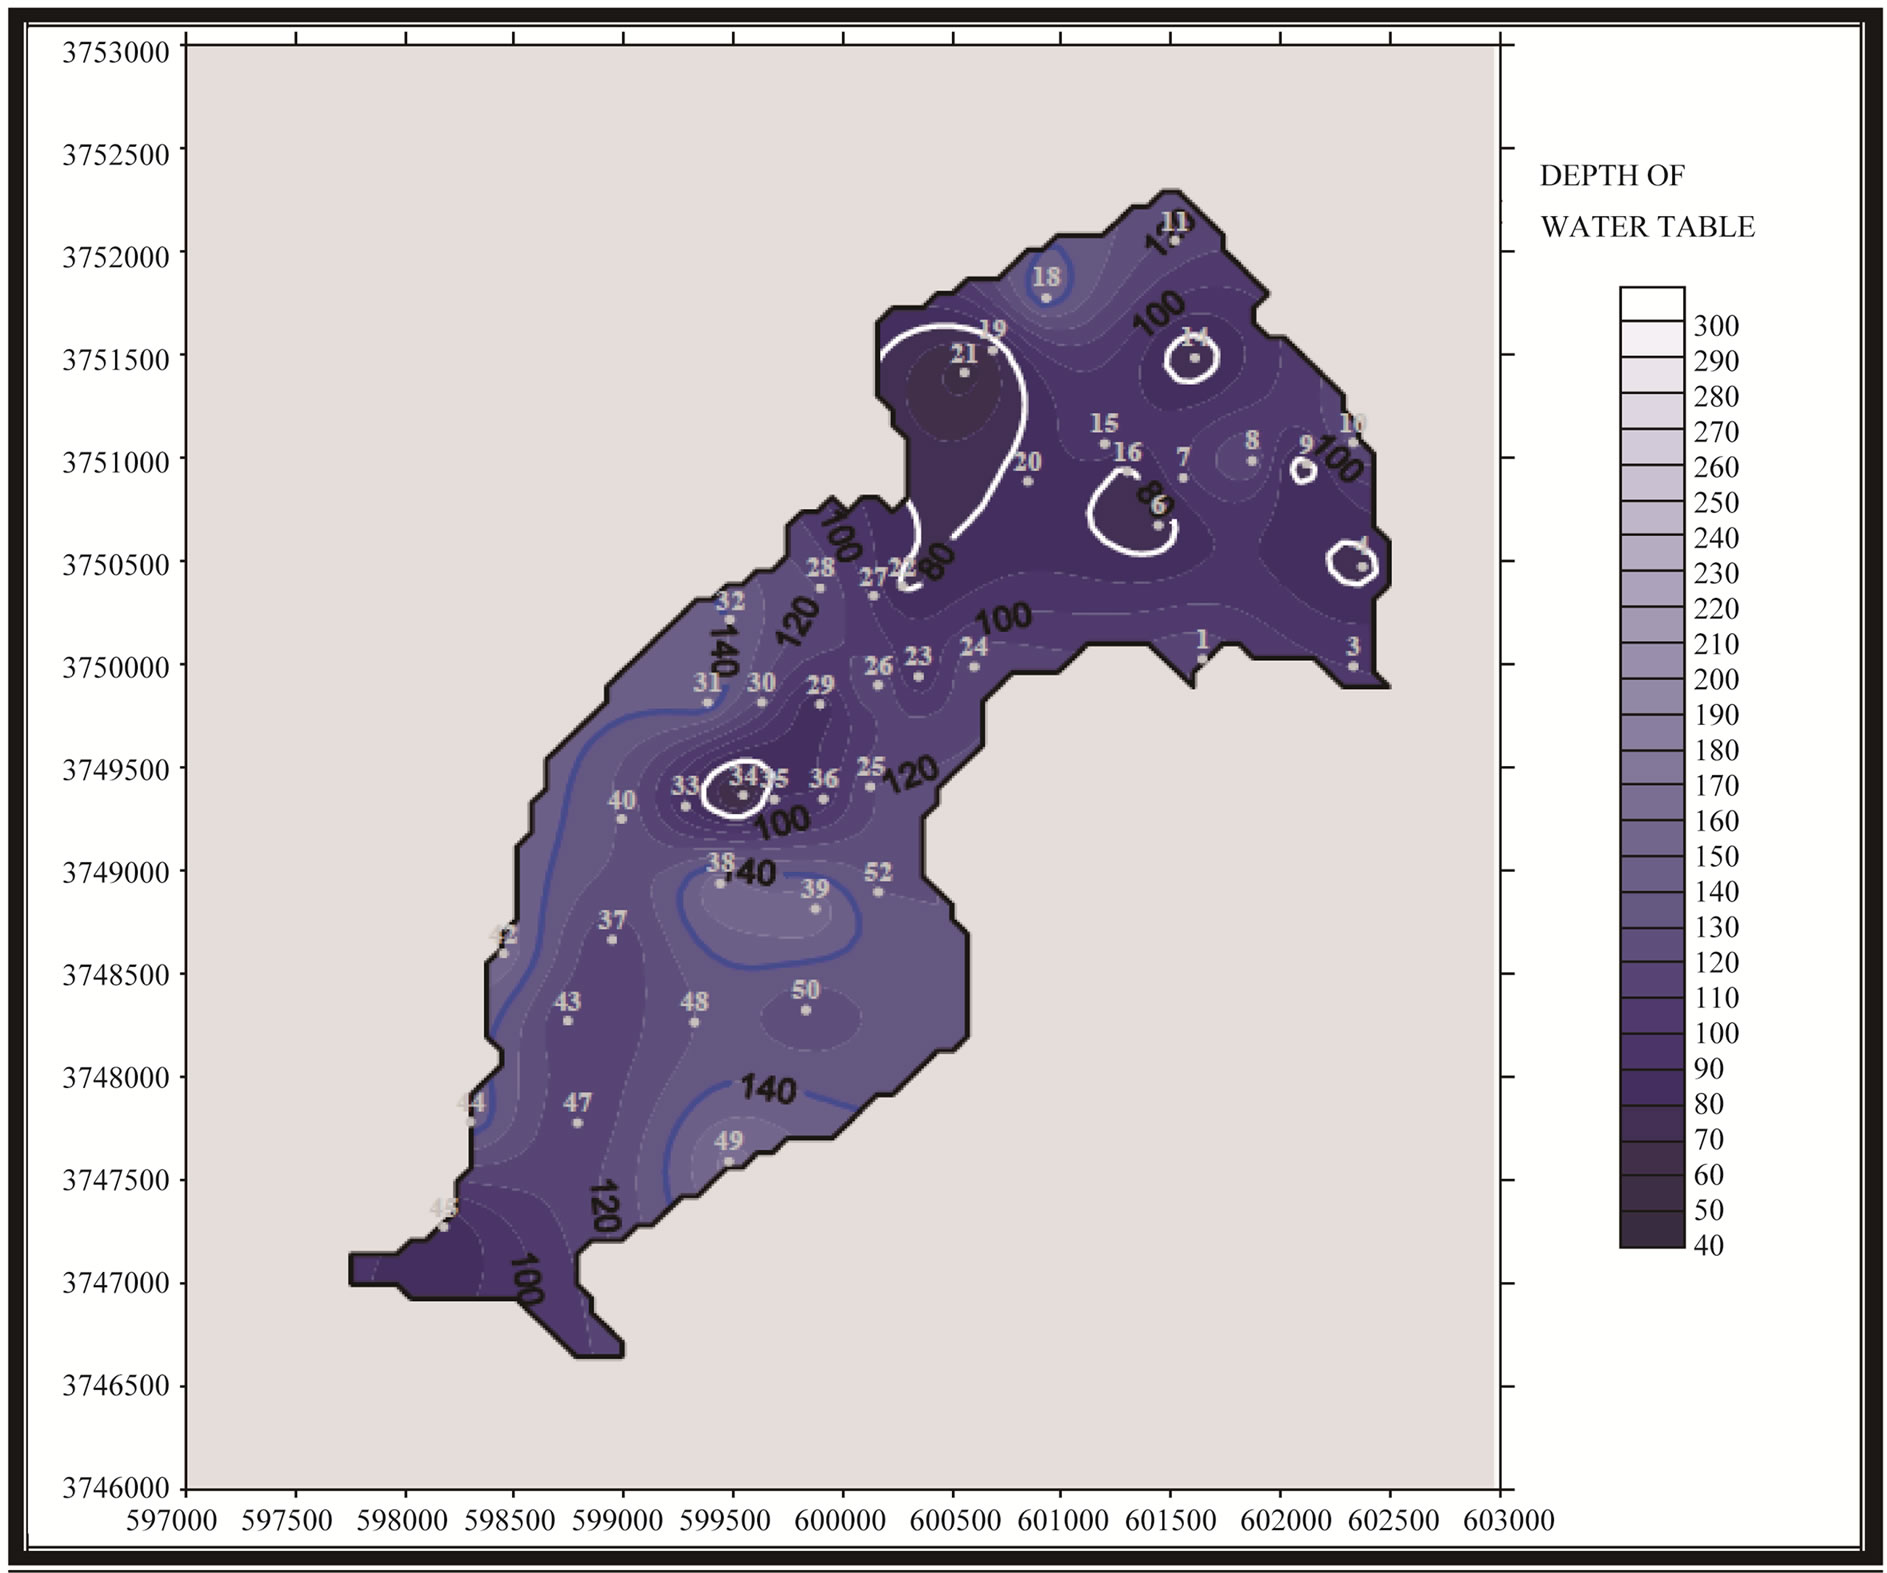
Figure 2. Depth of the superficial watertable in February, 2006.
vary between 1.3 and 1.5 m.
5. Variation of the Watertable Salinity
The objective of this study was to verify if EC measurements can characterize the spatial structure of laboratory-measured soil EC, in order to use it in mapping of soil salinity.
A linear semivariogram was obtained for the salinitysensor and EC measurements at the E-W transect, which agrees with the topographical gradient of the plot and with the soil salinity variation. It also coincides with the laboratory-measure of soil EC:
- The Electric Conductivity (EC < 8 mS/cm) (grey colour) are located in the well drained sectors and will be also characterized by a low percentage of salts chemical elements.
- The averages salinity (8 mS/cm < IT < 20 mS/cm) (green colour) casing the quasi-totality of the perimeter indicating the identical general state of watertable salinity.
- The strapping salinity (20 mS/cm < IT < 35 mS/cm) (orange colour) situated extremely in the North of the oasis corresponding to low drained zone with high topographic reasons and with a high percentage of chemical and salts elements.
The two Figures 4 and 5 summarize the sample means laboratory-measured EC at each depth increment, as well as the EC1 values for the two transects. The EC means are higher at the surface and decrease with depth, corresponding to an inverted soil salinity profile. EC values are high, but such variation is commonly found in this soil property and water table variation. For the 0 - 60 cm average-depth, the EC is lower than for the individual depths. The EC1 mean found for the N-S transect was higher than for the E-W transect. As shown in Figure 4, the N-S transect is completely below a 35.5 mS/cm, thus, it is inside the soil and is parallel to the contour line. The E-W transect crosses the two soil boundaries and its EC is much higher. That EC are normally distributed. A cross-validation analysis has shown that EC semivario-
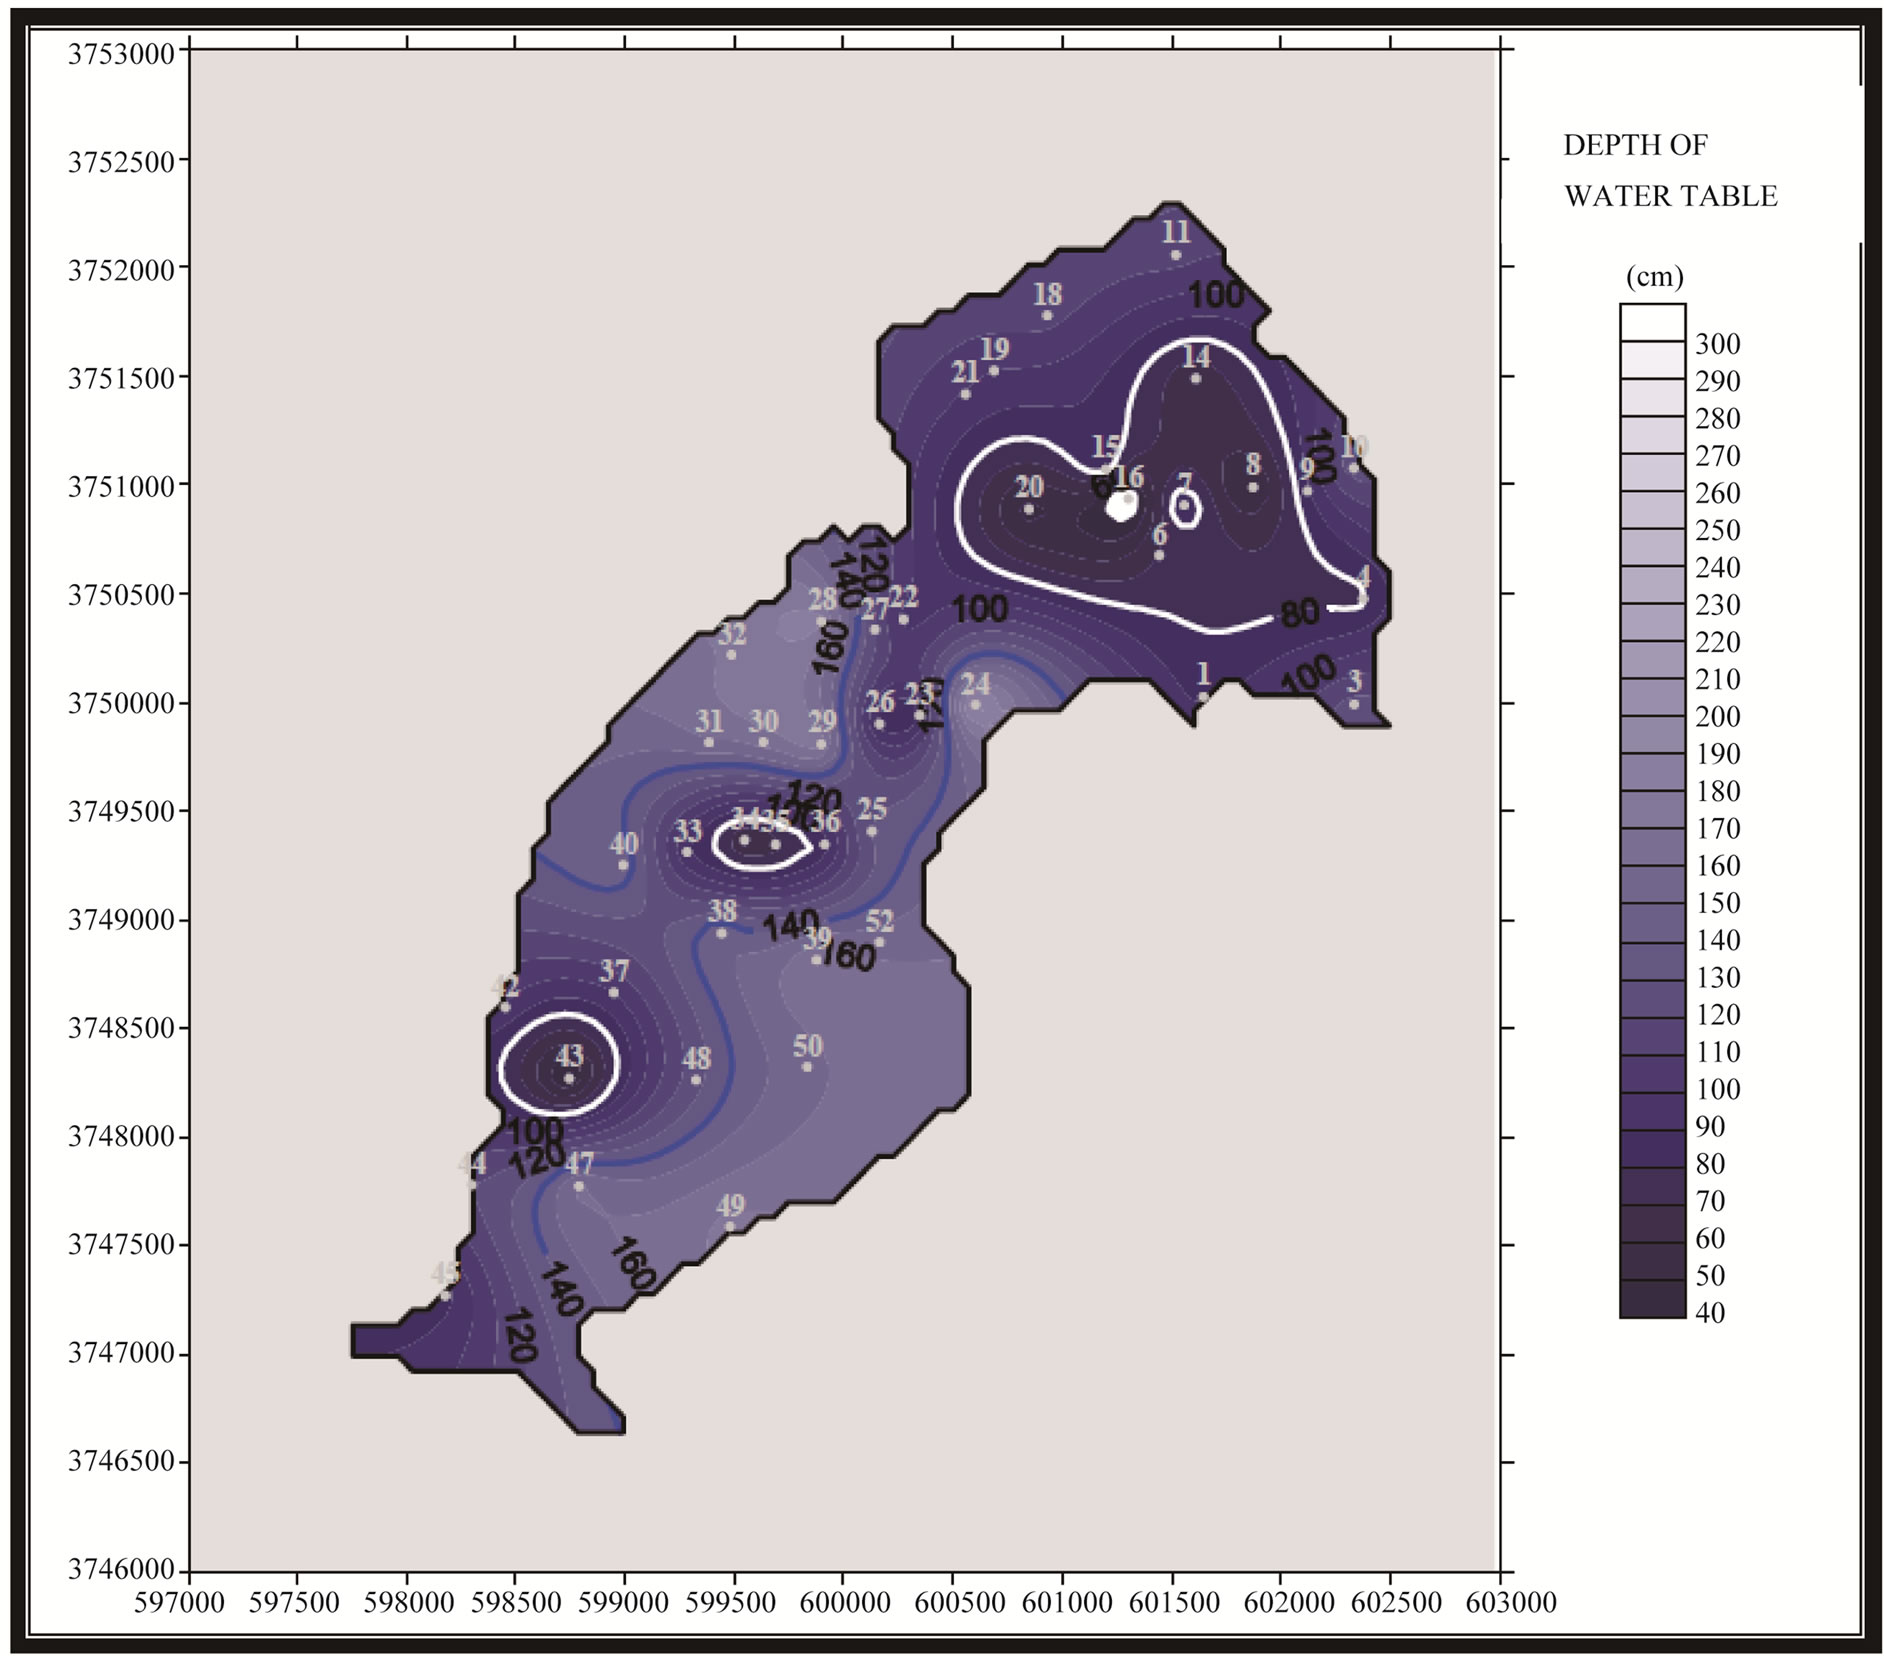
Figure 3. Spatial variation of the depth superficial watertable (in August, 2006).
grams obtained from salinity measurements can characterize the soil EC spatial variation in a similar way as semivariograms of laboratory-measured soil EC. Thus, the distance between samples for soil salinity maps can be based on the semivariogram’s range of salinity-sensor EC measurements and variation of salinity in the watertable.
6. Chemical Characterisation of the Drainage Waters (Table 1)
The chemical analysis showing a quantities of magnesium (Mg2+), and having a relationship Ca2+/Mg2+ generally greater than 3 (D5), and the exchange complex showed unusual richness in magnesium. As a result, the soils got strongly Mg2+ alkalized. This reported the possible role of Mg2+ and sea level incursion emerged the oasis of Gabes. The high concentrations of calcium relative to magnesium in ground waters indicate the highly alkalized surface soil. The sulfate greater than 50 méq/l status of soils is generally best described by gypsum crust of the soil in south Tunisia and their exchangeable and filtrate the alkaline minerals (Na, K, SO4, Cl). As a result of the potential soil mineral exchangeable and their effect with soil Stalinization. The fact that salinity has a stronger effect than magnesium (Mg2+) alkalinity may be partially attributed to the antagonism between magnesium and other cations of these alkaline minerals. The adverse effects of salts on soil composition stem from two aspects: increasing the gypsum crust and thereby making the water in the soil rich by Sulfate and Chlore and specific effects of some elements present in excess concentrations. Salt stress is primarily in relation ship with the sea level incursion temporarily emerged the Oasis, and the ions contributing appreciably to soil salinity include the alkaline minerals and occasionally Na+ and K+ in relation with gypsum crust. In combination, the ions comprise the total salt concentration. Specific ion
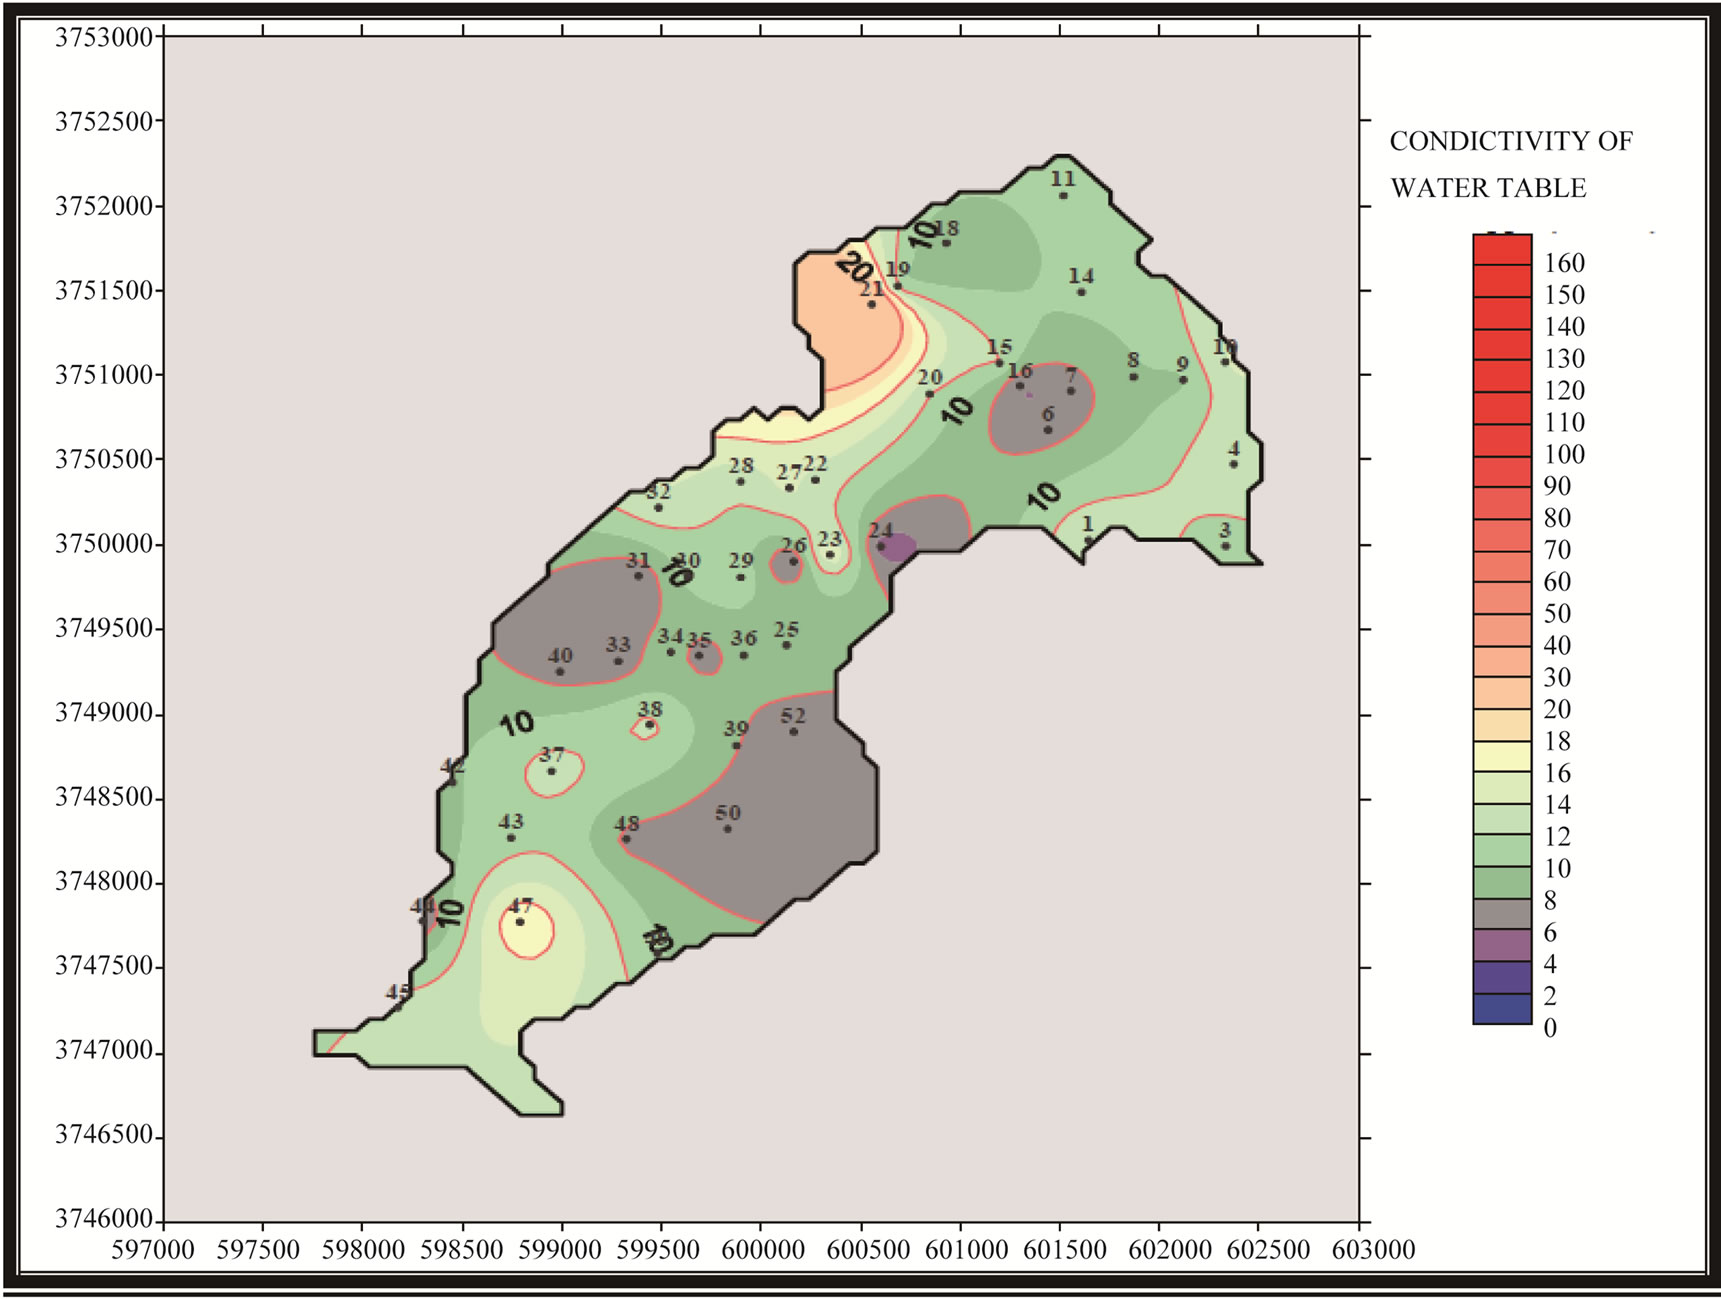
Figure 4. Spatial variation of waters electric conductivity in the superficial watertable (in February, 2006).
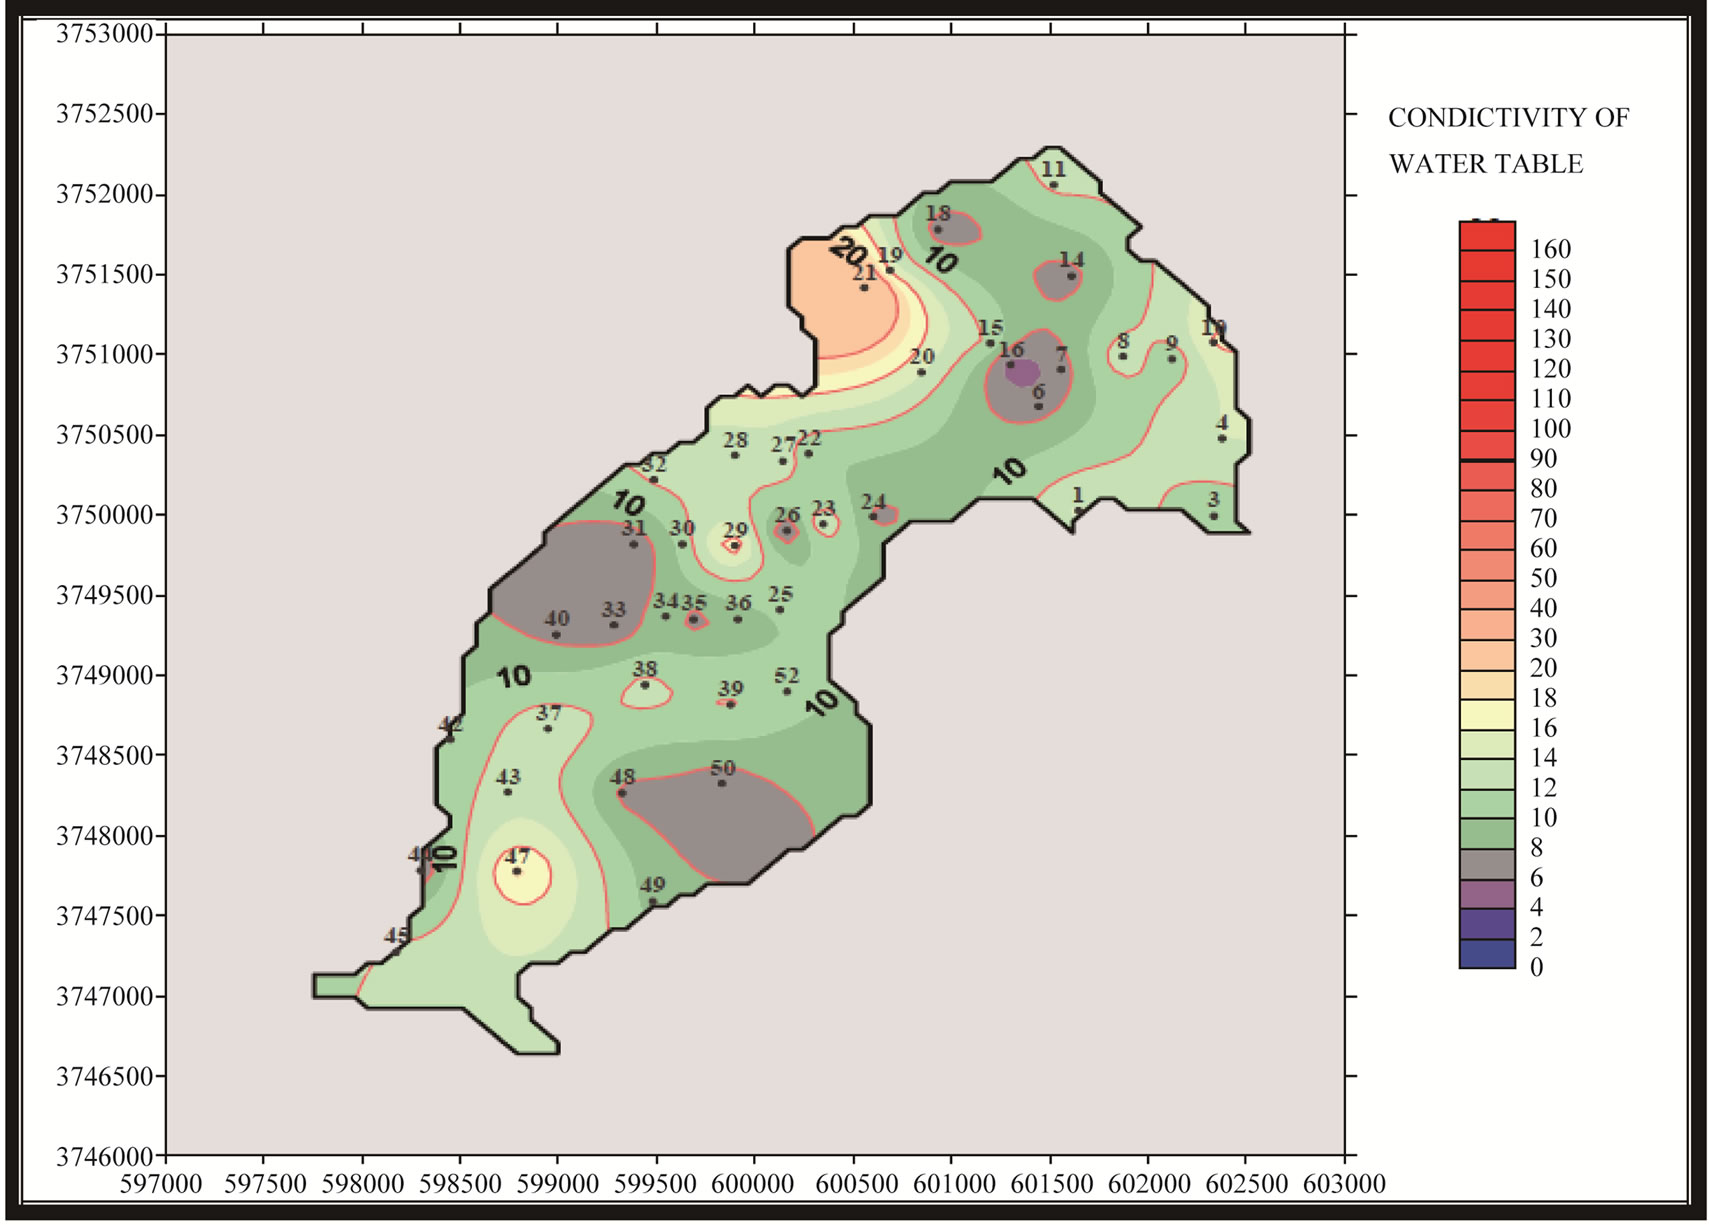
Figure 5. Spatial variation of waters electric conductivity in the superficial watertable (in August 2006).
effects of salinity are twofold. An excess of specific ions may be toxic to the physiological processes. Each of above mentioned anions and cations can have specific effects, though some effects are rarely found. The toxic effects of these soil ions are not cumulative, because antagonism between ions partly neutralizes their effects.
7. Relation Soil Salinity and Watertable
The objective is to study the relation between the grounds, the superficial watertable and to understand the dynamics of salts in this system [1,2]. We proceeded to the taking of the samples of three profiles:
1) Profile 1: near the piezometre 6 in an irrigated plot of land representing the shallow zone of the oasis (Chott Essalam).
2) Profile 2: near the piezometre 34 in an irrigated plot of land representing the median zone of the oasis (Nahal).
3) Profile 3: near the piezometre 45 in an irrigated plot of land representing the upstream zone of the oasis (Cheneni).
To analyze the situation the results (profits) are represented under forms of graphs expressing the evolution of the various parameters analyzed according to the depth of the ground [1,2]. The level of the water-table and the salinity of this one are represented on the same graphs.
The distribution of salt along the 1.2-m soil profile under the three water irrigation treatments at their respective equilibrium conditions are presented in Figure 6. There were layers of high and low salinity levels in the profile due to different soil hydraulic properties of the watertable in the oasis of Gabes among the soil layers. Under the non-saline water irrigation in the first soil layer, the soil gypsum thick is about 0.4 m and the Electric Conductivity was less than 7 ms/cm; more than that, the EC increased linearly to 22 ms/cm in relationship with gypsum thick and water irrigation salinity. Under the moderate saline water irrigation, there was an accumulation of salt at the top soil second layer with EC of 9 ms/cm. The EC then decreased and kept at a level of around 8 ms/cm in relation sheep with soil gypsum percentage (Figure 7). Below the third soil layer, the soil salinity increased with depth and reached 12 g/cm3 at the bottom of the 0, 5 m soil profile (Figure 8). The salt distribution under the high saline water irrigation water followed a similar trend to the moderate saline water irrigation, but showed a much higher accumulation on the top layers [4-11] indicated that the soil salinization problem was minor for filament production under the nonsaline water deficit irrigation practice, since the salinity throughout the soil profile did not exceed the salinity stress threshold for fiber. But there were serious soil salinization problems for the saline water irrigation practices. Under the moderate saline water irrigation, the soil sa-
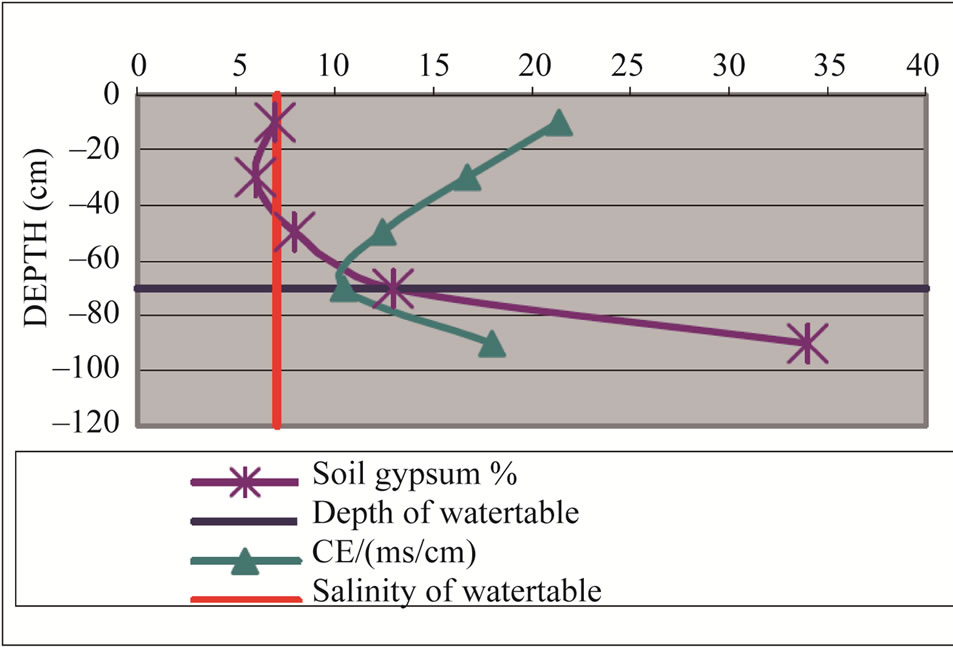
Figure 6. Gypsum profile and saline profile in the profile 1.
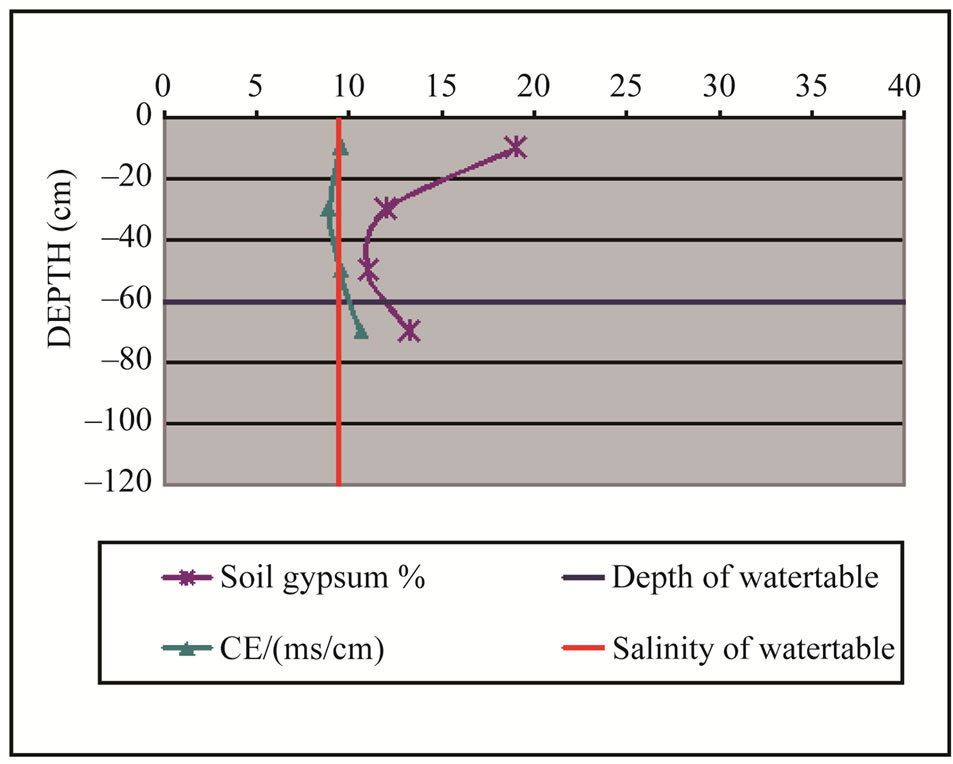
Figure 7. Gypsum profile and saline profile in the profile 2.
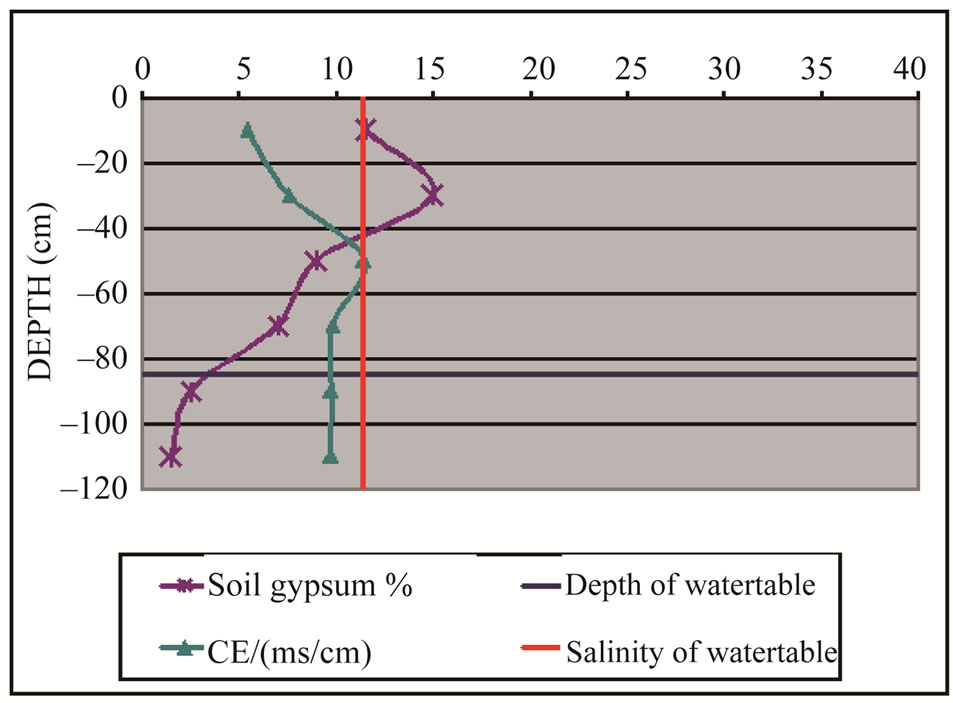
Figure 8. Gypsum profile and saline profile in the profile 3.
linity in the profile was all above the salinity stress threshold. Under the high saline water, the issue became more serious. The salinity level of the top soil layers and bottom layers even exceeded the 50% yield threshold [3,4,9-14].
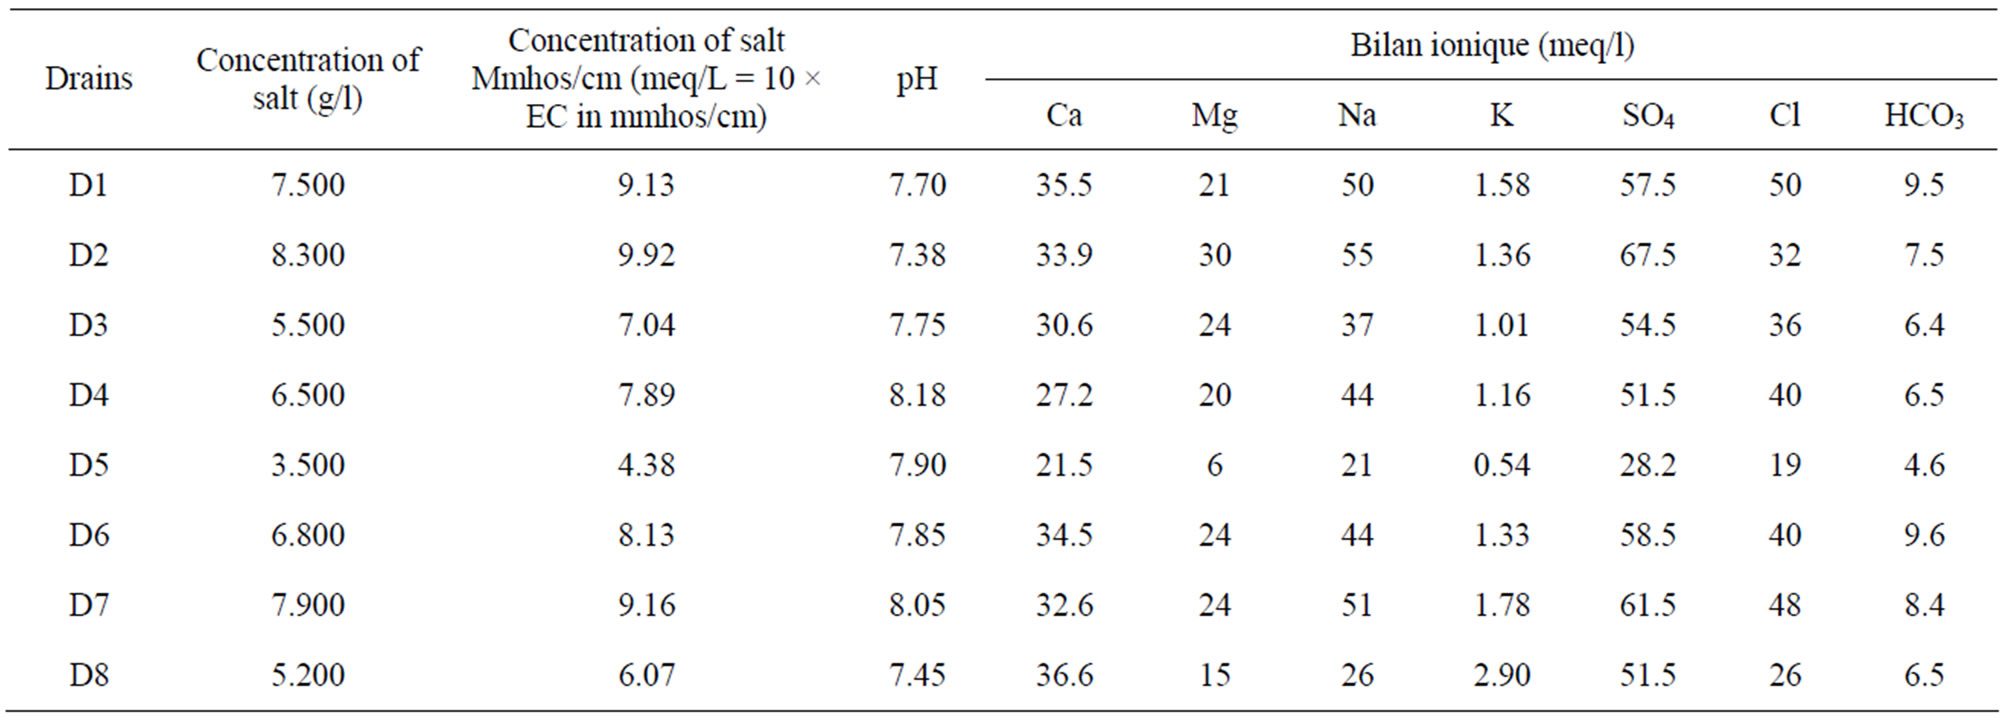
Table 1. Results of chemical analysis of drainage waters.
8. Interpretation
The classified salinity of land cover extending oasis of Gabes show the distribution of soil salinity within the study area as the result of natural processes of weathering of salt deposits that abound in this part of depth and salinity of watertable, and to a lesser degree by human induced variations such as the salinity along some waterways and/or lowering of water tables. The validity of the results was strengthened from visual assessments of soil salinity and transformations versus depth and precipitation. A typical examining accuracy for each classified scene was possible due to the variation in location and area extent of salt deposits over the two-period (February and August). Finally, when the area extent of natural salt as determined by the classification process was compared to depth values and precipitation, a definite relationship was revealed. There was an inverse relationship between those years with little precipitation and the area extent of natural salts as well as period deposits. With cyclical changes in climate, such as indicated in this study during gypsum deposits period, changes in the area extent and distribution of natural salts over the landscape will fluctuate. This study shows that gypsum crust can be an important tool to measure area coverage of salt-laden land cover and temporal changes caused by climatic events, especially precipitation. Water resources conservation is one of the key issues for sustainable agricultural development in arid and semi-arid regions where agricultural productivity is significantly affected by soil salinity. Computer simulation models are a valuable tool to evaluate the effects of different management strategies on salt distribution in the soil profile. This study demonstrates that water and salinity movement and water uptake in soil such as under drip irrigation. Both field experiment and model simulation indicated that under deficit irrigation, salinity can soon built up in the soil to levels that exceed the produce salt tolerance.
9. Conclusion
The drainage waters collected at the exit of the oasis in the collectors of drainage have a relatively low salinity with regard to the average of the watertable. This can be explained by the fact that the current waters in the networks of drainage are generally fresh collected just at the time of their arrival on the surface of the superficial water table before being too much contaminated by grounds. As regards the relation ground-water table, the salinity of the ground on the surface oscillates between low values after one relatively high operation of irrigation and the values at the end of the period of irrigation (just before the irrigation) and it converges in depth on the value of the salinity of the tablecloth as we approach this one. Finally, we can summarize that the situation of hydromorphie and salinization in the oasis of Gabes is not alarming and that it requires cyclic observations in both winter and summer to be able to intervene in time in case of urgency.
10. Acknowledgements
The authors are grateful to Lazzez MarzouK for their invitation to contribute this volume and for their scientific helpful discussions and kind cooperation of the CRDA of Gabes (Tunisia).
REFERENCES
- B. Ajmi, “Study of the Salinity Impact of Waters Irrigation in the Area of El Hicha (North Gabès),” Master Thesis, Faculty of Science of Tunis, Tunis, 2004.
- SAPI Study Team, “Irrigation Perimeters Improvement Project in Oasis in South Tunisia: Final Report,” MARH, DGGREE, Tunis, 2005.
- M. Serge, B. Fethi and B. Akissa, “Water and Salt Balance at Irrigation Scheme Scale: A Comprehensive Approach for Salinity Assessment in a Saharan Oasis,” Agricultural Water Management, Vol. 96, No. 9, 2009, pp. 1311-1322.
- M. Pouget, “Contribution to the Study of Gypsum Crusts of Water Table in the South Tunisian,” Journal of Servicing Pedology, Vol. 6, No. 3-4, 1968, pp. 309-365.
- B. Ajmi, M. Grera and N. Shimi, “Impact of the Salinity of Waters Irrigation in Southeast of Tunisia,” Geology of the Arab world, Cairo University, Giza, 2006, pp. 671- 674.
- A. Hatira and Association of the Natural Systems Organo-Mineral, “Speciation of Heavy Metals in Grounds— Impacts of the Anthropological Activities on the Pedological Environmental Pollution (Fertilizing PhosphorGypsum-Used Water—Water of Irrigation and Mining Rejections (Discharges)),” Habilitation, The Faculty of Sciences of Tunis, Tunis, 2004
- A. Kadri and A. Hatira, “Genesis and Typology of Gypso-Saline Accumulations in Southern Tunisia,” International Symposium on Soils with Gypsum Léida, Espagne, 15-21 September 1996, pp. 55-59.
- A. Mtimet and M. Hachicha, “Hydromorphie and Stalinization in the Tunisian oasis,” Water Deficiency, Vol. 6, No. 4, 1995, pp. 319-324.
- J. Watson, “Long-Term Soil Salinity Evolution in the Hetao Irrigation Scheme,” ENGREF, Montpellier, 2007.
- J. Vieillefon, “Inventory Disapproves of Gypsum Grounds in Tunisia,” Preliminary Study. Dir. Ress. in Water and in Ground, Tunis, 1976.
- J. Vieillefon, “Les Sols Gypseux en Tunisie. Contribution à l’amélioration de leur étude analytique,” Sols de Tunisie, Vol. 10, 1978, pp. 40-105.
- F. Ghassemi, A. J. Jakeman and H. A. Nix, “Salinisation of Land and Water Resources,” CABI, Wallingford, 1995.
- A. Watson, “Structure, Chemistry and Origin of Gypsum Crusts in Southern Tunisia and the Central Namib Desert,” Sedimentology, Vol. 32, No. 6, 1985, pp. 855-875. doi:10.1111/j.1365-3091.1985.tb00737.x
- M. Zammouri, T. Siegfried, T. El-Fahem, S. Kriaˆa and W. Kinzelbach, “Salinization of Groundwater in the Nefzawa Oases Region, Tunisia: Results of Regional-Scale Hydrogeologic Approach,” Hydrogeology Journal, Vol. 15, No. 7, 2007, pp. 1357-137. doi:10.1007/s10040-007-0185-x