Journal of Flow Control, Measurement & Visualization
Vol.04 No.01(2016), Article ID:63246,11 pages
10.4236/jfcmv.2016.41004
Planform Dependency on Airfoil Design Results for Supersonic Wing in Supersonic and Transonic*
Yuki Kishi1, Masahiro Kanazaki1, Yoshikazu Makino2, Kisa Matsushima3
1Guraduate School of System Design, Tokyo Metropolitan University, Tokyo, Japan
2Aeronautical Technology Directorate, Japan Aerospace Exploration Agency, Tokyo, Japan
3Faculty of Engineering, University of Toyama, Toyama, Japan

Copyright © 2016 by authors and Scientific Research Publishing Inc.
This work is licensed under the Creative Commons Attribution International License (CC BY).
http://creativecommons.org/licenses/by/4.0/


Received 21 November 2015; accepted 16 January 2016; published 29 January 2016
ABSTRACT
In this study, the wing design problem for different planforms for supersonic transport (SST) under supersonic and transonic cruise conditions is discussed to obtain knowledge of the supersonic air-foil from the viewpoint of wing planform dependency. Two types of planforms were considered―a cranked arrow wing with a high sweep-back angle and a tapered wing with a low sweep- back angle. The optimum airfoils of these planforms were designed by efficient global optimization, which combined the evolutionary algorithm with the Kriging surrogate model. To acquire design knowledge, the functional analysis of variance was applied to the solution space and the design space. The design results show that the optimum airfoil and the contribution ratios of design variables for the airfoils of the two planform are different.
Keywords:
Supersonic Wing, Multi-Point Design, Airfoil Design, Knowledge Discovery

1. Introduction
A wing of a supersonic transporter (SST) has been designed based on the sweep theory proposed in 1960s using the liner theory. It suggests that the wing which has larger sweep-back angle can reduce wave drag intransonic and supersonic cruise. On the other hand, several studies [1] -[3] by a computational fluid dynamics (CFD) say that the lower swept-back wing can also reduce the wave drag for the wing which has supersonic leading edge. This result suggests that SST designers can choose a high swept-back planform or a low swept-back planform for the mission and the flight profile of the designed SST. However, researchers have mainly focused on high swept-back wings such as swept wings, delta wings, and cranked arrow wings, and only a few studies have examined low swept-back wings. In addition, the CFD results also suggest that different optimum airfoils should be used depending on the planform because the trends of aerodynamic performance differ according to the planform. The several researches have been carried out regarding supersonic wing design [4] [5] . In reference [4] , a natural laminar flow wing was designed by the inverse design. In reference [5] , the multi-disciplinary design which was considered the interaction between the aerodynamics and the structure by an evolutionary algorithm was discussed. These studies could find optimum results for a planform. However, the influence by the difference of the planform was not investigated. Therefore, it is necessary to obtain design knowledge regarding the differences in the aerodynamic performance of high and low swept-back wings for the optimum airfoil for a given planform.
In this paper, to discuss the design knowledge, a wing design problem was solved by the efficient global optimization (EGO) [6] with a multi-objective genetic algorithm (MOGA) for a multi-objective problem (MoPs). In this study, two planforms are considered: a cranked arrow wing with a high swept-back leading edge and a tapered wing with a low swept-back leading edge. Design problem is formulated as the minimization of drag in transonic and supersonic simultaneously, because transonic cruise may account for a large percentage of the whole flight of a SST.
2. Design Method
Figure 1 presents a flow chart of EGO [6] which is a design method combined with evolutionary computation and Kriging surrogate model. EGO is capable to search an optimum solution efficiently in global design space. The difference between EGO in a previous research [6] and in this research is in the manner in which the expected improvement (EI) is maximized. In reference [6] , the branch-and-bound algorithm was used, while in this study, the divided range multi-objective genetic algorithm (DRMOGA) [7] was used.

Figure 1. The flow chart of EGO in this study.
2.1. Latin Hypercube Sampling for Initial Model
Initial samples were obtained by the design of experiment (DoE). We employed Latin hypercube sampling (LHS) [8] . LHS is developed multi-dimensionally from Latin square sampling, which is a traditional DoE method.
2.2. Kriging Surrogate Model
Kriging surrogate model [9] represents the value  at the unknown design point
  as
as
 (1)
(1)
The correlation between  and
and  is related to the distance between the corresponding points,
and . In the Kriging surrogate model, the local deviation at an unknown point x is expressed using stochastic processes. A number of design points are calculated as sample points and then interpolated using a Gaussian random function as the correlation function to estimate the trend through the stochastic process.
2.3. Selection of Additional Samples Using Expected Improvement (EI)
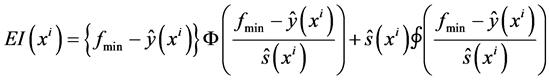
To consider uncertainty at the predicted point in the Kriging surrogate model, the EI value [6] is used as an index for selecting additional samples. The EI value indicates the uncertainty of the accuracy of the surrogate model and optimality and calculated using each object function. The EI values for maximization problem are calculated as;
 (2)
(2)
and the EI values for the minimization problem as;
 (3)
(3)
The points where  attains the maximum value for each objective function are selected as additional sample points. For example, if the number of object functions is two, at least two new sample points should be selected as additional sampling points. The robust exploration of the global optimum and the improvement of the accuracy of the surrogate model can be simultaneously achieved as Figure 2.
 (a) (b)
Figure 2. Improvement of the surrogate model. (a) Before adding an additional sample; (b) After adding an additional sample.
2.4. Divided Range Multi-Objective Genetic Algorithm (DRMOGA)
To determine the optimum point, DRMOGA [7] was applied. In order to maintain the diversity of solutions, the population was divided into several sub-populations by the neighborhood cultivation scheme. Sub-populations were gathered at regular intervals. DRMOGA can improve the diversity of solutions in population because individuals evolve in each sub-population.
2.5. Functional Analysis of Variance (Functional ANOVA)
ANOVA which is a multi-variate analysis was applied to the evaluation of the contribution of design variables. The total variance of the model is decomposed into the variance attributed to each design variable and to the interactions between the design variables by integrating the variables of the surrogate model. The variance of design variable xi to  is defined as;
 (4)
(4)
where the total mean is calculated as
 (5)
(5)
The proportion of the variance attributed to the design variable to the total variance of the surrogate model can be expressed as shown below;
 (6)
(6)
The value obtained by Equation (6) indicates the sensitivity of an objective function to the variance of a design variable xi.
2.6. Aerodynamic Evaluation
The aerodynamic performances were evaluated using CAD-based Automatic Panel Analysis System (CAPAS) [10] developed in JAXA. The governing equation is the linearized compressive potential flow equation as
 (7)
(7)
 (8)
(8)
By dividing the object surface into micro panels and discretizing them and adding two unknown quantities, Equations (7) and (8) are transformed into simultaneous linear equations. They are considered reasonable and proper if the thickness of the object is very less as compared to its length and if the flow speed in the calculation space is not near the sonic speed.
3. Design Problems
3.1. Design Cases
In this study, wing design problems were solved for two cases―a cranked arrow wing (Case 1), which is the same as the concept model [11] proposed by JAXA, and a tapered wing (Case 2), which is similar to Aerion AS2’s planform. The geometrical parameters of each planform are summarized in Table 1. To evaluate the aerodynamic performance, these calculation models comprising the wing, fuselage, and tail wing were considered.

Table 1. Dimensions of the planforms.
3.2. Design Space
The design space was defined for three sections, namely, root, kink and tip. The geometry between the root and kink were interpolated by a spline curve, and that between the kink and tip were linearly interpolated. The design variables and their ranges are summarized in Table 2. The base airfoil for Case 1 was the NACA64A airfoil and that for Case 2 was a biconvex airfoil (see Figure 3).

Figure 3. Base airfoils for each case.
Table 2. Design space.
%c: The percentage of the chord length.
3.3. Objective Functions and Constrains
The objective functions are expressed as follows;


To improve the cruise efficiency of the SST, it is important to consider not only the supersonic condition, but also the transonic condition. The flying condition for the first objective was assumed as supersonic cruise at an altitude of 15,000 m, and that for the second objective was assumed as transonic cruise at an altitude of 11,000 m.
Through optimization, two constraints were considered. One was that the aerodynamic should be estimated under the design . The design
  was calculated by statistically estimating the weight of wing [12] - [15] as
 (8)
(8)
The weight of the aircraft in flight was estimated by adding  to the weight of the fuselage and the tail for JAXA’s concept model [9] .
The other constraint was the trim stability with changing elevator angles. To determine the elevator angle, each sample was calculated for two different horizontal tail angles. Then, the trimmed elevator angle was determined by liner interpolation. Calculations were performed 12 times for each sample to evaluate the aerodynamic performance under these constraints.
4. Results and Discussions
4.1. Sampling Results
In this study, two additional samples were added in each additional sampling by DRMOGA. In DRMOGA, the total generation number is 64 and the size of population is 64. The population is divided into four sub-popula- tions. Sub-populations are shuffled every four generations.
The aerodynamic performance of all initial and additional samples for both cases is shown in Figure 4. In this figure, each dot corresponds to each sample and the high direction of the optimality of samples is indicated by the arrow written “optimum direction”. In other word, low drag samples at the both Mach numbers are located in the lower left on Figure 4. Most of the additional samples in Case 1 exhibited better performances than the initial samples. On the other hands, in Case 2, several solutions could not be improved. This result suggests that Case 2 is more difficult to solve than Case 1.

Figure 4. Sampling results.
4.2. Knowledge Discover by ANOVA
Visualization results of the design space and the solution space by the functional ANOVA are shown in Figure 5. In Case 1, the trend of  at
at  is similar to that of
  at
at , because the wings in Case 1 have a subsonic leading edge for the both Mach numbers. The design variables for the camber shape at kink (such as dv6, dv10 and dv4 which were defined in Table 2) have a predominant effect at both Mach numbers because the kink geometry influences the inboard and the outboard.
 (a) (b)
 (c) (d)
Figure 5. Functional ANOVA (dv~means design variable defined in Table 2). (a) Case 1 ( ); (b) Case 1 (
 ); (c) Case 2 (
 ); (d) Case 2 (
 ).
).
On the other hand, the ANOVA results of Case 2 depend on the Mach number, because the speed of the main stream is different; a subsonic leading edge can be observed at  and a supersonic leading edge can be observed at
 . At
. At , the design variables for the tip (such as dv14 and dv11) show the effect of the induced drag, while in Case1, these design variables for the tip show only small effects, because the chord length at the tip of Case 2 is longer than that of Case 1.
4.3. Design Examples
To discuss and compare the trend of the optimum shape of each planform, Design 1 and Design 2 were selected from all samples as shown in Figure 4. The pressure distributions are compared in Figure 6. At each Mach number, the pressure at the leading edge of Design 2 is higher than that in Design 1. This is so because the sweep-back angle of Design 2 is smaller than that of Design 1. When Design 1 accelerates from transonic to supersonic, the peak of the pressure difference between the lower and the upper surface of the wing becomes low because of its high sweep-back angle (Figure 6(a) and Figure 6(b)). On the other hand, when Design 2 flies at a supersonic speed, a shock wave is observed at the leading edge owing to its low sweep back angle (Figure 6(d)). Thus, Design 2 cannot realize lift at the leading edge; it is observed that a wide positive pressure area on the aft lower surface can generate sufficient lift.

Figure 6. Surface CP distributions of representative samples. (a) Design 1 ( ); (b) Design 1 (
 ); (c) Design 2 (
 ); (d) Design 2 (
 ).
).
The airfoil geometries of Design 1 and Design 2 are shown in Figure 7. The slope of the leading edge is smaller in Design 2 than in Design1because the acceleration of the flow causes a shock wave, which indicates wave drag. For the tip airfoil, Design 1 has a positive camber, while Design 2 has a straight camber. The  distributions at the kinks in Design 1 and Design 2 are shown in Figure 8. According to Figure 8(a), the
  distributions of Design 1 are similar to that of Design 2. This indicates that the lift is uniform at the kink’s airfoil in both designs in the chord direction. On the contrary, Figure 8(b) shows the different
  distributions between Design 1 and that of Design 2. In Design 1, negative lift is created near the leading edge, indicating pitch down moment. The
  of Design 2 shows the almost same value at the upper surface and lower surface around the leading edge. This indicates that flow acceleration around the leading edge of Design 2 is suitable for the reducing the wave drag.
 (a)
(a)
 (b) (b)
Figure 7. Sectional airfoil of representative samples. (a) Root; (b) Kink (63% semi-span); (c) Tip.
 (a)
(a) (b)
(b)
Figure 8. Cross sectional  distributions of kink (63% semi-span). (a)
 ; (b)
; (b) .
.
5. Concluding Remarks
To obtain design knowledge of the planform dependency of the airfoil design results, the aerodynamic designs of an airfoil for a cranked arrow wing and a single tapered wing were studied using EGO. Each defined airfoil had different optimum geometries for the two wing planforms. For example, the slope of the leading edge is smaller in the case of the tapered wing than in the case of the cranked arrow wing to inhibit shock wave. In addition, the results of functional ANOVA show that the trends of contribution ratios of design variables to drag reduction differ with planforms. At supersonic speeds, the cranked arrow wing and the tapered wing are similar from the viewpoint of the dominant design variables; this is so because the aim is to reduce wave drag, which defines the camber height of the kink airfoil. On the contrary, at transonic speeds, the dominant design variables of the two wings are different. In the cranked arrow wing, the camber height of the kink airfoil is dominant as the supersonic speeds. In the tapered wing, the design variables for the tip are dominant due to induced drag.
Cite this paper
YukiKishi,MasahiroKanazaki,YoshikazuMakino,KisaMatsushima, (2016) Planform Dependency on Airfoil Design Results for Supersonic Wing in Supersonic and Transonic. Journal of Flow Control, Measurement & Visualization,04,38-48. doi: 10.4236/jfcmv.2016.41004
References
- 1. Kishi, Y. (2013) Panform Dependency of Multi-Point Aerodynamic Performance for Supersonic Wing. Proceedings of the 51st Aircraft Symposium, Takamatsu, 20-22 November 2013, 1B08. (In Japanese)
- 2. Kashitani, M., Kusunose, K., Yamaguchi, Y. and Nakao, S. (2014) A Preliminary Study on the Effects of Sweepback Angle in Supersonic Flow. Proceedings of the 52nd Aircraft Symposium, Nagasaki, 8-10 October 2014, 1F11. (In Japanese)
- 3. Takeuchi, K., Matsushima, K., Kanazaki, M. and Kusunose, K. (2015) CFD Analysis on Sweep Angles of the Leading Edge and Trailing Edges of Wing in Supersonic Flow. Transactions of the JSME (In Japanese), 81, No. 827. http://dx.doi.org/10.1299/transjsme.15-00037
- 4. Matsushima, K., Iwamiya, T. and Nakahashi, K. (2002) Wing Design for Supersonic Transports Using Integral Equation Method. Engineering Analysis with Boundary Elements, 28, 247-255. http://dx.doi.org/10.1016/S0955-7997(03)00055-9
- 5. Sasaki, D., Obayashi, S. and Nakahashi, K. (2002) Navier-Stokes Optimization of Supersonic Wings with Four Design Objectives Using Evolutionary Algorithm. Journal of Aircraft, 39, 621-629. http://dx.doi.org/10.2514/2.2974
- 6. Jones, D.R., Schonlau, M. and Welch, W.J. (1999) Efficient Global Optimization of Expensive Black-Box Function. Journal of Global Optimization, 13, 455-492. http://dx.doi.org/10.1023/A:1008306431147
- 7. Hiroyasu, T., Miki, M. and Watanabe, S. (1999) Divided Range Genetic Algorithm in Multiobjective Optimization Problems. Proceedings of International Workshop on Emergent Synthesis, Kobe, 6-7 December 1999, 57-66.
- 8. Ye, K.Q. (1998) Orthogonal Column Latin Hypercubes and Their Application in Computer Experiments. Journal of the American Statistical Association, 93, 1430-1439. http://dx.doi.org/10.1080/01621459.1998.10473803
- 9. Sacks, J., Welch, W.J., Mitchell, T.J. and Wynn, H.P. (1989) Design and Analysis of Computer Experiments. Statistical Science, 4, 409-435. http://dx.doi.org/10.1214/ss/1177012413
- 10. Makino, Y. (2007) Low Sonic-Boom Design of a Silent Supersonic Technology Demonstrator ~ Development of CAPAS and Its Application. Proceedings of the 4th SST-CFD Workshops (International Workshops on Numerical Simulation Technology for Design of Next Generation Supersonic Civil Transport), 2007, 69-704.
- 11. Horinouchi, S., Makino, Y. and Noguchi, M. (2008) Conceptual Study of a Quiet Small Supersonic Transport (Part 2). Proceedings of the 47th Aircraft Symposium, Gifu, 4-6 November 2009, 1B1. (In Japanese)
- 12. Mack, R.J. (2003) Supersonic Business-Jet Concept Designed for Low Sonic Boom. NASA TM-2003-212435.
- 13. Mascitti, V.R. (1997) A Preliminary Study of the Performance and Characteristics of a Supersonic Executive Aircraft. NASA TM-74055.
- 14. Fenbert, J.W., Ozoroski, L.P., Geiselhart, K.A., Shields, E.W. and McElroy, M.O. (1999) Concept Development of a Mach 2.4 High-Speed Civil Transport. NASA TP-1999-209694.
- 15. Robins, A.W., Dollyhigh, S.M., Beissner, F.L., Geiselhart, K., Martin, G.L., Coen, P.G. and Morris, S.J. (1988) Concept Development of a Mach 3.0 High-Speed Civil Transport. NASA TM-4058.
Nomenclature
 : Span length
 : Pressure drag coefficient
 : Expected Improvement
 : The maximum value among all the available sample points
 : The minimum value among all the available sample points
 : Total lift [N]
 : The number of design variables
 : Mach number of the main flow
 : Ultimate load factor
 : The sensitivity of an object function to the variance of design variable
 : Wing area
 : The root of minimum square error of the surrogate model
 : Thickness of root cross section
 : Operating weight in flight [N]
 : Takeoff weight [kg]
 : Wing weight [kg]
 : Unknown design point
 : th design variable
 : The position coordinate of the center of gravity
 : The position coordinate of the center of pressure
 : Approximate solution
 : A local deviation of the global model
 : Sweep back angle of the leading edge
 : A mean value of the objective function among all samples
 : The total mean
 : The variance of design variable to
 : Velocity potential
 : The standard normal distribution function
 : The probability density function
NOTES

*Part of this work was presented at 12th International Conference on Fluid Dynamics, October 2015, Sendai.