Journal of Flow Control, Measurement & Visualization
Vol.2 No.1(2014), Article ID:42329,6 pages DOI:10.4236/jfcmv.2014.21004
Effect of Flat Plate Leading Edge Pattern on Structure of Streamwise Vortices Generated in Its Boundary Layer
1Department of Mechanical Engineering, National University of Singapore, Singapore
2Temasek Laboratories at National University of Singapore, Singapore
Email: mpewinot@nus.edu.sg
Copyright © 2014 Seyed Mohammad Hasheminejad et al. This is an open access article distributed under the Creative Commons Attribution License, which permits unrestricted use, distribution, and reproduction in any medium, provided the original work is properly cited. In accordance of the Creative Commons Attribution License all Copyrights © 2014 are reserved for SCIRP and the owner of the intellectual property Seyed Mohammad Hasheminejad et al. All Copyright © 2014 are guarded by law and by SCIRP as a guardian.
Received October 30, 2013; revised December 30, 2014; accepted January 7, 2014
KEYWORDS
Leading Edge Pattern; Counter Rotating Vortex Pair; Saw-Tooth; Semi-Circle; Slot
ABSTRACT
The use of leading edge with different geometrical patterns will affect the development of boundary layer flow on a flat plate and its heat transfer properties. In this work, the effects of three patterns namely saw-tooth, semicircular and slots with same wavelength and amplitude were examined. The experiments were carried out for Reynolds number based on wavelength of patterns ranging from 1540 to 3850. For all cases, after each valley, an oval shape region was formed containing a counterrotating vortex pair. It is also shown that for the flat plate with slots, another vortex was visualized between each valley.
1. Introduction
A method to improve the aerodynamic performance of airfoils, that is, to increase lift and/or reduce drag is by momentum exchange and separation delay. Generating streamwise vortices in boundary layer can be used for this purpose. Vortex generators are well known devices which are used to generate either co-rotating or counterrotating chordwise wise vortices through making discontinuities and shear force [1]. Despite interesting results such as the occurrence of a mixing zone [2] and suppression of von Karman vortex street in the wake of an airfoil [3], vortex generators introduce additional drag in flow which is not desirable for stall suppression.
Another technique of generating such streamwise vortices in boundary layer is to use leading edge patterns. This idea of leading edge pattern was actually inspired by nature, for example, it was observed that owl wings generate mini vortices by comb like feathers, so to retard the boundary layer separation, and consequently, give this predator the ability of quietly approaching the prey by high stall angle of attack [4].
In another example, marine biologists noticed that the species of whales called humpback whale (Megaptera novaeangliae) are more maneuverable compared with other whale species, despite of their huge and inflexible body. Morphological studies by Fish and Battle [5] on humpback’s pectoral flipper showed that the flipper has aspect ratio, symmetric profile with large sinusoidal tubercles. Actually, the combination of tubercles and the high aspect ratio of the flippers allows humpback whales to perform sharp banking turns which leads to a rise in the proportion of lift to drag coefficients [6].
Soderman [7] studied the effect of saw-tooth edge attached to the leading edge of a two-dimensional airfoil. The results showed that saw-tooth pattern leading edge can reduce the separation region and drag coefficient. A series of wind tunnel experiments by Miklosovic et al. [8] showed increase of the stall angle and the maximum lift coefficient by 40% and 6%, respectively. They found that the lift gradually drops during the stall. Stein and Murray [9] examined a two-dimensional airfoil with the same amplitude and wavelength as the humpback whale flipper. Unlike in previous works, they reported a considerable loss of lift and an increase in drag for a specific range of angles of attack [9]. This discrepancy in results may be due to the fact that the earlier work was done on finite airfoils. This also indicates that spanwise flow has been affected by the leading edge protuberances. Johari et al. [10] experimentally studied the role of sinusoidal protuberances on the leading edge of a two-dimensional airfoil and observed that the amplitude of the protuberances plays a more significant role on the performance than their wavelength. They also found from flow visualization that the flow separation occurs earlier in the region between two protuberances [10]. Force measurement tests [9-12] at low Reynolds number on nominally two-dimensional airfoils demonstrated gradual stall with greater post stall lift for modified model compared to unmodified one. However, the pre stall performance for both modified and unmodified models was more or less the same. It can be concluded that the tubercles have limitation to be used in bounded airfoils, that is, for cases which can be considered as infinite two-dimensional airfoils [10,12-14].
Cranston et al. [13] created serrations (saw-tooth like pattern) on flat plates and showed that the size of the serrations for low Reynolds number flow affects the aerodynamics characteristics and bubble separation. They found that the use of serrations is more efficient at higher Reynolds numbers. The use of small serrations results in increase in lift coefficient, while the use of large serrations showed reduction in lift. Hansen et al. [11] studied two different airfoils NACA 0021 and NACA 65-021, to find the effect of airfoil shape characteristics on performance enhancement. They found that shifting the position of maximum thickness further downstream extends the laminar boundary layer further and hence shows that tubercles can have more significant role. They confirmed that as the amplitude of turbercles decreased the performance decreased too. In contrast to earlier research by Johari et al. [10,14] who reported that the wavelength of tubercles has considerable effect on performance. However, there is a critical wavelength at which the performance is maximum for each amplitude. Therefore, they defined an optimal amplitude-to-wavelength ratio for which the best performance would be achievable [11]. Weber et al. [15] used tubercles on the leading edge of rudder and found that the tubercles enhance lift at high angles of attack, as well as cause a more favorable control during turning. Industrial fans with leading edge protuberances on the blades have also been produced by a Canadian company who reported on the efficiency improvement, electricity consumption and noise level [16].
The use of tubercles technology in power generation through renewable resources has also shown its effectiveness. For example, a 35 kW wind turbine which utilized tubercles technology on its blades has been introduced and tested. The test results showed that this design produced more electricity at moderate wind speeds [17].
Chen et al. [18] carried out an experimental study on delta wings with low swept angle fitted with various sinusoidal leading edges. Although the results showed almost no change in lift-to-drag ratio, the stall is delayed with no penalty on the maximum lift coefficient. This fact would be very significant for maneuverability and agility of aircrafts using swept wings.
However, the mechanism of the leading edge pattern geometry on the flow structures generated is not well understood yet. Hence, the aim of this work is to study the effect of different geometrical patterns on a flat plate leading edge on the structure of streamwise vortices generated in its boundary layer by means of some flow visualization techniques.
2. Experimental Details
2.1. Test Plates
Three Plexiglas test flat plates were prepared, and each has dimensions of 3 mm in thickness, 158 mm in width and 660 mm in length. The leading edge patterns of these plates are saw tooth, semi-circle and slots with 15 mm wavelength (λ) and 7.5 mm amplitude (A) as shown in Figure 1.
2.2. Wind Tunnel
The experiments were performed in a small open-circuit, low speed, blow down type wind tunnel as shown in Figure 2 with maximum flow speed of 35 m/s and freestream turbulent intensity of less than 0.25%. The wind tunnel has a three-dimensional contraction ratio of 9.8:1, which is followed by a test section with cross-section of 160 mm by 160 mm.
2.3. Visualization Techniques
The visualizations were carried out by using smoke-wire

Figure 1. Flat plate leading edge patterns.
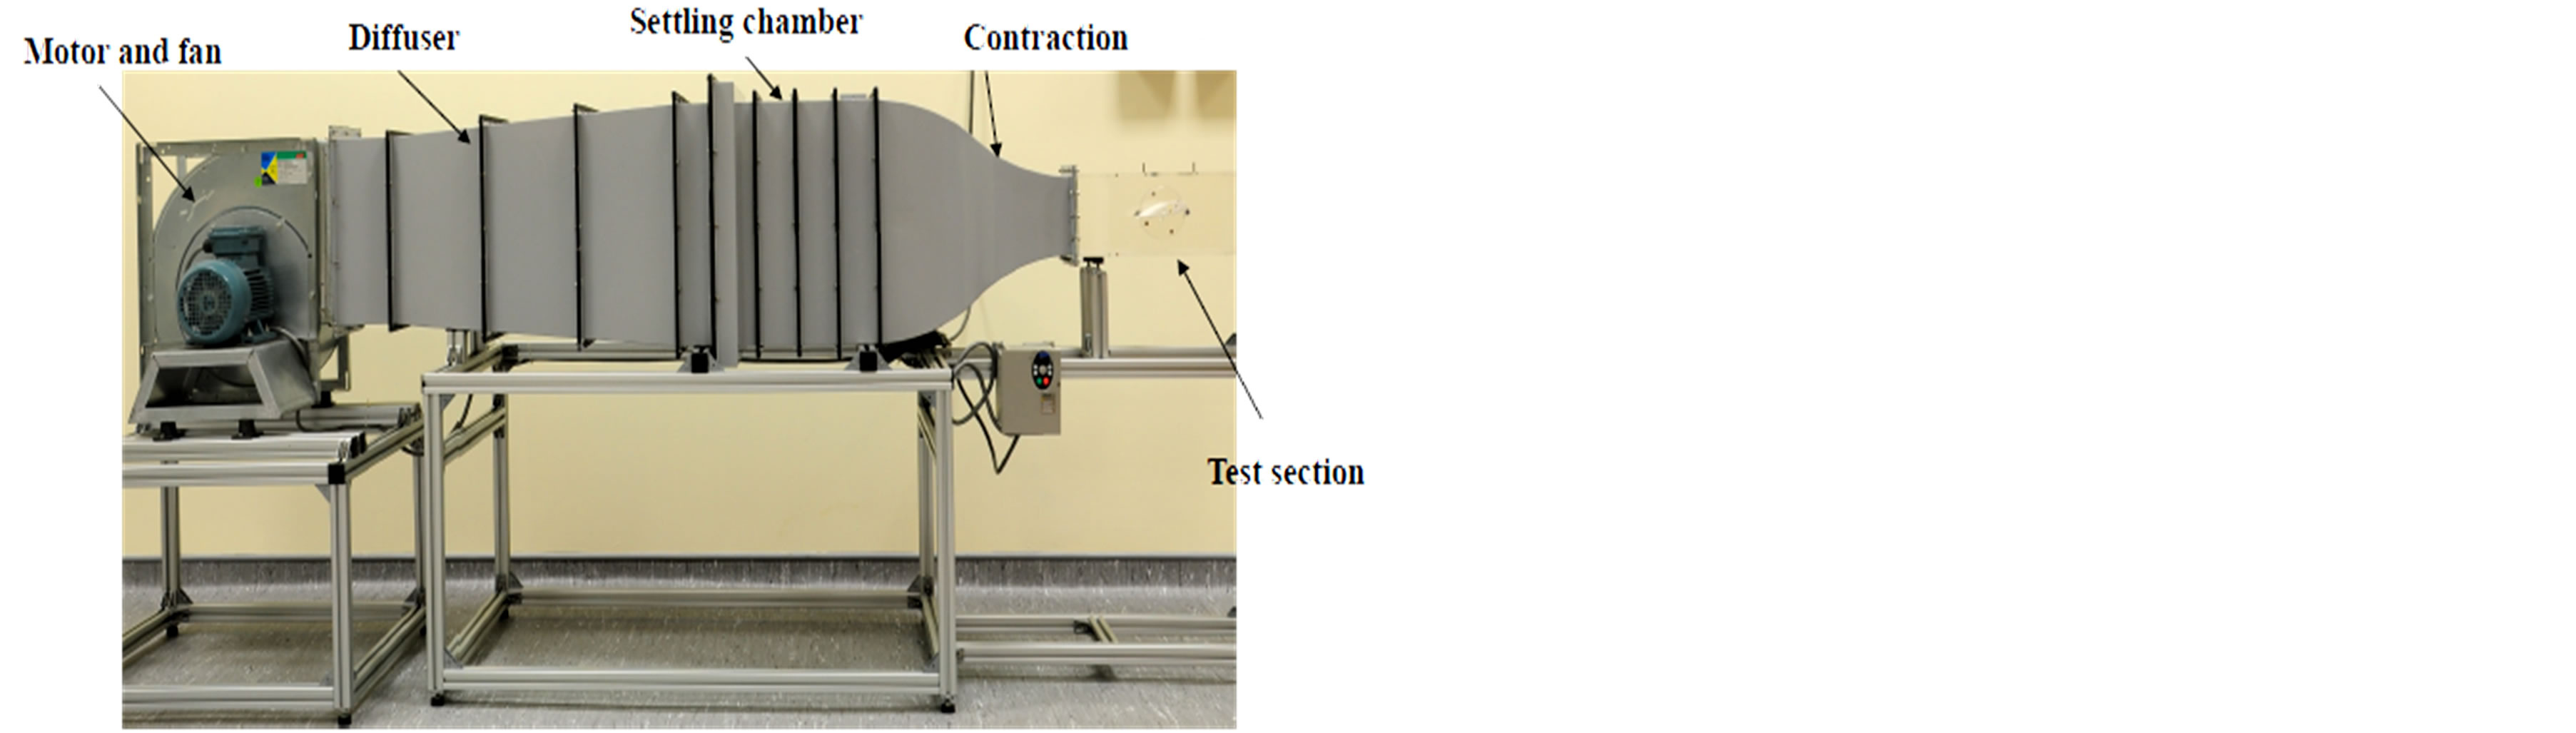
Figure 2. The wind tunnel used for experiments.
flow visualization and surface sublimation techniques. The smoke-wire visualization setup consists a thin chrome-chromium wire of 0.193 mm in diameter and a pressurized container of Paraffin oil. To study the flow field and vortex structures, the thin wire was placed parallel to the leading edge of the plate. The thin layer of smoke generated by the thin wire in the boundary layer region was then illuminated by a green laser light sheet. To photograph the flow field, a camera was positioned at a distance from tunnel outlet and also perpendicular to test plate to obtain the “top view”. The other visualization technique used is Sublimation, which is one of the most common methods for surface flow visualization. In this work, a Naphthalene-Acetone solution was used to provide a white coating over the surface of interest.
2.4. Experimental Procedure
Each plate is placed vertically in the middle of the wind tunnel test section. To adjust the position of the smokewire with respect to the leading edge, a traversing mechanism is used such that the smoke wire could be traversed across the test section and its position relative to the plate can be finely adjusted. The schematic of the experimental setup is shown in Figure 3. A green light laser sheet (of 532 nm wavelength) is used to illuminate the flow field. The positions of the camera to record the visualizations are also shown in Figure 3. It is observed within the Reynolds number Re of 1540 to 3850 that a buoyancy effect and a smoke distortion are not present. Thus, the structures observed in the visualization results are genuinely due to the appearance of the vortices in the boundary layer flow.
3. Results and Discussion
Visualization results were obtained at some streamwise positions (x) from the flat plate leading edge at different Reynolds numbers (based on the wavelength of leading edge patterns) ranging from 1540 to 3850 which correspond to the flow velocities ranging from 1.5 to 3.75 m/s. For all the patterns, the top view of the visualization results show that there is an oval region after each valley as shown in Figure 4. These regions are formed due to the fact that the plate at the valley is thicker than at the leading edge, which causes an upwash flow so that the boundary layer is considerably developed in a comparatively short distance. Within this region, the low momentum fluid lifted up by upwash movement cannot penetrate the high momentum flow in the freestream. It causes the flow to be deflected down ward resulting in the entrainment of the high momentum fluid in a downwash region and the appearance of a pair of counter rotating vortices. The vortices after the oval region break down to turbulence with no distinguishable vortex structure. In other words, the occurrence of streamwise vortices increases mixing as it causes the entrainment of the high momentum fluid into the boundary layer in the downwash region. The increase of mixing is responsible in the early occurrence of turbulent flow.
It is visualized in Figure 4(c) that the use of slots results in the appearance narrower upwash flow and consequently the formation of narrower streaks than those
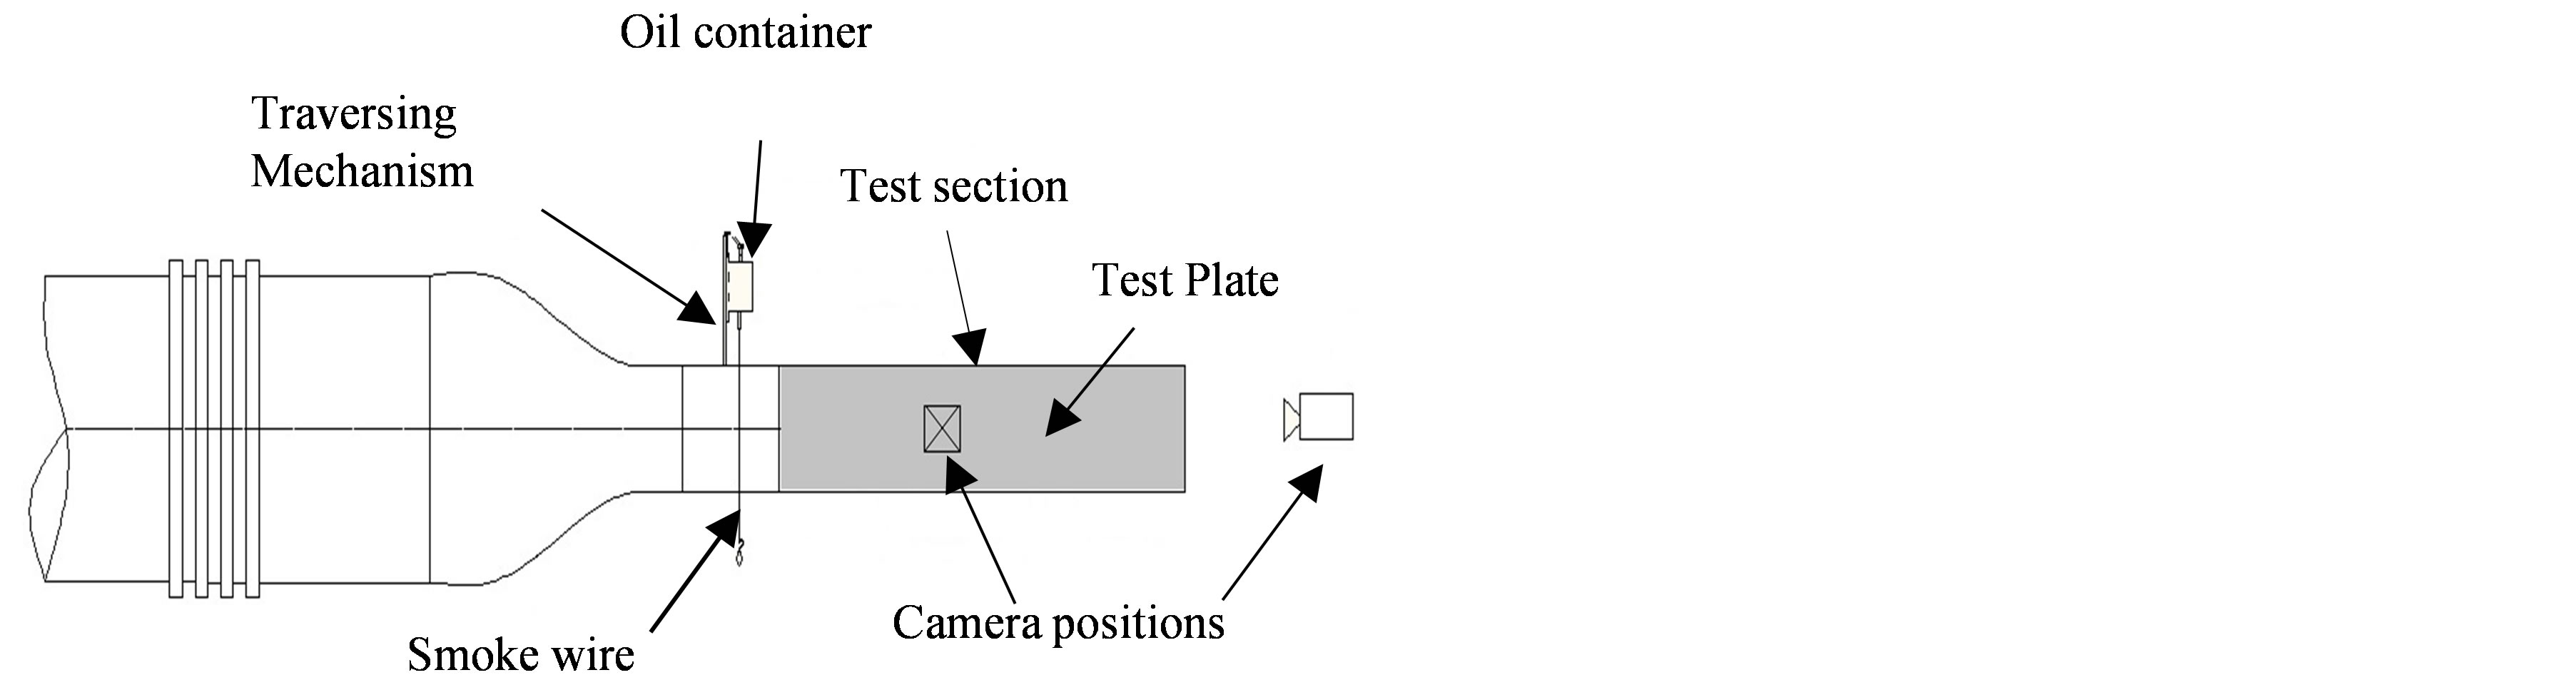
Figure 3. Schematic of experimental setup.
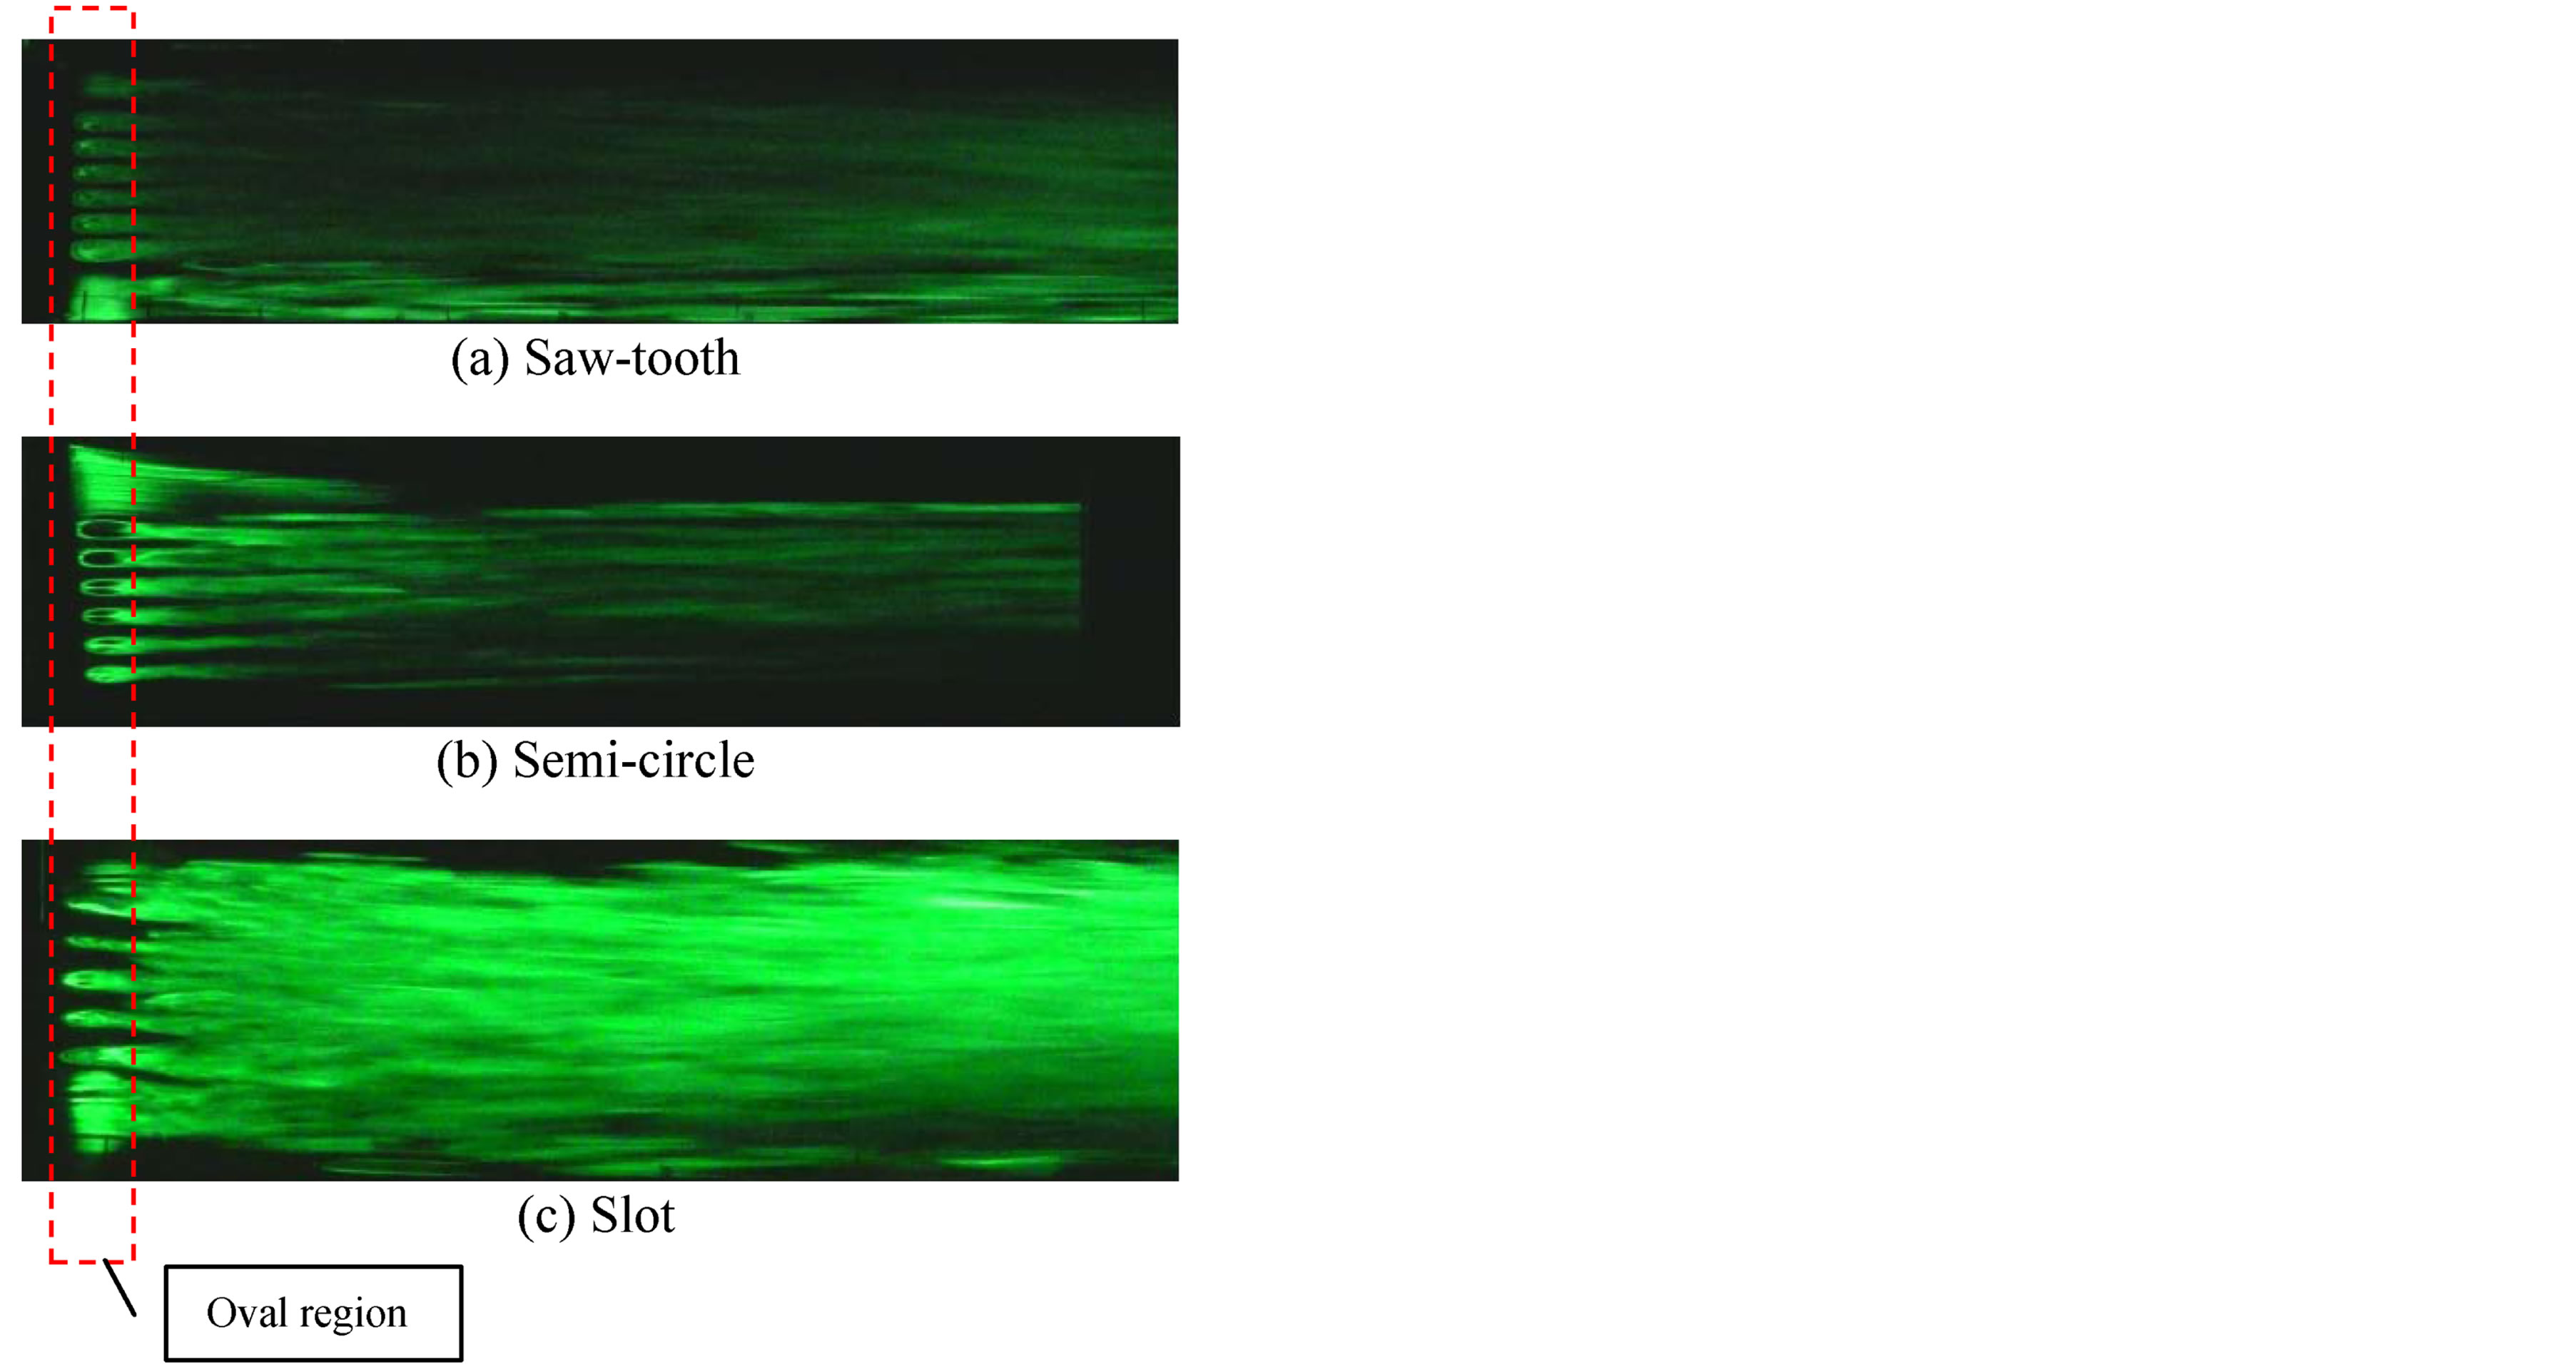
Figure 4. Smoke streaks over flat plates with leading edge patterns at Re = 1540.
presented in Figures 4(a) and (b). As the flow evolves downstream, additional streaks are formed in the area between the main streaks. As the flow evolves further, these streaks are diffuse which could indicate the earlier occurrence of turbulent flow than those presented in Figures 4(a) and (b).
To investigate the vortex structures, the laser light sheet was illuminated normal to the surface at distance x of 10, 20, and 30 mm from the leading edge. The effects of leading edge pattern on the vortex structures for x = 10 mm and Re = 1540 are shown in Figure 5. For all the leading edge patterns, the visualization results show the occurrence of pairs of counter-rotating vortices in the form of mushroom-like structures which evolve and develop in the streamwise direction and then break down prior to turbulence. However, for the case of the leading edge with slots, there are additional counter-rotating vortices corresponding to the additional streak presented in Figure 4(c). The occurrence of additional vortices can be related to the space between the main vortices that is wider than those in Figures 5(a) and (b). Thus, since the size of the vortex due to the slot is thinner than those of vortex in Figures 5(a) and (b), it may trigger the formation of additional vortices to fulfill the continuity.
The vortex structures at location of 30 mm from leading edge are shown in Figure 6 for Re = 1540. At this location the mushroom-like structures are fading away as the mixing becomes more prominent prior to turbulence. For the case of the leading edge with slots, the merging process of additional vortices and main vortices is observed. It may explain the diffuse of the streaks visualized in Figure 4(c).
To find out the effect of Reynolds number on the evolution of the vortices, the flow visualizations were carried out for the same sections at the Re = 3850. The results of these visualizations are presented in Figures 7 and 8. As shown in Figure 7, at 10 mm downstream of the leading edge, the vortex outline of all cases are recognizable, however unlike those presented in Figure 5, the engulfment phenomena are not clearly visualized. In comparison with the visualization results at lower Reynolds number, the vortices are greater in size and the vortex structures are unclear, although they are not completely broken down. This may indicate that the flow is still in laminar region but the perturbations generated by the leading edge pattern have been more amplified than those at Re = 1540.
Another interesting thing which is in common between all visualization results is that the plate with saw-tooth leading edge has the largest vortices in size in comparison to the rest. This shows that this pattern causes the vortex grows as possible as it can.
The breakdown of the structures is evident in Figure 8 as indicated by the diffuse of the mushroom-like structures prior to turbulence. The occurrence of upwash and
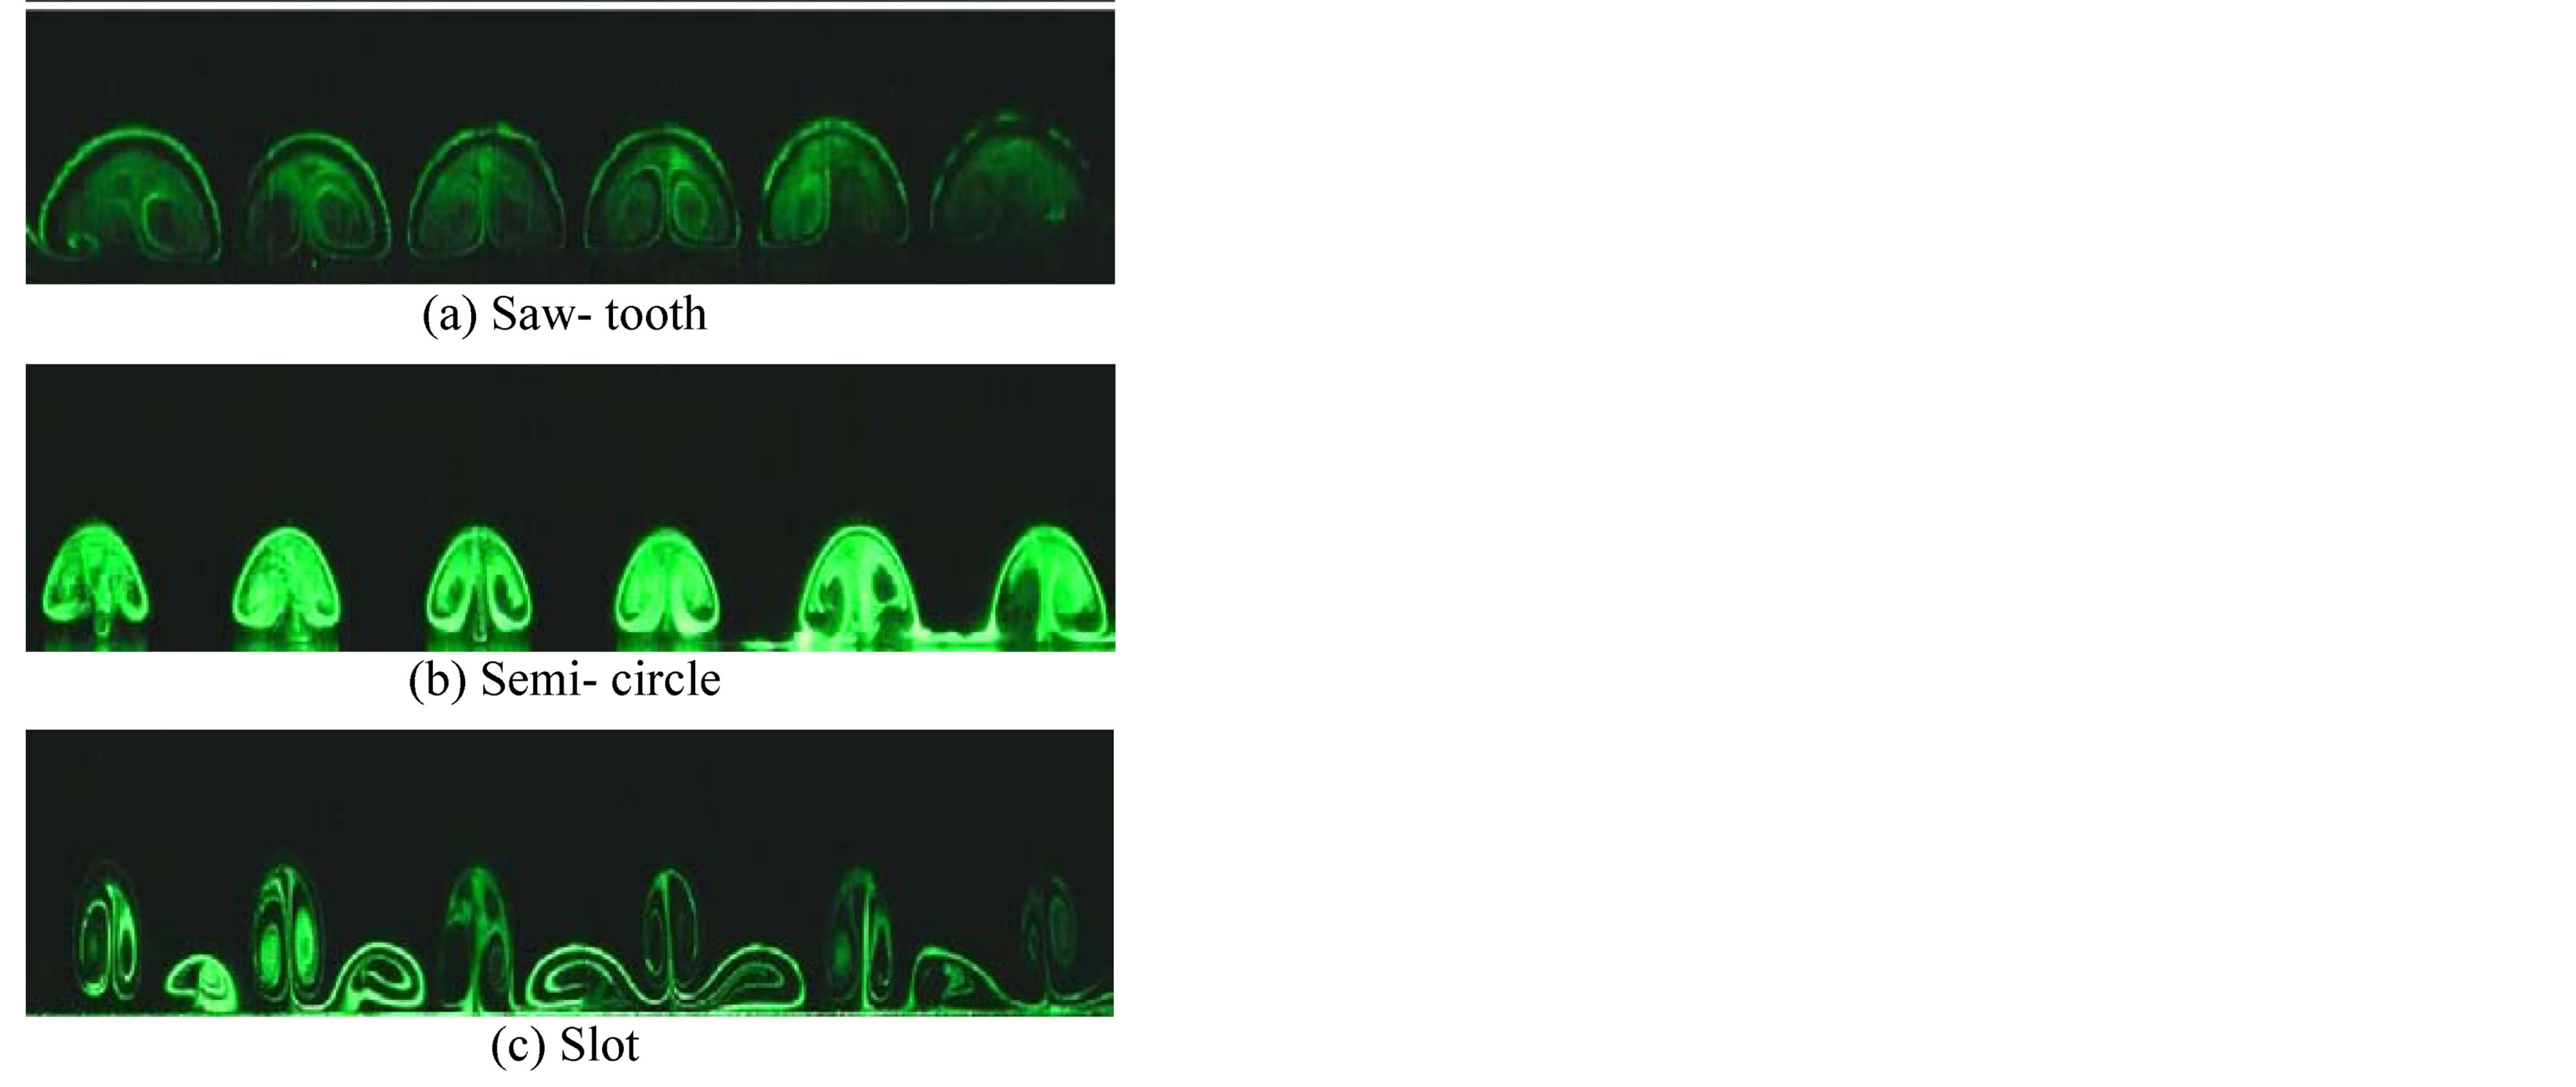
Figure 5. Cross sectional view of flow visualization for Re = 1540 and at x = 10 mm.

Figure 6. Cross sectional view of flow visualization for Re = 1540 and at x = 30 mm.

Figure 7. Cross sectional view of flow visualization for Re = 3850 and at x = 10 mm.

Figure 8. Cross sectional view of flow visualization for Re = 3850 and at x = 30 mm.
downwash regions results in the variation of shear along the spanwise direction in which the highest shear occurs in the downwash region while the lowest in the upwash region.
To visualize this spanwise variation of wall shear stress, a Naphthalene sublimation technique was used. In this method, the mix of naphthalene and acetone solution was sprayed onto the plate surface. It will sublimate faster in the region of high shear stress [19] and leave the surface clean from naphthalene-acetone solution. In Figure 9, the regions of high wall shear stress are indicated by the appearance of black area on the surface where the naphthalene-acetone solution has sublimated completely. On the other hand, the white area is the area where the naphthalene-acetone solution did not sublimate completely due to the lower shear than those in the black region. As evident in Figure 9(c), two high wall shear stress regions are formed between two slots indicating the appearance of two downwash regions between the slots due to the occurrence of two additional vortices at both sides of the main counter-rotating vortices at the slots, as observed in Figure 5(c).
4. Conclusions
Flow visualization has been carried out to qualitatively study the development and structures of streamwise vortices generated by different flat plate leading edge patterns of saw-tooth, semi-circular and slots with the same amplitude and wavelength (spanwise spacing). The experiments were carried out for Reynolds number ranging from 1540 to 3850 based on the wavelength of each pattern. For all cases, pairs of counter-rotating vortices appeared and grew in the streamwise direction immediately downstream of each trough (or valley) of the patterns, which increased the flow mixing and led the flow to become turbulence earlier.
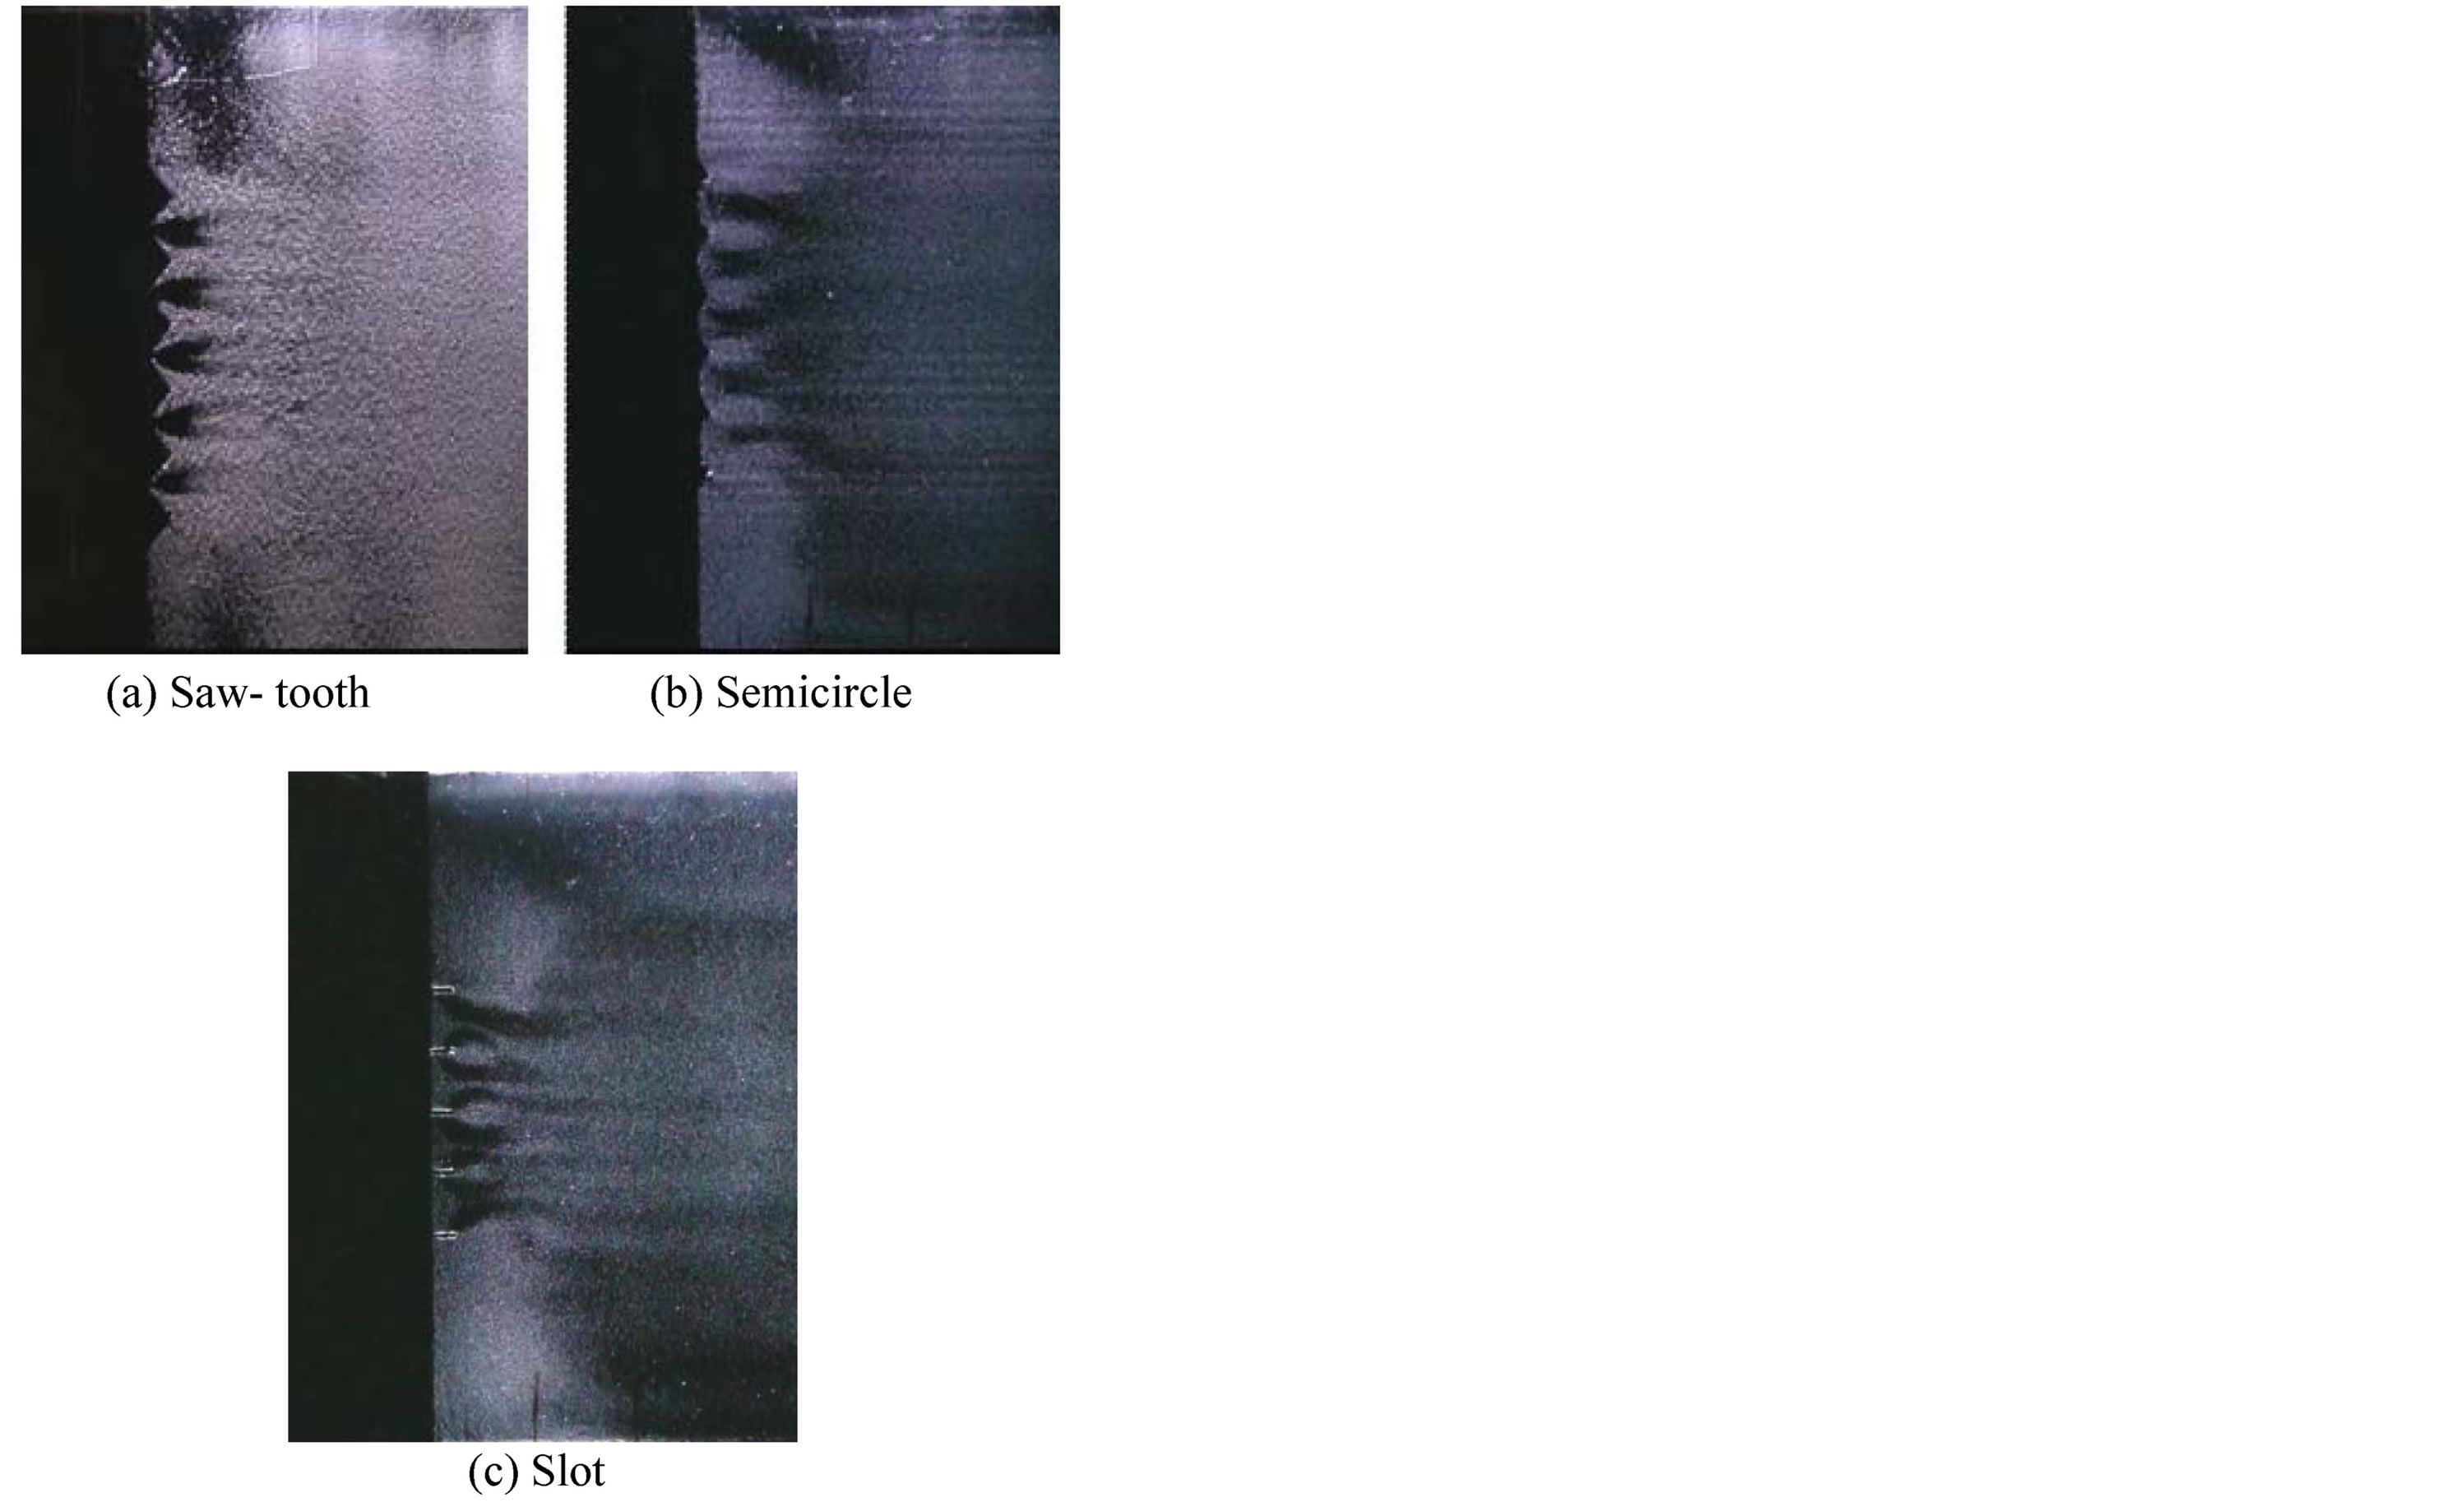
Figure 9. Surface visualization at Re = 1540.
The use of leading edge pattern has successfully preset the number of vortex pairs formed that is equal to the number of troughs (or valleys) of each pattern, except for the plate with slots which has additional vortices which flank the main counter-rotating vortices. The visualization results show that the vortex structures grow along the streamwise direction and diffused prior to turbulence. Increasing the Reynolds number caused the vortex structures to break down earlier. The size of the vortices is also affected by the Reynolds number.
It is evident from the naphthalene sublimation surface visualization results that the highest wall shear stresses occur in the downwash regions of each pair of counterrotating vortices.
REFERENCES
- G. Godard and M. Stanislas, “Control of a Decelerating Boundary Layer. Part 1: Optimization of Passive Vortex Generators,” Aerospace Science and Technology, Vol. 10, No. 3, 2006, pp. 181-191. http://dx.doi.org/10.1016/j.ast.2005.11.007
- J. C. Lin, V. Selby and F. Howard, “Exploratory Study of Vortex-Generating Devices for Turbulent Flow Separation Control,” 29th Aerospace Sciences Meeting, Reno, 7-10 January 1991, 16 p. http://dx.doi.org/10.2514/6.1991-42
- A. M. Kuethe, “Effect of Streamwise Vortices on Wake Properties Associated with Sound Generation,” Journal of Aircraft, Vol. 9, No. 10, 1972, pp. 715-719. http://dx.doi.org/10.2514/3.44333
- G. W. Anderson, “An Experimental Investigation of a High Lift Device on the Owl Wing,” United States, 1973, 89 p.
- F. E. Fish and J. M. Battle, “Hydrodynamic Design of the Humpback Whale Flipper,” Journal of Morphology, Vol. 225, No. 1, 1995, pp. 51-60. http://dx.doi.org/10.1002/jmor.1052250105
- F. E. Fish, P. W. Weber, M. M. Murray and L. E. Howle, “The Tubercles on Humpback Whales’ Flippers: Application of Bio-Inspired Technology,” Integrative and Comparative Biology, Vol. 51, No. 1, 2011, pp. 203-213. http://dx.doi.org/10.1093/icb/icr016
- P. T. Soderman, “Aerodynamic Effects of Leading-Edge Serrations on a Two-Dimensional Airfoil,” United States, 1972, 39 p.
- D. S. Miklosovic, M. M. Murray, L. E. Howle and F. E. Fish, “Leading-Edge Tubercles Delay Stall on Humpback Whale (Megaptera novaeangliae) Flippers,” Physics of Fluids, Vol. 16, No. 5, 2004, p. L39. http://dx.doi.org/10.1063/1.1688341
- B. Stein and M. Murray, “Stall Mechanism Analysis of Humpback Whale Flipper Models,” Proceedings of Unmanned Untethered Submersible Technology (UUST), UUST05, Durham, 21-24 August 2005, 5 p.
- H. Johari, C. W. Henoch, D. Custodio and A. Levshin, “Effects of Leading-Edge Protuberances on Airfoil Performance,” AIAA Journal, Vol. 45, No. 11, 2007, pp. 2634-2642. http://dx.doi.org/10.2514/1.28497
- K. L. Hansen, R. M. Kelso and B. B. Dally, “Performance Variations of Leading-Edge Tubercles for Distinct Airfoil Profiles,” AIAA Journal, Vol. 49, No. 1, 2011, pp. 185- 194. http://dx.doi.org/10.2514/1.J050631
- D. S. Miklosovic, M. M. Murray and L. E. Howle, “Experimental Evaluation of Sinusoidal Leading Edges,” Journal of Aircraft, Vol. 44, No. 4, 2007, pp. 1404-1408. http://dx.doi.org/10.2514/1.30303
- B. Cranston, C. Laux and A. Altman, “Leading Edge Serrations on Flat Plates at Low Reynolds Number,” 50th AIAA Aerospace Sciences Meeting Including the New Horizons Forum and Aerospace Exposition, Nashville, 9-12 January 2012.
- E. A. Van Nierop, S. Alben and M. P. Brenner, “How Bumps on Whale Flippers Delay Stall: An Aerodynamic Model,” Physical Review Letters, Vol. 100, No. 5, 2008, Article ID: 054502. http://dx.doi.org/10.1103/PhysRevLett.100.054502
- P. W. Weber, L. E. Howle and M. M. Murray, “Lift, Drag, and Cavitation Onset on Rudders with Leading-Edge Tubercles,” Marine Technology, Vol. 47, No. 1, 2010, pp. 27-36.
- Ontario Power Authority, “Energy Efficient Fans Take Their Cue from the Humpback Whale,” 2010. http://archivepowerauthority.on.ca/Storage/122/16957_AgNews_July231.pdf
- L. E. HOWLE, “A Report in the Efficiency of a WhalePower Corp. 5 Meter Prototype Wind Turbine Blade,” Whalepower Wenvor Blade, BelleQuant, LLC, Durham, 2009.
- H. Chen, C. Pan and J. Wang, “Effects of Sinusoidal Leading Edge on Delta Wing Performance and Mechanism,” Science China Technological Sciences, Vol. 56, No. 3, 2013, pp. 772-779. http://dx.doi.org/10.1007/s11431-013-5143-3
- Z. Sui-Han, Y. Yong and L. Dong, “Experiments of CrossFlow Instability in a Swept-Wing Boundary Layer,” in 27th Congress of the International Council of the Aeronautical Sciences, ICAS2010, Nice, 19-24 September 2010.