Open Journal of Earthquake Research
Vol.3 No.2(2014), Article ID:46502,18 pages
DOI:10.4236/ojer.2014.32009
Large-Scale Fluidization Features from Late Holocene Coseismic Paleoliquefaction in the Willamette River Forearc Valley, Central Cascadia Subduction Zone, Oregon, USA
Curt D. Peterson1, Kurt Kristensen2, Rick Minor3
1Portland State University, Portland, USA
2Evergreen School, Hillsboro, USA
3Heritage Research Associates, Eugene, USA
Email: curt.d.peterson@gmail.com, kristenk@hsd.k12.or.us, RickMinorHRA@aol.com
Copyright © 2014 by authors and Scientific Research Publishing Inc.
This work is licensed under the Creative Commons Attribution International License (CC BY).
http://creativecommons.org/licenses/by/4.0/


Received 15 March 2014; revised 12 April 2014; accepted 7 May 2014
ABSTRACT
A search of Willamette River cutbanks was conducted for the presence of late Holocene paleoliquefaction records in the Willamette forearc valley, located 175 ± 25 km landward from the buried trench in the central Cascadia subduction zone. Eight cutbank sites are reported that show evidence of large-scale fluidization features (≥10 cm width) including clastic sand dikes and intruded sand sills in Holocene overbank mud deposits. The targeted alluvial sequences, and hosted paleoliquefaction records, are of late Holocene age, as based on radiocarbon dating, flood silt thickness (≤4 m thickness), and minimal consolidation of dike sand (~1.5 ± 0.5 kg∙cm−2 unconfined compressive strength). Two of the paleoliquefaction sites, which are separated by 150 km distance, overlap in age (175 - 500 yr BP) with the last great megathrust rupture (Mw 8.5 - 9.0) in the Cascadia margin, dated at AD 1700. The scarcity of exposed late Holocene paleoliquefaction sites in the Willamette River cutbanks motivated subsurface searches for thick basal sand deposits and overlying fluidization features, using floodplain geomorphological analyses, ground penetrating radar, and remote pole-camera scans of deep trench walls (3 - 4 m depth). The onset of large-scale fluidization features occurred in overbank mud deposits (2 - 3 m thickness) above unconsolidated sand bodies (≥2 m thickness) with unconfined compressive strengths of ~1.5 ± 0.5 kg∙cm−2. We recommend geomorphically-targeted subsurface explorations rather than traditional cutbank searches for evidence of coseismic paleoliquefaction in high-gradient river valley systems.
Keywords:Paleoliquefaction, Clastic Dike, Late Holocene, Cascadia Subduction Zone

1. Introduction
Field investigations were undertaken in this study to test previous field reports, which stated that large-scale paleoliquefaction was absent in the latest Holocene deposits in the Willamette forearc valley of the central Cascadia convergent margin [1] [2] . The Willamette forearc valley and its main tributary, the Willamette River extends north-south between the Cascade volcanic arc to the east and the uplifted Oregon Coast Range to the west (Figure 1). The Willamette Valley should be within reach of potential seismic shaking from megathrust ruptures of the Cascadia subduction zone [3] . The largest ruptures (>300 km rupture lengths) in the central Cascadia margin [4] [5] should yield Mw 8.5 ± 0.5 earthquakes that reoccur every few hundred years [6] . The last event (circa AD 1700) is known to have produced widespread evidence of paleoliquefaction along the Washington and Oregon coasts [7] -[10] and in the lower Columbia River valley [11] -[13] . The reported lack of large-scale clastic dikes and sills (≥10 cm in width) in the Willamette Valley has contributed to informal speculation that the Oregon portion of the subduction zone megathrust might be aseismic, weakly coupled, or highly segmented [14] , thereby precluding Mw 8 ruptures.
In this study two reaches of the Willamette River were initially searched for evidence of large-scale fluidization features (≥10 cm width) in late Pleistocene deposits that are exposed in modern cutbanks. Following documentation of large-scale clastic sand dikes and sills in the late Pleistocene deposits, more focused searches for similar features were conducted in late Holocene deposits. Late Holocene paleoliquefaction sites were present but rarely exposed in the artificially modified riverbanks. New approaches were developed to search for subsurface evidence of large-scale paleoliquefaction. High-resolution topographic analyses, ground penetrating radar, and deep mechanical trenching were successfully used to find and test thicker sand beds and overlying overbank mud deposits for intruded clastic dikes and sills. An argument is made for subsurface investigations in high-gradient river valleys where bank stabilization efforts have preferentially covered rare sandy cutbank sequences. These results should have relevance to other high-gradient forearc valley settings where cutbank surveys for paleoliquefaction evidence have yielded negative or uncertain results.
2. Background
Historic earthquakes in the Puget forearc valley of western Washington (Figure 1) reached magnitudes of 7.1 in
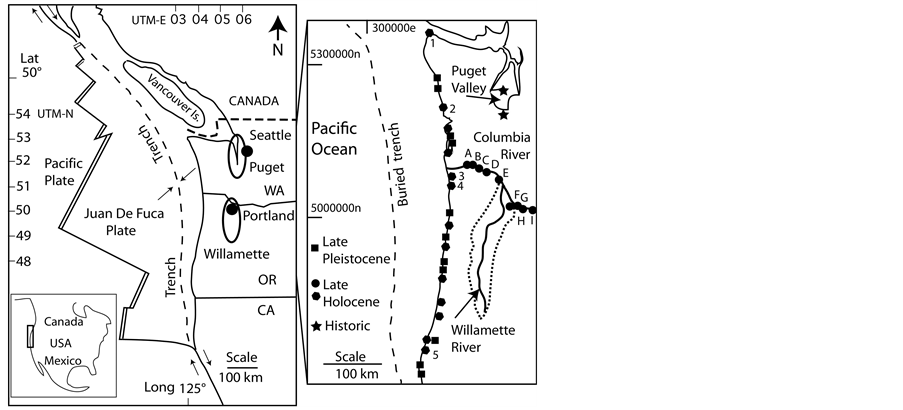
Figure 1. Location of Willamette and Puget forearc valleys (bold ellipses) are shown in the central Cascadia margin. Coseismic liquefaction (solid stars) occurred in historic time (1949, 1965, 2001) in the Puget Valley. Paleoliquefaction sites in late Pleistocene coastal deposits (solid squares), latest Holocene coastal sites (solid polygons, some numbered) and lower Columbia River sites (solid circles, lettered) are geo-referenced in Table 1. Unidentified coastal sites are from C. Peterson, unpublished data (2000-2010).

Table 1. Latest Holocene paleoliquefaction sites in the central Cascadia coast and in the lower Columbia River valley.
Notes: UTM 10T coordinates (m) NAD83. Coastal sites (numbers), Columbia River sites (letters). Settings include back-barrier wetland (bw), tidal marsh (tm), river cut bank (cb), floodplain (fp). Hosting deposit lithologies (Host) include unconsoldidated peat (p), mud (m), sand (s). Fluidization features include clastic dikes (cd) clastic sills (cs), sand volcano (sv). All feature widths are from trenches or cutbanks, except some deep clastic sills in vibracore (*). Feature width (cm) is the maximum observed for the first feature type (cd or sc) listed under the fluidization column. See Figure 1 for mapped locations of coseismic paleoliquefaction sites.
1949 and 6.5 in 1965. These intraslab or descending plate sources caused widespread liquefaction at ≤70 km distance from the epicenter [15] and led to early adoption of rigorous seismic design standards in western Washington. A more recent damaging earthquake (magnitude 6.8 in 2001) located at the south end of the Puget Valley produced liquefaction in susceptible deposits at distances ≤25 km from the epicenter [16] . No earthquakes of such magnitude have occurred in historic time, nearly two centuries before present, in the adjacent Willamette forearc valley in western Oregon [17] [18] .
Work on Cascadia subduction zone earthquakes in the mid-1980s revealed coastal coseismic subsidence events and associated paleotsunamis that recurred every several hundred years [19] [20] . The last megathrustrupture, possibly correlated to a trans-Pacific Ocean tsunami at AD 1700 [21] could have reached Mw 8.5 - 9.0. Such large magnitude earthquakes should have produced wide-scale paleoliquefaction evidence (~100 km distance from epicenters) potentially reaching the forearc valleys (Figure 1). Evidence of large-sale fluidization features, dikes and sills (≥10 cm width) were documented in late Pleistocene marine terraces throughout the coasts of Washington and Oregon [13] . However, questions remain about the potential for seismic shaking in the central Cascadia forearc valleys (50 - 150 km distance from the coast) from megathrust ruptures in the central Cascadia subduction zone.
Coseismic fluidization features in late Holocene deposits have been widely observed during investigations of coseismic subsidence and paleotsunami inundation along the coast (Figure 1; Table 1). The clastic sand dikes and sills (10 - 30 cm width) in Sites 1, 3 and 4 were briefly examined in shallow trenches [7] -[9] . Only two of the coastal paleoliquefaction localities, Site 2 and Site 13, were discovered in river cutbanks [10] [22] . The other large-scale paleoliquefaction sites were encountered during subsurface coring or trenching investigations. The late Holocene fluidization features were most commonly observed in coastal back-barrier settings or low-gradient alluvial settings that contained thin mud layers (1 - 2 m thickness) above thick beds (3 - 5 m thickness) of unconsolidated saturated sand.
To address questions about the landward reach of strong shaking from earthquakes in the central Cascadia margin a search for paleoliquefaction evidence was initiated in the lower Columbia River valley (Figure 1), leading to the documentation of wide-spread paleoliquefaction evidence (25 - 150 km landward from the coast) (Table 1) [13] . The shallowest fluidization features were directly correlated to the last Cascadia megathrust rupture, based on the correlation of sand venting and coseismic subsidence in the Columbia River estuary. Some of the larger clastic dikes and sills were investigated for the geotechnical properties of subsurface sand deposits that could have contributed to the paleoliquefaction [23] -[26] . Recent dating of exposed channel bank deposits in the lower Columbia River [27] [28] shows that most of the cutbank sequences were just old enough to have recorded the last Cascadia event at 0.3 ka, but not the older megathrust events >1.0 ka [6] .
3. Methods
This investigation of large-scale fluidization features, including clastic sand dikes and intruded sand sills in the Willamette Valley was initiated with a preliminary search of late Pleistocene deposits in modern cutbanks of the Willamette River. The late Pleistocene deposits were examined for paleoliquefaction evidence by floating a northern section and a southern section of the Willamette River (Figure 2) during the lowest river water levels. Clastic sand dikes and sills that were exposed in the cutbanks were measured for maximum width (1 cm scaled rule) and range of subsurface depths (±0.5 m) measured at the cutbank.
After confirming the presence of large-sale paleoliquefaction sites in late Pleistocene deposits, further searches targeted late Holocene deposits in the Willamette River cutbanks. Exposures of Holocene deposits in cutbanks were predicted from geomorphic analyses of low terrace surfaces (NED 1/3 arc sec DEM) [29] and truncated meander features including oxbow valleys, scroll bar ridges, and braided or elongate channel ridges adjacent to the modern channel(s). Late Holocene sequences in exposed cutbanks were identified on the bases of 1) overbank mud thickness (≤4 m thickness), 2) absence of multiple paleosol soil-A horizons [30] in the overbank mud sequences, 3) relatively low values of unconfined compressive strength (1.5 ± 0.5 kg∙cm−2) measured in sandy clastic dikes and sills using a pocket penetrometer ASTM D2573, and 4) radiocarbon dating of hosting overbank mud deposits.
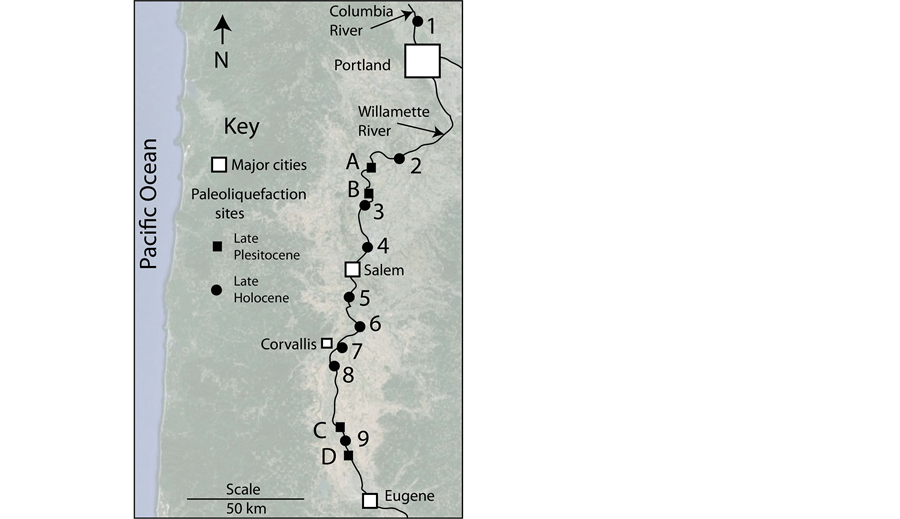
Figure 2. Paleoliquefaction sites that were identified in this study of the Willamette forearc valley include late Pleistocene (lettered) and late Holocene (numbered) sites along the Willamette River. Selected Willamette River cutbanks were examined over a distance of about 150 river kilometers. See Figure 1 for regional tectonic context of the Willamette forearc valley.
Late Holocene cutbank deposits with large-scale clastic dikes and sills (≥10 cm widths) were photographed, geo-referenced (12 channel rtGPSepe ± 5 m), and measured for fluidization feature extents (along bank distances) and maximum widths (1 cm scaled rule). Deposit grain size ranges were estimated in the field from CANAM™ grain-size cards: vcU (1410 - 2000 µm), vcL (1000 - 1400 µm), cU (710 - 1000 µm), cL (500 - 710 µm), mU (350 - 500 µm), mL (250 - 350 µm), and fU (177 - 250 µm).
Due to the rarity of late Holocene sand deposits that were observed in exposed cutbank sequences the search methodologies were changed to subsurface investigations of abandoned or prograded low terraces for evidence of late Holocene paleoliquefaction. The subsurface methods are described in detail in a later section of this paper, but are also briefly outlined here. Late Holocene sites with the potential for large-scale paleoliquefaction (subsurface sand beds ≥2 m thickness) were identified using 1) ground penetrating radar (GPR) imaging (50 MHz 1000v Pro Ekko™ system) and 2) mechanical deep trenching (5 m bucket reach) with digital trench-wall scans (Go-Pro™ pole-camera). Trench walls showing digital-scan evidence of large-scale fluidization features, including sand intrusion pockets, clastic sand dikes and clastic sand sills with intruded sill contact boundaries [13] were excavated in widened trenches [31] . Large-scale fluidization features in the excavated trench walls were documented by 1) scaled photography (15 mp DSLR), 2) scaled-rule measurements of fluidization feature widths, and 3) radiocarbon sampling for AMS analyses [32] of limiting fluidization-age in hosting deposits.
4. Results
4.1. Late Pleistocene Paleoliquefaction
Late Pleistocene paleoliquefaction sites were identified in modern cutbank exposures in the lower and upper sections of the Willamette River (Figure 2 and Figure 3). Fluidization features included clastic sand dikes, sills, and volcanoes. The large-scale clastic dikes and sills, containing sand and/or gravelly-sand, reached 20 - 60 cm in width (Table 2). The extent, scale and timing of late Pleistocene paleoliquefaction sites in the Willamette Valley argue for coseismic origins. Deposit truncation by channel reworking in most of the late Pleistocene paleoliquefaction sites prohibited evaluation of maximum dike height, that is to say vertical length (m), in the exposed vertical cutbank sections. However, the syndepositional erosion or truncation of the clastic dikes and sills helped to constrain the age(s) of the late Pleistocene paleoliquefaction events, as outlined below.
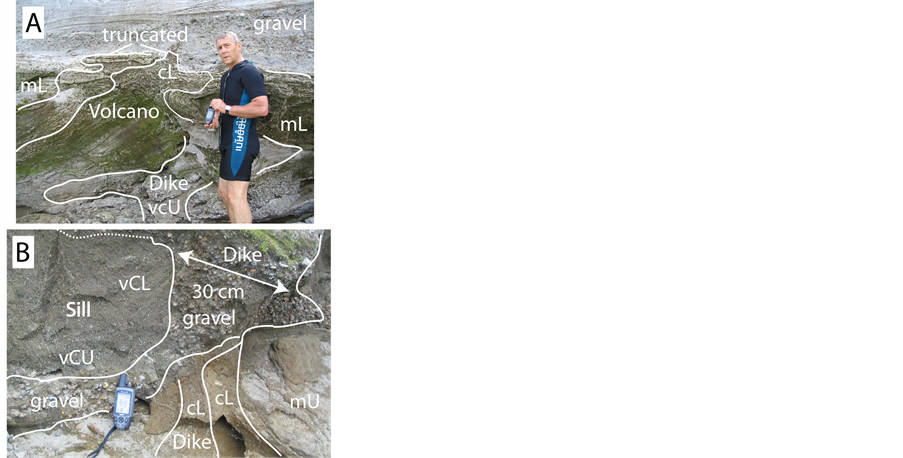
Figure 3. Part A. Large-scale sand volcano and feeder dike in late Pleistocene paleoliquefaction Site A. The sand volcano is truncated by overlying gravel deposits demonstrating syndepositional paleoliquefaction. Part B. Complex fluidization sequence including clastic gravel dike, clastic sand sill, and convoluted sand beds in late Pleistocene paleoliquefaction Site B. Site locations are shown in Figure 2 and are geo-referenced in Table 2.
Table 2 . Paleoliquefaction sites in the Willamette forearc valley, Oregon.
Notes: UTM-10N coordinates (m) NAD83. Willamette River bank sites of late Pleistocene age (letters) and late Holocene age (numbers). Exposure length (m) is an estimate of contiguous riverbank distance containing fluidization features. Exposure depth (top-bottom) is the measured depth (m) of fluidization features relative to the terrace surface at the bank edge. Feature types include clastic sand dikes (cd), clastic sand sills (cs), sand boils (sb), convolute sand beds (cb). Maximum dike widths and maximum sill widths are in centimeters (cm).
4.2. Morpho-Stratigraphic Models
The occurrences of large-scale clastic sand dikes and sills in the late Pleistocene deposits of the Willamette Valley were restricted to overbank mud deposits that were located directly above relatively thick sand beds (3 - 4 m in thickness). Such thick sand beds were rarely observed in the exposed cutbanks. The thicker sand beds occurred above basal gravels [33] so they are interpreted to be accretionary bank deposits rather than crevasse splays. Thin sand beds (≤2 m thickness) were more commonly observed in the cutbanks that exposed late Pleistocene deposits, but they only produced small-scale dikes and sills (≤10 cm width) (Figure 4). The large-scale fluidization features occurred below the pre-Glacial Lake Missoula Flood paleosol (pre-GLMF paleosol) also known as the Post-Diamond Hill paleosol [34] of late Pleistocene age (Figure 4 and Figure 5). No evidence of paleoliquefaction was found in any of the observed cataclysmic Glacial Lake Missoula Flood (GLMF) siltrhythmites [35] . The large-scale clastic dikes in the late Pleistocene deposits were truncated by overlying gravel beds or cross-bedded channel deposits (Figure 3). The paleoliquefaction events were syndepositional with the preserved accretionary bank deposition. In other words, the paleoliquefaction events occurred within the time frames of accretionary bank deposition, presumably at millennial time scales (~1000 yr), in late Pleistocene time. The paleoliquefaction events pre-date cataclysmic outburst floods from glacial Lake Missoula [36] that flooded the Willamette Valley [35] [37] between 19 and 15 ka [38] . No vertically ascending clastic dikes were observed to originate in or penetrate through the pre-GLMF paleosol or the GLMF silts.
4.3. Late Holocene Paleoliquefaction Sites
Cutbank searches for late Holocene paleoliquefaction sites in the Willamette forearc valley were started in the Columbia River at Sauvie Island (Site 1) in the Portland Basin (Figure 2). Large-scale sand boils and clastic dikes feeding collapsed sand boil craters were observed along an eroding cutbank (600 m in length) on the northeast side of the island (Figure 6). A radiocarbon sample at 1.3 m depth was taken from an undisturbed stratum
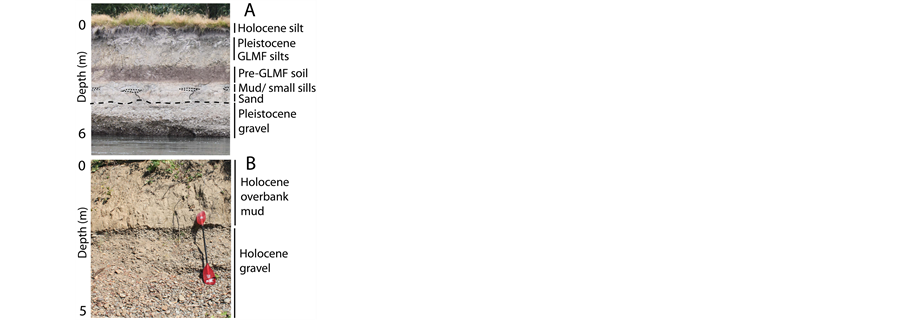
Figure 4. Part A. Late Pleistocene deposits and small-scale fluidization features, (dikes ≤ 10 cm width) and sills (dotted lines), above a thin sand bed (~1.5 m thick) overlying basal gravel beds (dashed line) in a modern cutbank of the Willamette River at late Pleistocene paleoliquefaction Site D. Glacial Lake Missoula Flood rhythmites (GLMF silts) overlie the Post-Diamond Hill paleosol (dark Pre-GLMF soil). No fluidization features were observed in the GLMF silts. Part B. Late Holocene sequence of overbank mud overlying uncemented river gravel in a cutbank exposure (UTM-10N 4936940n, 482580e), located midway between late Holocene paleoliquefaction Sites 6 and 7. The rarity of thick sand beds (>2 m thickness) precluded paleoliquefraction and associated large-scale fluidization features at this site and in the great majority of other cutbank exposures of late Holocene sequences.
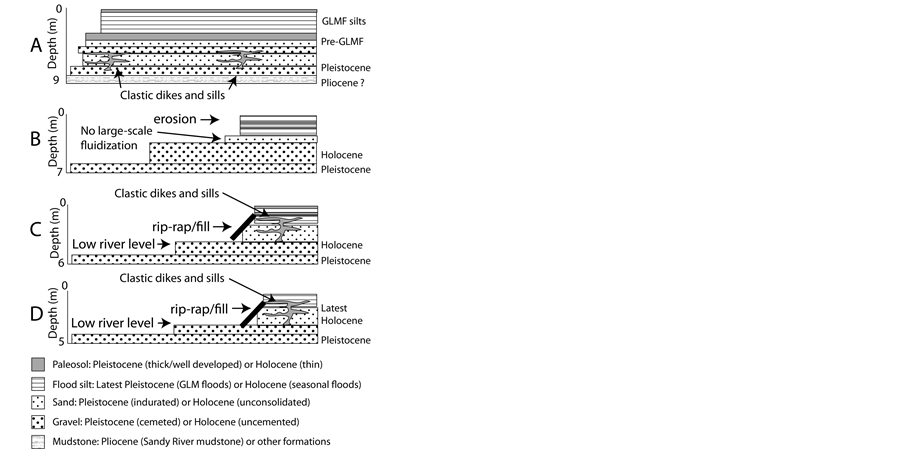
Figure 5. Morpho-stratigraphic models (A-D) are shown for Willamette River cutbank sequences. Thin sand beds (≤2 m thickness) limit the abundance of paleoliquefaction sites and the heights of associated fluidization features in late Pleistocene deposits (A). The lack of thick sand beds between overlying mud deposits and underlying river gravels precludes paleoliquefaction evidence in most exposed late Holocene cutbank sections (B). Though rare in cutbank exposures, some late Holocene sequences do provide sufficient sand bed thickness (≥2 m) to permit coseismic paleoliquefaction and large-scale fluidization features (C and D). Artificial stabilization of the erodible sandy cutbanks in the unconsolidated late Holocene deposits (C and D) preferentially covered the sites with the greatest potential for fluidization evidence of paleoliquefaction.
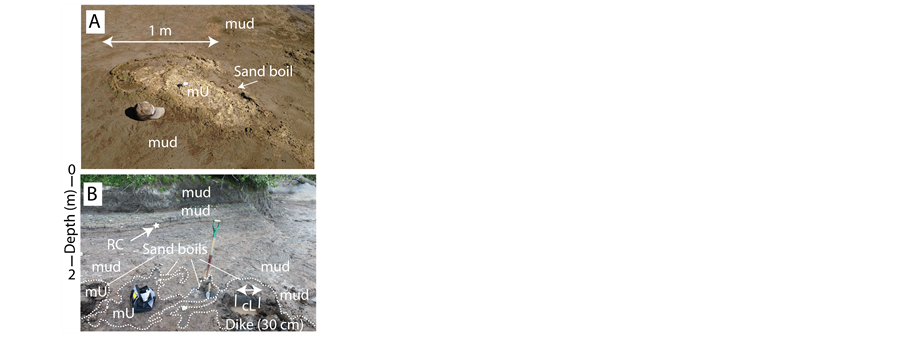
Figure 6. Part A. Truncated sand boil exposed in eroding northeast shoreline of Sauvie Island, Columbia River, OR near late Holocene paleoliquefaction Site 1. Part B. Cutbank exposure showing the stratigraphic relations between 1) truncated sand boils, 2) underlying feeder dikes (30 cm in width) and 3) overlying overbank mud deposits in Site 1, radiocarbon dated (RC) to 2180 - 2305 calibrated years BP (Table 3).
Table 3 . Radiocarbon dates from latest Holocene paleoliquefaction sites.
Notes: Sample site coordinates are shown in Table 1 (CRSR1 and CRSR3) and Table 2 (all other sites). Sample depths (m) are from the cutbank terrace surface. All radiocarbon sample analyses (B#) are from Beta Analytic, Inc. [32] .
located just above the vented sand layers at the top of the sand boils. The sampled yielded a radiocarbon date of 2180 - 2305 (Table 3) confirming that the paleoliquefaction event that produced the abundant sand boils occurred in late Holocene time.
Cutbank searches were extended south of the Portland Basin along the Willamette River where floodplain analyses indicated active channel erosion of late Holocene accretionary bank sequences (Figure 5), as indicated by 1) relatively thin overbank deposits (≤4 m thickness), 2) relatively thin paleosols in overbank deposits, and 3) unconsolidated sand deposits (unconfined compressive strength ≤2.5 kg∙cm−2). Sandy riverbanks were excavated by hand to expose the covered evidence of large-scale fluidization features, such as in Site 2 (Figure 7 and Figure 8). A network of vertically―ascending clastic sand dikes and laterally―intruded clastic sand sills extended from 5.5 to 2.7 m depth subsurface at Site 2 (Table 2).
Large-scale clastic dikes and sills were generally not discovered in unexcavated Holocene cutbanks in the lower reaches of the Willamette River, due to the presence of mud drapes, artificial fill or stone revetment or riprap that covered the unstable cutbanks. Shallow excavations (0.25 - 1.0 m depth) in covered cutbanks revealed clastic sills (10 - 30 cm thick) and dikes (10 - 15 cm thick) at Site 3 (Table 2). A gravelly-sand clastic dike (10 - 30 cm width) was intruded into overbank mud deposits (5.5 - 2.5 m depth subsurface) at Site 4. Thick overbank mud deposits (7 m thick) in Site 5 contained large-scale clastic dikes and sills (20 - 35 cm thick) (Figure 9(A)).
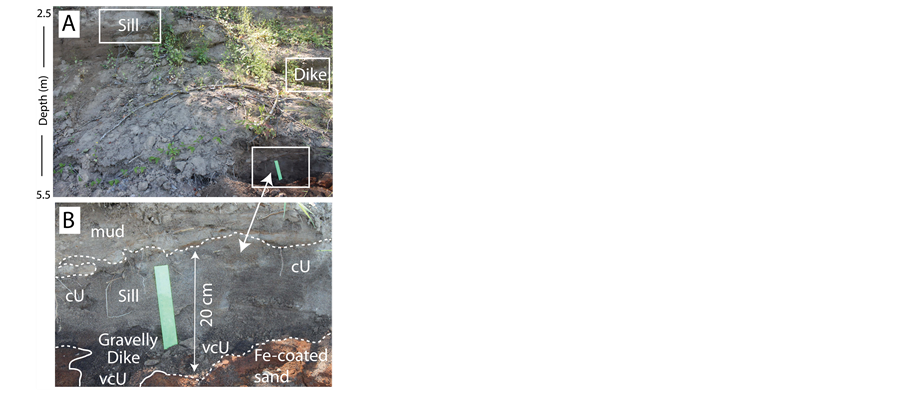
Figure 7. Part A. Covered cutbank at Site 2 showing stratigraphic levels of late Holocene clastic dikes and sills. See Figure 8 for close-up photos of clastic dike (Dike) and clastic sill (Sill) in the middle and upper levels of the cutbank. Part B. Close-up photo of basal clastic gravelly-sand dike and clastic sand sill intruding into mud overbank deposits (above) and iron-hydroxide (Fe) coated sand beds (below) at 4.5 - 5.5 m subsurface depth.
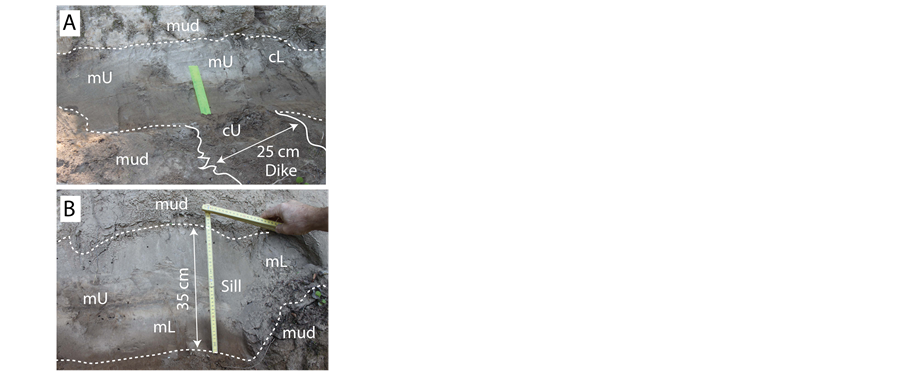
Figure 8. Part A. Clastic sand dike feeding clastic sand sill in middle level (3.0 m subsurface depth) of cutbank in Site 2. Part B. Clastic sand sill intruded into upper level (2.7 m depth) of overbank mud deposits in Site 2.
The fluidization features in Site 5 terminated just below a pair of soil A-horizon paleosols at subsurface depths of 4.0 - 4.5 m. A radiocarbon sample from 4.5 m depth in Site 5 yielded an age of 4150 - 4405 (Table 3). Largescale dikes (20 - 30 cm thick) and intruded sand sills (20 - 60 cm thick) occurred in Site 6 (Figure 9(B)).
Lower cutbank heights (3 - 4 m above low water level) in the upper reaches of the Willamette River reduced the potential for observing substantial vertical extents of clastic dikes and stacked clastic sills. Though largescale fluidization features were identified in the upper reaches of the Willamette River, as exemplified in paleoliquefaction Sites 8 and 9 (Figure 10), the limited exposures of sandy cutbanks required alternative methods to explore for evidence of latest Holocene paleoliquefaction.
4.4. Subsurface Investigations for Latest Holocene Paleoliquefaction Sites
A test locality for subsurface paleoliquefaction investigations (Site 7) became available in conjunction with an
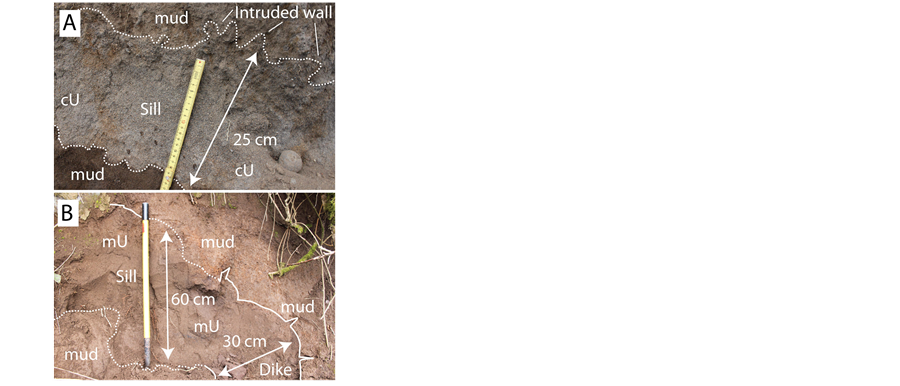
Figure 9. Part A. Clastic sand sill (25 cm thickness) in late Holocene paleoliquefaction in Site 5. The shallowest dikes in Site 5 reached charcoal bearing overbank mud deposits (4.5 m depth), radiocarbon dated at 4150 - 4405 (Table 3). Part B. Clastic sand dike and adjoining sill (60 cm width) in late Holocene paleoliquefaction Site 6. Intruded sand in the thick sill yielded unconfined compressive strengths of 0.75 - 1.25 kg∙cm−2.
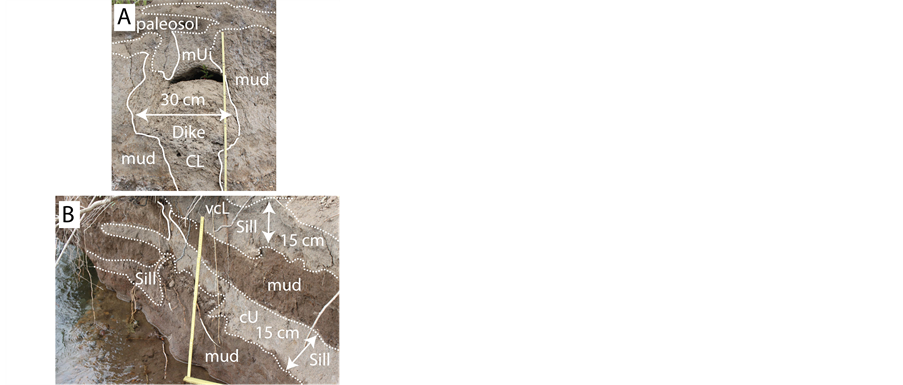
Figure 10. Part A. Gravelly-sand dike (1.25 m in height and 30 cm in width) in Holocene paleoliquefaction Site 8. Part B. Stacked clastic sand sills (15 cm width) and adjoining dikes in late Holocene paleoliquefaction Site 9. Coarse sand in the clastic sills showed unconfined compressive strengths of 0.5 - 1.5 kg∙cm−2.
archaeological survey for a municipal wastewater reclamation project on the east bank of the Willamette River in Corvallis, Oregon (Figure 2) [39] . The project area (~0.11 km2) included 0.5 km of modern cutbank exposures and adjacent floodplain deposits, extending ~0.25 km in perpendicular distance from the modern channel bank (Figure 11 above). Ground penetrating radar profiles (2.8 km trackline distance) discriminated 1) laminated overbank mud deposits overlying basal gravel from 2) cross-bedded sand deposits (1 - 4 m thick) overlying basal gravel (Figure 11 below). Due to thick mud cover (~2 - 3 m) high-frequency GPR (250 - 500 MHz) was not used to image underlying fluidization features at Site 7. High-frequency GPR penetration is reduced in thick overbank deposits due to low signal attenuation in moist silt-clay [40] .
Mechanical trenching (4 m depth subsurface) and down-trench pole-camera scans documented 1) cross-section lithology, 2) absence or presence of paleosols, and 3) absence or presence of fluidization features. Fluidiza-
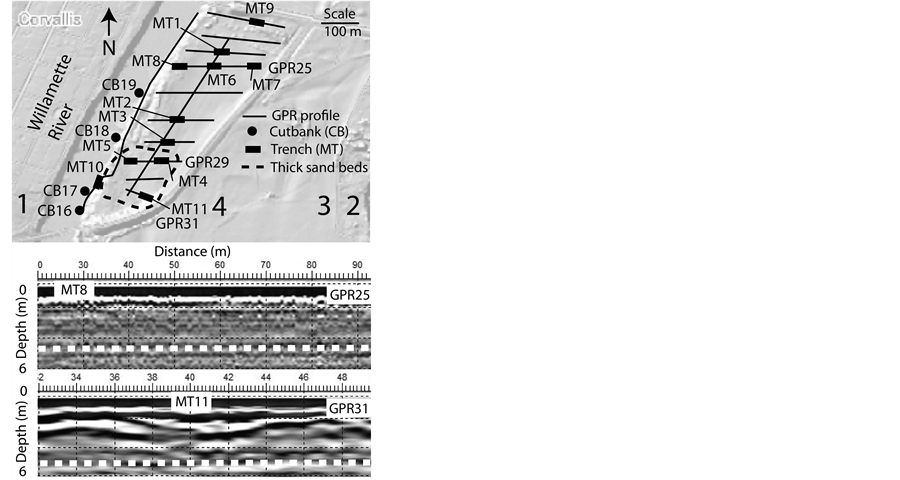
Figure 11. Above: Map of Corvallis terraces (1 oldest-4 youngest), cutbank stations (CB), ground penetrating radar tracklines (GPR), and mechanical trenches (MT). Dashed line denotes thicker sand deposits (≥2 m thickness). Below: Contrasting GPR profiles showing laminated overbank mud deposits in GPR25 (upper profile) and thick sand beds (2 - 4 m total thickness) in GPR31 (lower profile) above basal gravels (dashed white line).
tion features were widely developed at Site 7 in mechanical trench wall exposures in MT4, MT5, MT10 and MT11. The large-scale fluidization features (>10 cm width) included sand intrusion pockets, clastic sand dikes and clastic sand sills. Clastic dikes and sills, up to 15 cm in width, were intruded into overbank mud deposits from 3.4 m depth to 0.4 m depth, as recorded in continuous scans of deep mechanical trench walls in MT10 (Figure 12).
The trenches with the largest fluidization features (10 - 20 cm in MT5 and 20 - 30 cm width in MT11) were lengthened and widened [31] to permit entry for hand-held photography and measurements of clastic dike and sill widths, as well as, radiocarbon sampling to date the hosting deposits and associated fluidization features (Figure 13). Calibrated radiocarbon dates from MT5 at 1.85 m depth (510 - 620), MT8 at 3.20 m depth (510 - 550), and MT11 at 0.70 m depth (510 - 550) and 1.33 m depth (510 - 620) constrain the ages of basal sand deposits and the overlying overbank mud deposits to ~500 - 600 calyr BP at Site 7 (Table 3). Coseismic paleoliquefaction at Site 7 post-dates the intruded flood silts dated at ~500 yr BP.
The paleoliquefaction locality at Site 7 provided an opportunity to test the abundance and scale of fluidization features against underlying sand bed thickness for a discrete event in a single morphostratigraphic terrace setting (Figure 11). Table 4 includes the depth and thickness of overbank mud deposits, basal sand deposits, and maximum dike widths, as based on scaled and photographed cutbanks (n = 4 in number) and mechanical trench walls (n = 11 in number). Backhoe bucket scoops raised intact blocks of source bed sand from MT5, MT10 and MT11 (3 - 4 m depth), which showed unconfined compressive strengths of 1.0 - 1.5 kg∙cm−2.
5. Discussion
5.1. Variability in the Abundance and Scale of Fluidization Features
Relations between basal sand bed thickness and the abundance and scale of fluidization features that were intruded into overlying overbank mud deposits in the latest Holocene paleoliquefaction Site 7 (Table 4) are shown in Figure 14(A). The 15 cutbank and deep trench exposures in Site 7 demonstrated that the onset of large-scale paleoliquefaction occurred above sand beds of ≥2.0 m thickness, which were covered by silt overburden, 2 - 3 m in thickness. For this study the onset of large-scale paleoliquefaction is based on 1) common abundance of flui-
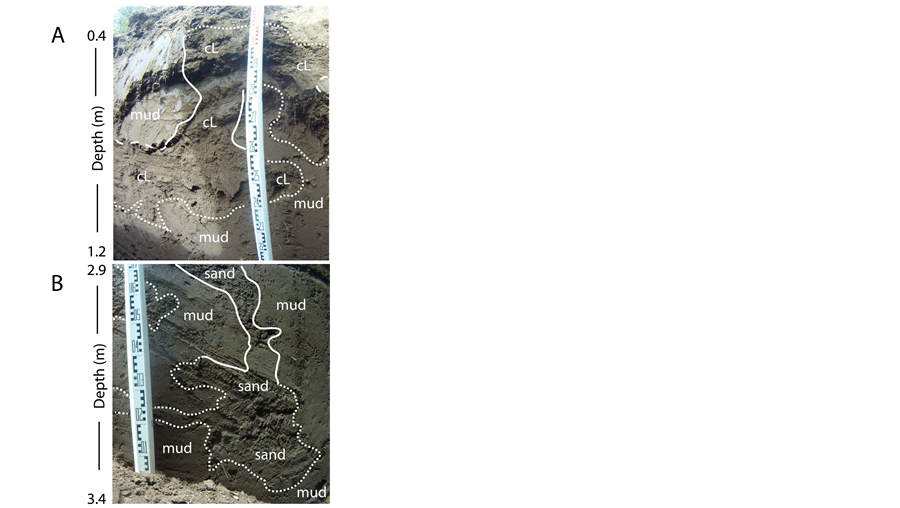
Figure 12. Part A. Trench wall (MT10) Go-Pro™ pole-camera photo (0.5 - 1.2 m depth subsurface) showing clastic sand sills (dotted lines), dikes (solid lines), and pocket intrusions hosted in overbank mud deposits, as exposed in the narrow trench (0.5 m width). Part B. Trench wall (MT10) Go-Pro™ pole-camera photo (2.9 - 3.4 m depth subsurface) showing clastic sand sills (dotted lines) and dikes (solid lines) hosted in overbank mud deposits. See Figure 11 for location of mechanical trench MT10 in latest Holocene paleoliquefaction Site 7.
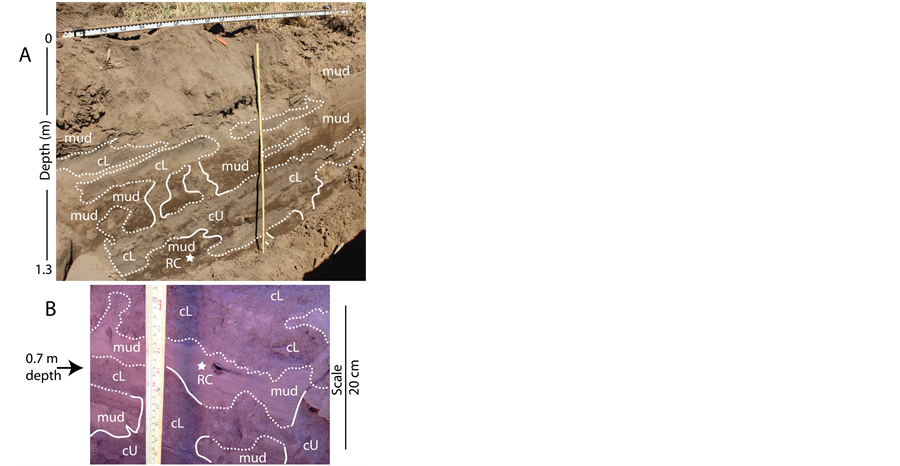
Figure 13. Part A. North wall of mechanical trench (MT11) showing clastic sills and dikes extending upwards to 0.5 m depth. Radiocarbon sample (RC) is taken at 1.3 m depth. Unconfined compressive strength of sand in dikes and sills was 0.5 - 1.0 kg∙cm−2. Part B. Close-up photo of MT11 south wall (shadowed low light) showing intruded dikes and sills. Radiocarbon sample (RC) is from 0.7 m depth. See Figure 11 for position of trench MT11 in latest Holocene paleoliquefaction Site 7.
Table 4 . Summary of cutbank and mechanical trench lithology and fluidization features in latest Holocene paleoliquefaction Site 7.
Notes: Mud and sand depths recorded in trench walls (0 - 4.0 m depth). Depth to gravel, when below trench bottom (4.0 m depth) estimated from GPR profiles. Fluidization feature abundance (cutbank of trench wall surface area) none (0%), rare (1% - 4%), common (5% - 25%), abundant (>25%). Maximum dike width measured with 1 cm scaled rule in trench wall. Data are from Minor and Peterson [39] .
dization features (5% - 25% surface area coverage in trench walls) and 2) clastic sand dike widths ≥10 cm. In one trench (MT11) the most abundant fluidization features and the widest clastic sand dikes (20 cm width) occurred directly above sand beds of 3 - 4 m thickness. The trench walls in MT11 showed a silt overburden thickness of 1.7 m. These values are comparable with similar deposit thicknesses reported for paleoliquefaction sites that resulted in ground damage from historic earthquakes [41] [42] .
The results from the latest Holocene paleoliquefaction Site 7 (Figure 14(A)) are consistent with informal observations of limiting sand bed thickness (≥2 m) of large-scale fluidization features (≥10 cm width) in late Pleistocene paleoliquefaction sites (Figure 3 and Figure 4). Whereas the full thickness of basal sand layers were exposed in some cutbank exposures of late Pleistocene paleoliquefaction sites, none of the late Holocene cutbank sites showing large-scale paleoliquefaction exposed the full thickness of the underlying sand beds. Exposures of sand beds ≤2 m thickness were fully exposed in some late Holocene cutbanks. They were not associated with large-scale fluidization features in overlying overbank mud deposits. Based on these results we conclude that further searches for late Holocene paleoliquefaction sites in the Willamette Valley should target thick basal sand beds (3 - 4 m thickness) that occur below overbank silt deposits of 2 - 3 m thickness in intact floodplain settings.
The maximum widths of clastic sand dikes are plotted against position (north-south) in the Willamette forearc valley for both late Pleistocene and late Holocene paleoliquefaction sites (Figure 14(B)). For the small number of large-scale paleoliquefaction sites (n = 13 in number) that were measured (Table 2) there do not appear to be any apparent trends of increasing dike or sill sizes relative to position(s) north or south in the Willamette Valley. There does not appear to be any grouping or clustering of observed paleoliquefaction sites within the study area. There are also no major differences between the maximum dike widths recorded in the Willamette Valley (Figure 14(B)) and those recorded in the latest Holocene paleoliquefaction sites on the coast or in the lower and middle reaches of the lower Columbia River (Table 1). However, the scarcity of fluidization features in the Willamette River cutbanks does not extend to the Columbia River, where abundant sand boils and feeder dikes were

Figure 14. Part A. Plot of abundance of liquefaction features, including intruded dike and sill surface areas (abundance) and maximum intruded dike width (cm) in overbank mud deposits relative to measured basal sand thickness (m) in latest Holocene Site 7. Data are from Table 4. Part B. Plots of maximum observed thickness of clastic dikes and clastic sills in late Pleistocene and late Holocene paleoliquefation sites relative to distance (north-south) along the Willamette forearc valley (Figure 2). Data are from Table 2.
traced along a cutbank exposure (600 m in length) at Site 1 (Figure 6). Numerous boreholes in the Columbia River floodplains demonstrate that thick sand sequences (>10 m thickness) occur below nearly all of the late Holocene cutbanks that showed evidence of large-scale paleoliquefaction (Figure 1) as well as at Site 1 (Figure 2) [27] [28] [43] .
5.2. Comparison of Paleoliquefaction in the Willamette Valley to Other Paleoseismic Settings
Relative to the high-gradient Willamette Valley the New Madrid seismic zone, USA, produced more abundant sand blows in Mississippi River localities, up to ~100 km distances from upperplate earthquake epicenters (Mb 7.0 - 7.4 in 1811 - 1812) [44] [45] . Larger and more abundant clastic dikes have been reported for several localities, at ~100 km distance from the Gulf of Alaska subduction zone earthquake epicenter (Mw 9.2 in 1964) [46] , relative to the Willamette Valley. Modest dike widths (10 - 30 cm) and vertical lengths (~1 m) in overbank mud deposits produced by historic Himalayan thrust earthquakes (M7 - 8) at epicentral distances of 50 - 100 km in the Shillong Plateau region of India [47] are similar to those observed in the overbank deposits in the Willamette Valley. Localized liquefaction above subsurface sand bodies in the Willamette Valley could yield localized damage to infrastructure, as recently reported from the Darfield earthquake (Mw 7.1) and the Christchurch earthquake (Mw 6.2) in Canterbury Province, New Zealand [48] .
The rare occurrences of fluidization features observed in the late Holocene cutbanks in the Willamette Valley relative to some other seismic regions could reflect 1) lower paleoseismic energies, 2) a lack of thick basal sand beds in the high-gradient river system, and/or 3) preferential cover of sandy accretionary bank deposits in the artificially-stabilized river cutbanks. Geotechnical testing of identified latest Holocene paleoliquefaction localities, such as at Sites 1, 2, 5, 7 and 9 (Figure 2) is needed to establish the thresholds of ground-motion accelerations that induced the paleoliquefaction in susceptible deposits in the Willamette forearc valley [49] . The correspondence between apparent paleoliquefaction sites and rare thick sand bodies in the Willamette Valley shows that coseismic liquefaction hazard mapping should be based on subsurface mapping of thick sand bodies above Pleistocene basal gravels. Future strong shaking might be widespread in the forearc valley but coseismic liquefaction should be highly localized above thick unconsolidated sand bodies.
5.3. Cutbank versus Subsurface Exploration for Paleoliquefaction Evidence
An important finding of this study is the success and efficiency of subsurface exploration for latest Holocene paleoliquefaction in the Willamette forearc valley. Thick sand deposits (>3 m thickness), above which evidence of large-scale fluidization might be found, are rarely exposed in cutbanks in the Willamette River (total search distance 150 river kilometers). In addition to the general lack of thick sand bed deposition in the high-gradient Willamette River system two historic factors contributed to the rarity of cutbank exposures of late Holocene sandy accretionary banks. These artificial factors include 1) extensive shortening or straightening of the historic Willamette River course and 2) selective bank protection or bank-fill in the least-resistant (sandy) riverbank sections [50] . Channel lengths have been shortened by 53% in the upper Willamette River and by 45% in the middle Willamette River [51] . Stone revetments extend along 24% of the upper Willamette River and 18% of the middle Willamette River [51] . Our informal observations (2010-2011) indicated a combined stone revetment and/or artificial fill cover of >50% of total bank length for the surveyed Willamette River reaches.
To overcome the bias of covered unconsolidated sandy riverbanks, subsurface investigations were conducted to search for evidence of paleoliquefaction in flood plain settings that were not excavated or covered by historic cutbank modifications (Figure 11). The subsurface approach led to immediate success and provided details about sand source bed thickness (Table 4) that were not available in the cutbank surveys. Subsurface investigations targeted 1) likely late Holocene settings through satellite and DEM topographic analyses, 2) thick subsurface sand bodies (≥3 m thickness) by GPR geophysical surveys and 3) relatively thin overlying mud deposits (≤3 m thickness) for evidence of vertically intruded clastic dikes and sills in deep mechanical trenches. Perhaps the most important outcome of the subsurface investigation is the utility of using the accessible floodplain sites, such as Site 7 (Figure 2) for subsequent drill-rig standard penetration tests (STP), cone penetrometer tests (CPT), downhole sampling for cyclic-shear stress testing, and probabilistic back-analysis for earthquake magnitude estimation [41] [52] -[54] .
5.4. Potential Sources of Late Holocene Paleoliquefaction in the Willamette Valley
Paleoseismic events represented in the Willamette forearc valley could have originated from seismic sources in the upperplate, the descending lowerplate, and/or the interpolate megathust, as have been documented in western Washington (Figure 1) [15] [16] [22] . The observed distribution of large-scale paleoliquefaction sites and associated sizes of fluidization features in the Willamette Valley (Figure 2) does not permit discrimination between these potential seismic sources (Figure 14(B)).
The ages of late Holocene paleoliquefaction in the Willamette Valley are constrained by radiocarbon dating of youngest hosting deposits at four paleoliquefaction sites including sites in the Columbia River, Site G (Figure 1) and Site 1 (Figure 2), and in the Willamette River, Sites 5 and 7 (Figure 2). Intruded fluidization features predate overlying radiocarbon dated layers at Site G and Site 1 in the Columbia River, respectively, thereby constraining two paleosismic events to radiocarbon ages of 308 - 537 and 2180 - 2305 (Table 3). Two major ruptures of the central Cascadia megathrust occurred at 0.3 ka and ~2.6 ka [6] , which could correspond to the paleoliquefaction events at Site G and Site 1 in the Portland Basin of the Columbia River. A much older paleoliquefaction event occurred at Site 5 in the middle Willamette Valley, which is radiocarbon dated to 4150 - 4405 (Figure 9; Table 3). The radiocarbon-dated ranges of paleoliquefaction events in the Willamette forearc valley nearly extend the full length of late Holocene time (0 - 5 ka).
The youngest late Holocene paleoliquefaction event dated in the Willamette Valley at Site 7 post-dates the age of the hosting deposits (~500 yr BP) but predates the historic record of seismicity in western Oregon. Specifically, no large earthquakes were reported in northwest Oregon during the last 175 years [17] . The age range of the paleoseismic event(s) that produced the large-scale paleoliquefaction at Site G and Site 7, separated by 150 m distance (Figure 1 and Figure 2), is circa AD 1500 - 1840. This paleoliquefaction age range overlaps the age of the last Cascadia megathrust rupture (estimated Mw 8.5 - 9.0) at AD 1700 [21] . Several older megathrust ruptures, at ~1.1, ~1.3, ~1.7 ka, are dated by coseismically-subsided tidal marshes and associated paleotsunamis in the central Cascadia margin [4] [6] (Figure 1). Appropriate paleoliquefaction sites with suitable age ranges (1.0 - 1.5 ka) in the Willamette Valley floodplains might have recorded the 1.1 - 1.7 ka cluster of megathrust ruptures. Terrace sequence dating in the Willamette Valley floodplains will be required to target such time-restricted accretionary bank sand beds and associated overbank mud hosting deposits.
Regardless of the potential coseismic sources in northwestern Oregon the widespread presence of large-scale fluidization features in late Holocene deposits of the Willamette River (Figure 14(B)) demonstrates the potential for seismic hazard in the Willamette forearc valley. These results differ from previous studies [1] [2] that did not find large-scale paleoliquefaction evidence in latest Holocene deposits in the Willamette Valley.
6. Conclusion
Large-scale fluidization features including clastic sand dikes and intruded sand sills are present in late Holocene flood plain deposits in the Willamette Valley in northwestern Oregon. At least two latest Holocene paleoliquefaction sites, separated by 150 km distance, overlap in age (circa AD 1500 - 1840) with the last great earthquake (Mw 8.5 - 9.0) in the Cascadia subduction zone at AD 1700. The rarity of thick sand beds (>3 m thickness) in the high-gradient gravel-dominated Willamette River, together with artificial cover of the erosion-prone sandy accretionary banks, has resulted in very rare cutbank exposures of late Holocene paleoliquefaction sites. Subsurface explorations for paleoliquefaction evidence successfully utilized floodplain geomorphic analyses, ground penetrating radar surveys, and deep mechanical trenching to find and document subsurface evidence of latest Holocene paleoliquefaction. The subsurface paleoliquefaction sites are readily accessible to geotechnical testing for paleoliquefaction susceptibility and estimation of paleoseismic ground accelerations in the Willamette forearc valley in the central Cascadia margin.
Acknowledgements
Subsurface investigations and radiocarbon dating at Site 7 were carried out during a geoarchaeological survey, for a proposed wastewater reclamation plant by Heritage Research Associates under contract to Kennedy/Jenks Consultants for the City of Corvallis, Oregon. Galen Peterson assisted with ground penetrating radar (GPR) surveys and performed the trench wall scans with the remote pole-camera system. Ron Bush performed the GPS surveys for the GPR profile endpoints and for the mechanical trenches using available LiDAR for spot elevation control. John Olson performed the deep trench excavations and assisted with digital pole-cameral scans of trench walls. Vanessa Van Der Borg assisted with trench wall paleoliquefaction sketches and sampling for radiocarbon analysis.
References
- Thurber, B.W.C. and Obermeier, S.F. (1996) Paleoliquefaction Evidence for Two Late Quaternary Earthquakes, Southern Willamette Valley, Oregon. Geological Society of America, Abstracts with Program, 28, 117.
- Sims, J.D. (2002) Paleoliquefaction Study of the Willamette River Valley, Portland to Covallis, Oregon. US Geological Survey, Reston, Element II under Contract 02HQGR0021.
- Geomatrix (1995) Seismic Design Mapping State of Oregon. Oregon Department of Transportation, Salem.
- Darienzo, M.E. and Peterson, C.D. (1995) Magnitude and Frequency of Subduction-Zone Earthquakes along the Northern Oregon Coast in the Past 3000 Years. Oregon Geology, 57, 3-12.
- Adams, J. (1996) Great Earthquakes Recorded by Turbidites off the Oregon-Washington Coast. In: Rogers, M., Walsh, T.J., Kockelman, W.J. and Priest, G.R., Eds., USGS Professional Paper 1560 Assessing and Reducing Earthquake Hazards in the Pacific Northwest, 1, 147-160.
- Atwater, B.F., Tuttle, M.P., Schweig, E.S., Rubin, C.M., Yamaguchi, D.K. and Hemphill-Haley, E. (2004) Earthquake Recurrence, Inferred from Paleoseismology. In: Gillespie, A.R., Porter, S.C. and Atwater, B.F., Eds., The Quaternary Period in the United States, Elsevier, Amsterdam, 331-350.
- Peterson, C.D., Cruikshank, K.M., Darienzo, M.E., Wessen, G., Butler, V. and Sterling, S. (2013) Coseismic Subsidence and PaleotsunamiRunup Records from Latest Holocene Deposits in the Waatch Valley, Neah Bay, Northwest Washington, USA: Links to Great Earthquakes in the Northern Cascadia Margin. Journal of Coastal Research, 29, 157-172. http://dx.doi.org/10.2112/JCOASTRES-D-12-00031.1
- Fiedorowicz, B.K. (1997) Geologic Evidence of Historic and Preshistoric Tsunami Inundation at Seaside, Oregon. M.S. Thesis, Portland State University, Portland.
- Peterson, C.D., Cruikshank, K.M., Jol, H.M. and Schilichting, R.B. (2008) Minimum Runup Heights of Paleotsunami from Evidence of Sand Ridge Overtopping at Cannon Beach, Oregon, Central Cascadia Margin, USA. Journal of Sedimentary Research, 78, 390-409. http://dx.doi.org/10.2110/jsr.2008.044
- Peterson, C.D., Jol, H.M. and Alldritt, K. (2005) Reconnaissance Subsurface Investigation of Bandon Marsh, Oregon. U.S. Fish and Wildlife Service, Newport.
- Obermeier, S.F., Atwater, B.F., Benson, B.E., Peterson, C.D., Moses L.J., Pringle, P.T. and Palmer, S.P. (1993) Liquefaction about 300 Years Ago Along Tidal Marshes of the Columbia River, Oregon and Washington. Transactions of American Geophysical Union EOS, 74, 198.
- Atwater, B.F. (1994) Geology of Holocene Liquefaction Features along the Lower Columbia River at Marsh, Brush, Price, Hunting, and Wallace Islands Oregon and Washington. U.S. Geological Survey Open-File Report 94-209, Seattle, Washington.
- Peterson C.D. and Madin, I.P. (1997) Coseismicpaleoliquefaction Evidence in the Central Cascadia Margin, USA. Oregon Geology, 59, 51-74.
- Goldfinger, C., Kulm, L.D., Yeates, R.S., Appelgate, B., MacKay, M.E. and Moore, G.F. (1992) Transverse Structural Trends along the Oregon Convergent Margin: Implications for Cascadia Earthquake Potential and Crustal Rotations. Geology, 20, 141-144. http://dx.doi.org/10.1130/0091-7613(1992)020<0141:TSTATO>2.3.CO;2
- Palmer, S. P. (1990) Geotechnical Analysis of Liquefaction in Puyallup during the 1949 and 1965 Puget Sound Earthquakes. Washington Geologic Newsletter, 18, 3-7.
- Wang, Y., Hoffmeister, R.J., Graham, G., Clark, L., Beck, N., Peltz, T., Darienzo, M., Elliot, W. and Hasenberg, C. (2001) The Nisqually, Washington Earthquake of February 28, 2001—Summary Report. Oregon Department of Geology and Mineral Industries Open-File Report O-01-2, Portland.
- Berg Jr., J.W. and Baker, C.D. (1963) Oregon Earthquakes 1841-1958. Bulletin of the Seismological Society of America, 53, 95-108.
- Yelin, T.S. and Patton, H.J. (1991) Seismotectonics of the Portland, Oregon, Region. Bulletin of the Seismological Society of America, 81, 109-130.
- Atwater, B.F. (1987) Evidence for Great Earthquakes along the Outer Coast of Washington State. Science, 236, 942- 944. http://dx.doi.org/10.1126/science.236.4804.942
- Darienzo, M.E. (1991) Late Holocene Paleoseismicity along the northern Oregon coast. Ph.D. Thesis, Portland State University, Portland.
- Satake, K., Shimazaki, K., Tsuji, Y. and Ueda, K. (1996) Time and Size of Giant Earthquake in Cascadia Inferred from Japanese Tsunami Records of January 1700. Nature, 378, 246-249. http://dx.doi.org/10.1038/379246a0
- Atwater, B.F. (1992) Geologic Evidence for Earthquakes during the Past 2000 Years along the Copalis River, Southern Coastal Washington. Journal of Geophysical Research, 97, 1901-1919. http://dx.doi.org/10.1029/91JB02346
- Peterson, B., Peterson, C.D., Volker, K., Wyatt, J., Marsh, M., Rose, G. and Horning, T. (1994) Vibracore Subsurface Investigation of Late Holocene Liquefaction Site in the Central Cascadia Margin: Columbia River, Washington. US Geological Survey, Portland.
- Obermeier, S.F. and Dickenson, S.E. (1997) Liquefaction Evidence for the Strength of Ground Motions from a Casadia Subduction Earthquake about 300 Years Ago. In: Wang, Y. and Neuendorf, K.E., Eds., Earthquakes-Converging at Cascadia, Symposium Proceedings, Association of Engineering Geologists, Special Publication 10. State of Oregon Department of Geology and Mineral Industries, Special Paper 28, Portland.
- Dickinson, S.E. and Obermeier, S.F. (1998) Ground Motions Estimates for a Cascadia Earthquake from Liquefaction Evidence: American Society of Civil Engineers. Geotechnical Special Publication No. 75, 79-90.
- Takada, K. and Atwater, B.F. (2004) Evidence for Liquefaction Identified in Peeled Slices of Holocene Deposits along the Lower Columbia River, Washington. Bulletin of the Seismologial Society of America, 94, 550-575. http://dx.doi.org/10.1785/0120020152
- Peterson, C.D., Roberts, M.C., Vanderburg, S., Minor, R. and Percy, D. (2014) Late Holocene Chronology and Geomorphic Development of Fluvial-Tidal Floodplains in the Upper Reaches of the Lower Columbia River Valley, Washington and Oregon, USA. Geomorphology, 204, 123-135. http://dx.doi.org/10.1016/j.geomorph.2013.07.033
- Peterson, C.D., Vanderburgh, S. and Roberts, M.C. (2014) Late Holocene Geomorphology of the Columbia River Estuary, Oregon and Washington, USA. Journal of Geography and Geology, 6, 1-27. http://dx.doi.org/10.5539/jgg.v6n2p1
- USGS (2010) US, Geological Survey Seamless Data Warehouse. http://seamless.usgs.gov/
- Birkeland, P.W. (1999) Soils and Geomorphology. Oxford University Press, New York.
- OSHA (2014) Excavations: Hazard Recognition in Trenching and Shoring. OSHA Technical Manual (OTM) Section V: Chapter 2. https://www.osha.gov/dts/osta/otm/otm_v/otm_v_2.html
- Beta Analytic Inc. (2014) Beta Analytic Radiocarbon Dating. http://www.radiocarbon.com/carbon-dating.htm
- Roberts, M.C. and Whitehead, D.R. (1984) The Palynology of a Nonmarine Neogene Deposit in the Willamette Valley, Oregon. Review of Palaeobotany and Palynology, 41, 1-12. http://dx.doi.org/10.1016/0034-6667(84)90039-3
- Parsons, R.B. (1979) Stratigraphy and Land Use of the Post-Diamond Hill Paleosol, Western Oregon. Geoderma, 22, 67-70. http://dx.doi.org/ 10.1016/0016-7061(79)90041-7
- Balster, C.A. and Parsons, R.B. (1969) Late Pleistocene Stratigraphy, Southern Willamette Valley, Oregon. Northwest Science, 43, 116-129.
- Bretz, J.H. (1923) The Channeled Scablands of the Columbia Plateau. Journal of Geology, 31, 617-649. http://dx.doi.org/10.1086/623053
- Allison, I.S. (1935) Glacial Erratics in the Willamette Valley. Geological Society of America Bulletin, 46, 605-632.
- Peterson, C.D., Minor, R., Peterson, G.L. and Gates, E.B. (2011) Preand Post-Missoula Flood Geomorphology of the Pre-Holocene Ancestral Columbia River Valley in the Portland Forearc Basin, Oregon and Washington, USA. Geomorphology, 129, 276-293. http://dx.doi.org/10.1016/j.geomorph.2011.02.022
- Minor, R. and Peterson, C.D. (2012) Geoarchaeological Survey for the City of Corvallis Wastewater Reclamation Plant East Alternative, Linn County, Oregon. Heritage Research Associates Report No. 366, Eugene.
- Bristow, C.S. and Jol, H.M. (2003) Ground Penetrating Radar in Sediments. The Geological Society, London, Geological Society Special Publication No. 21. http://dx.doi.org/10.1144/GSL.SP.2001.211.01.01
- NRC (1985) Liquefaction of Soils during Earthquakes. National Research Council, Report PB86-163110. National Academy Press, Washington DC.
- Olson, S.M., Green, R.A. and Obermeier, S.F. (2005) Geotechnical Analysis of Paleoseismic Shaking Using Liquefaction Features: A Major Updating. Engineering Geology, 76, 235-261. http://dx.doi.org/10.1016/j.enggeo.2004.07.008
- Peterson, C.D., Gates, E.B., Minor, R. and Baker, D.L. (2013) Accommodation Space Controls on the Latest Pleistocene and Holocene (16-0 ka) Sediment Size and Bypassing in the Lower Columbia River Valley: A Large FluvialTidal Systems in Oregon and Washington, USA. Journal of Coastal Research, 29, 1191-1211. http://dx.doi.org/10.2112/JCOASTRES-D-12-00172.1
- Saucier, R.T. (1989) Evidence for Episodic Sand-Blow Activity during the 1811-1812 New Madrid (Missouri) Earthquake Series. Geology, 17, 103-106. http://dx.doi.org/10.1130/0091-7613(1989)017<0103:EFESBA>2.3.CO;2
- Obermeier, S.F. (1996) Use of Liquefaction-Induced Features for Paleoseismic Analysis. Engineering Geology, 44, 1-76. http://dx.doi.org/10.1016/S0013-7952(96)00040-3
- Walsh, T.J., Combellick, R.A. and Black, G.L. (1995) Liquefaction Features from a Subuduction Zone Earthquake: Preserved Examples from the 1964 Alaska Earthquake. Report of Investigations 32. Olympia, Washington Division of Geology and Earth Resources, Washington.
- Sukhija, B.S., Rao, M.N., Reddy, D.V., Nagabhushanam, P., Hussain, S.R., Chadha, K. and Gupta, H.K. (1999) Paleoliquefaction Evidence and Periodicity of Large Prehistoric Earthquakes in Shillong Plateau, India. Earth and Planetary Science Letters, 167, 269-282. http://dx.doi.org/10.1016/S0012-821X(99)00015-1
- Aydan, Ö., Ulusay, R., Hamada, M. and Beetham, D. (2012) Geotechnical Aspects of the 2010 Darfield and 2011 Christchurch Earthquakes, New Zealand, and Geotechnical Damage to Structures and Lifelines. Bulletin of Engineering Geology and the Environment, 71, 637-662. http://dx.doi.org/10.1007/s10064-012-0435-6
- Frankel, A.D., Petersen, M.D., Mueller, C.S., Haller, K.M., Wheeler, R.L., Leyendecker, E.V., Wesson, R.L., Harmsen, S.C., Cramer, C.H., Perkins, D.M. and Rukstales, K. (2002) Documentation for the 2002 Update of the National Seismic Hazard Maps. US Geological Survey Open-File Report 02-420, US Department of the Interior, Reston.
- Benner, P.A. and Sedell, J.R. (1997) Upper Willamette River Landscape: A Historic Perspective. In: Laenen, A. and Dunnette, D.A., Eds., River Quality: Dynamics and Restoration, Lewis Publishers/CRC Press, Boca Raton and New York, 23-47.
- Benner, P. (1993) Willamette River Landscape History. Fieldtrip Handout, 1 May 1993, Oregon State University, Corvallis.
- Seed, H.B. and Idriss, I.M. (1982) Ground Motions and Soil Liquefaction during Earthquakes. Earthquake Engineering Research Institute Monograph, Oakland.
- Lew, M. (2001) Liquefaction Evaluation Guidelines for Practicing Engineering and Geotechnical Professionals and Regulators. Environmental and Engineering Geoscience, 7, 301-320.
- Rodrigue-Marek, A. and Daniel, C. (2008) Probabilistic Methodology for the Analysis of Paleoliquefaction Features. Engineering Geology, 96, 159-172. http://dx.doi.org/10.1016/j.enggeo.2007.10.007