Open Journal of Earthquake Research
Vol.3 No.1(2014), Article ID:43315,8 pages DOI:10.4236/ojer.2014.31004
Variation of Altitude Observed on the Occasion of the Tohoku Earthquake (M = 9.0) Occurred on March 11, 2011
1School of Engineering, University of Basilicata, Potenza, Italy
2Department of Physics, University of Bari, Bari, Italy
Email: pietro.milillo@unibas.it
Copyright © 2014 Pietro Milillo et al. This is an open access article distributed under the Creative Commons Attribution License, which permits unrestricted use, distribution, and reproduction in any medium, provided the original work is properly cited. In accordance of the Creative Commons Attribution License all Copyrights © 2014 are reserved for SCIRP and the owner of the intellectual property Pietro Milillo et al. All Copyright © 2014 are guarded by law and by SCIRP as a guardian.
Received December 15, 2013; revised January 12, 2014; accepted February 7, 2014
KEYWORDS
Earthquake; GPS; Time Series
ABSTRACT
Since October 1, 2010, a GPS receiver is put into operation at Tokai (Japan) in an experiment on Neutrino Physics (T2K). A significant variation of the altitude was detected from the beginning of March 2011, so that it has made worthwhile to investigate the possibility that such variations could be correlated to the Tohoku earthquake. In order to investigate in details this possibility, we analyzed the GPS data collected during 2011 by GEONet the GPS Earth Observation Network (GEONET). GEONET is the GPS network of Japan and consists of 1240 permanent stations. Preliminary results of the analysis seemed to show ten days before the earthquake, some possible anomalous behaviors of the stations. These anomalous behaviors were particularly relevant for stations of the network near the epicentral area. While co-seismic and post-seismic variations are widely expected, the anomalies recorded about ten days before the earthquake could be seriously considered among short-term precursors of the earthquake. In order to confirm this possibility, more detailed studies have been performed. In particular, GEONET currently makes available only daily solutions of the stations coordinates. On the contrary, it is very important to improve the time resolution just to understand the features of the anomalies till the last hours before the Earthquake. For this reason, we have performed an analysis to evaluate the coordinates and movement on hourly basis so improving the time resolution.
1. Introduction
A wide variety of natural phenomena are detrimental for the natural environment and for the anthropic structures and the human being. Earthquakes are among the most hazardous natural phenomena and, in order to mitigate their effects, the singling out of their precursors is a task of primary importance. Generally speaking, the earthquake precursors can be classified into three categories, depending on the time scale we are concerned with: “long-term” (of the order of a few hundred years), “medium-term” (of the order of hundreds to a few years) and “short-term” (of the order of a few months to a few days). We will focus on the short-term precursors.
A seismic precursor is an “anomalous” variation in some physical-chemical parameters that occurs before the seismic event and that is clearly linked to it. The most recent results show that seismic precursors can be divided into two different categories: ground precursors [1-4], and atmospheric precursors [5]. The first refer to anomalies in physical-chemical parameters of the ground such as resistivity, gas content and ionic content of deep waters, earth magnetic field, ground deformation etc.; the second refer to anomalies in physical-chemical parameters of the atmosphere, such as temperature, gas composition, density etc. Generally, the ground precursors are highlighted by means of on-ground measurements while atmospheric precursors are revealed by satellites [5,6].
In this paper, we present the possibility of investigating one of the main ground precursors, i.e. the crustal deformation. In particular, we study the height variation of the ground observed on the occasion of the Tohoku Earthquake (M = 9.0) occurred on March 11, 2011. The heights are evaluated by means of GPS technique and in this sense such ground precursors are monitored by means of satellite techniques. The height data refer to different geographical areas of Japan and the data analysis as revealed possible preseismic, coseismic and postseismic effects in the crustal altitude.
2. Data Description
We used data of GPS Earth Observation Network (GEONET), a dense GPS receiver network composed by about one thousand GPS observation sites with 25 - 30 km average distance between stations. This network, operated by Geospatial Information Authority of Japan (GSI), has been used for crustal-deformation monitoring and geodetic control.
Each site is equipped with a GPS receiver, the communication device and a backup battery, which is stored in a stainless steel pillar. A pillar is five meters high, standing on a concrete cubic basement two meters large. The receivers are tuned to sample dual band carrier phase data and code data every 30 seconds. All the collected data are archived into a database in RINEX (Receiver Independent Exchange) format. GPS data network solution process starts soon after data downloading of the stations is complete (max latency of 15’). The processing generally provides Quick, Rapid and Final solutions according to different analysis strategies [7]. Quick analysis is routinely executed every three hours with 6-hour observation data and it used especially for monitoring crustal movement. Rapid analysis is performed every day with 24-hour data and it is used for screening in case of emergencies. Final analysis is executed two weeks after observation and it is the most accurate analysis in GEONET. Quick and Rapid analysis use the IGS Ultra Rapid Orbits; while the final analysis is executed with IGS precise orbits [8]. In this work we used precise solutions and RINEX observation files. As first step we have processed the data to achieve daily solutions of the coordinates for a period of four months centered around the epoch of occurrence of the Earthquake (11th March 2011) obtaining a daily preliminary analysis. This kind of products have been used for a daily preliminary analysis in order to emphasize general behavior in occasion of the 11 March 2011 M = 9.0 Tohoku Earthquake. RINEX observation files have been used applying the sliding window technique hourly analysis in order to bring out more accurate trends 15 days before and after the Earthquake. The daily network processing of the GEONET network is conducted by GSI, with Bernese GPS processing software, also RINEX observation files used for hourly analysis have been analyzed with BERNESE software [9,10].
3. Data Analysis
After the preliminary step in which we have analyzed the daily solution provided by GEONET, we have, as second step, unwrapped the data to perform their reprocessing in order to achieve hourly solutions and, therefore, improve the time resolution in order to understand if abrupt events or discontinuities have been occurred during the investigated period .
Starting from January 1st, 2011, the daily data related to the altitude of all GPS station have been examined 2 months before and after 11th March 2011 identifying different behaviors in GPS Network heights.
An example of daily data plot, related to one GEONET GPS station, is shown in Figure 1.
Hourly solutions have been analyzed with Bernese Software in order to confirm trend and improve standard deviation error. The hourly analysis has been performed an a sub-network that consists of 12 fiducial stations (see Table 1) not very far from the Tsukuba station (TSKB IGS) which acts as a reference station; so we have a total number of 13 stations. Sliding window parameters are: 12 hours window with 3 hours sliding time.
All Processing steps have been performed using the Bernese Processing Engine (BPE) [10,11]. Both Precise Point Positioning (PPP) and Double-Difference Processing (RNX2SNX) blocks have been used for this analysis. Bernese Input Parameters are shown in Table 2.
PPP is a special case of zero-difference processing, in this particular case it can be considered a preparatory step to double-differencing processing. PPP relies on precise orbit and clock information for deriving precise site coordinates and a receiver clock correction independently for each analyzed station and is based on undifferenced code and/or phase observations.
PPP is a fast and efficient way to produce station coordinates but it should be underlined that it is not
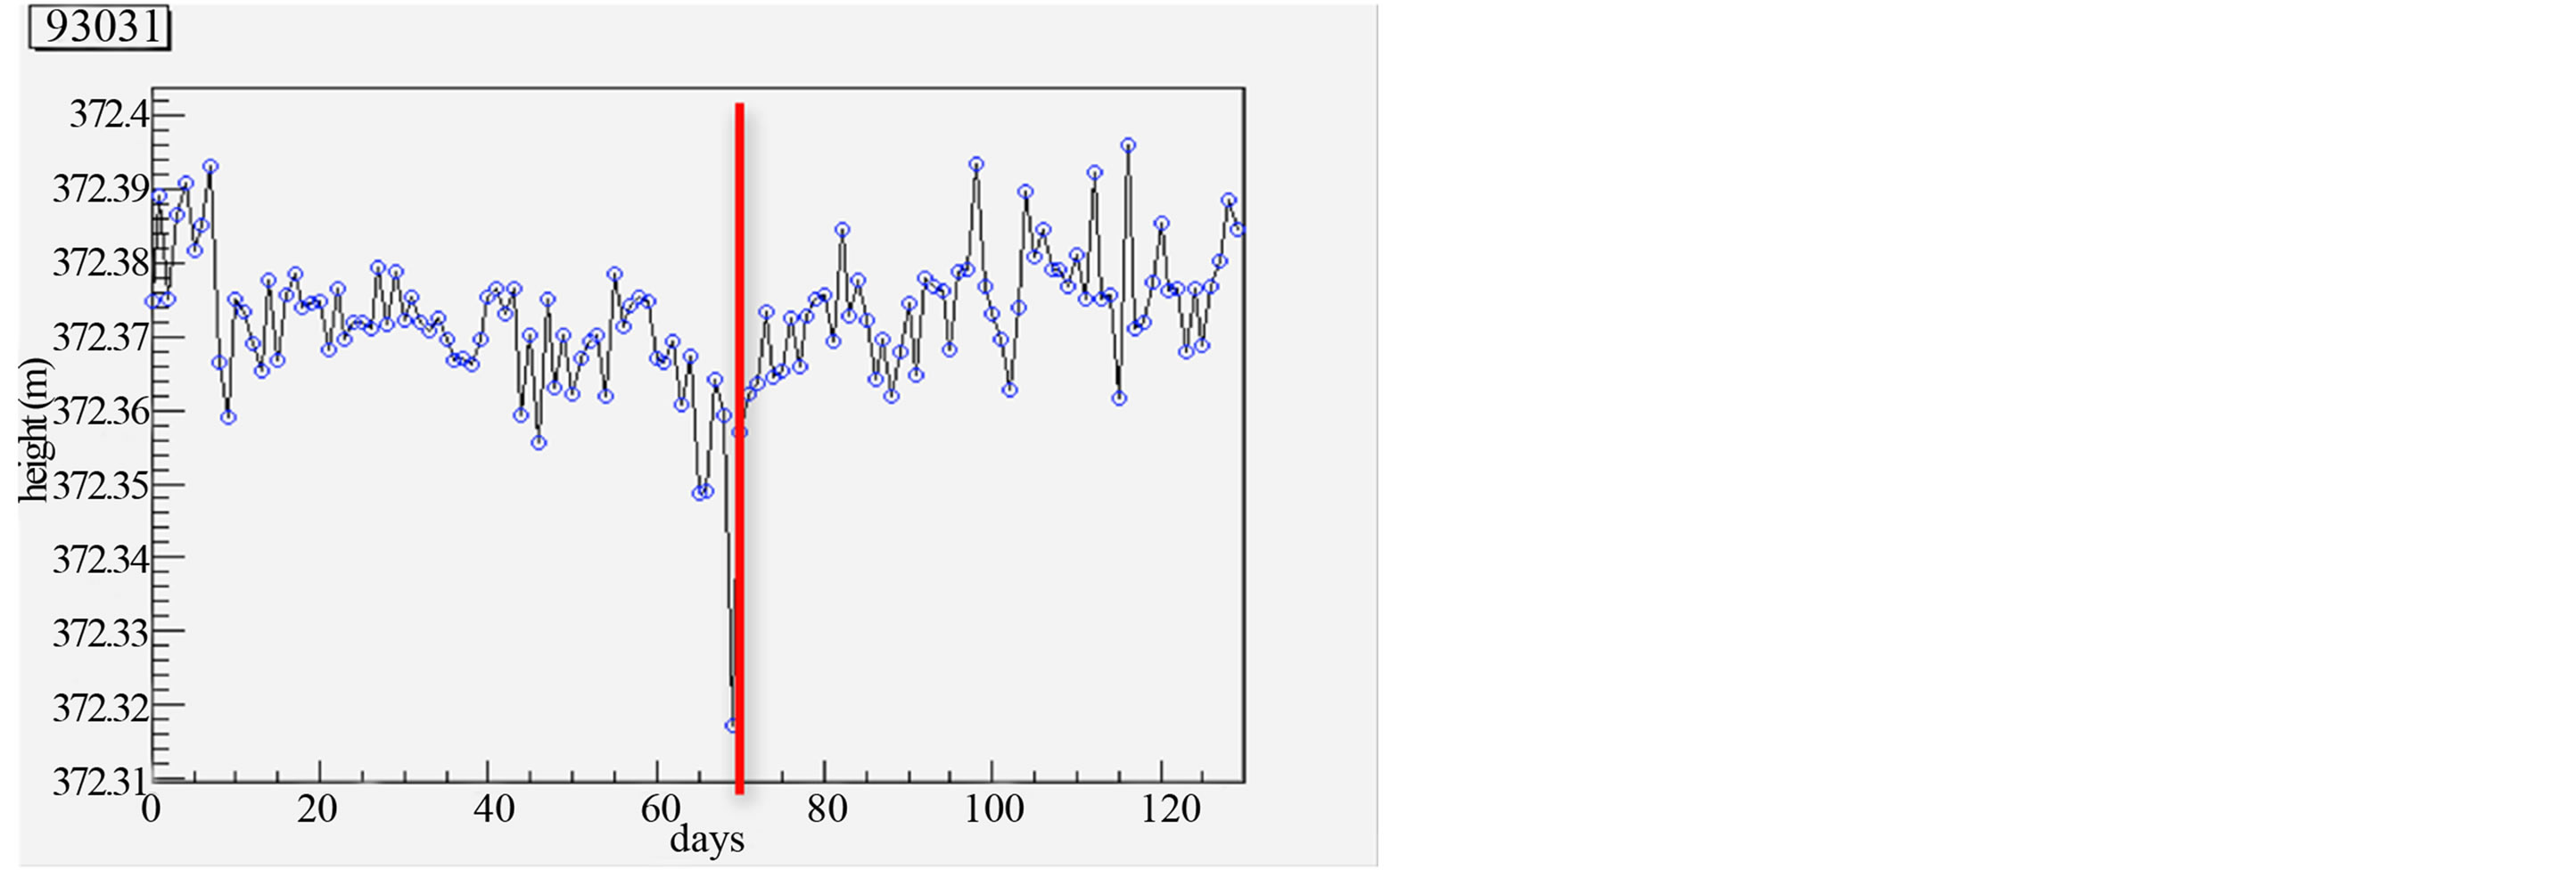
Figure 1. GPS-GSI daily data related to pre-seismic effect (Start day 1 January 2011).
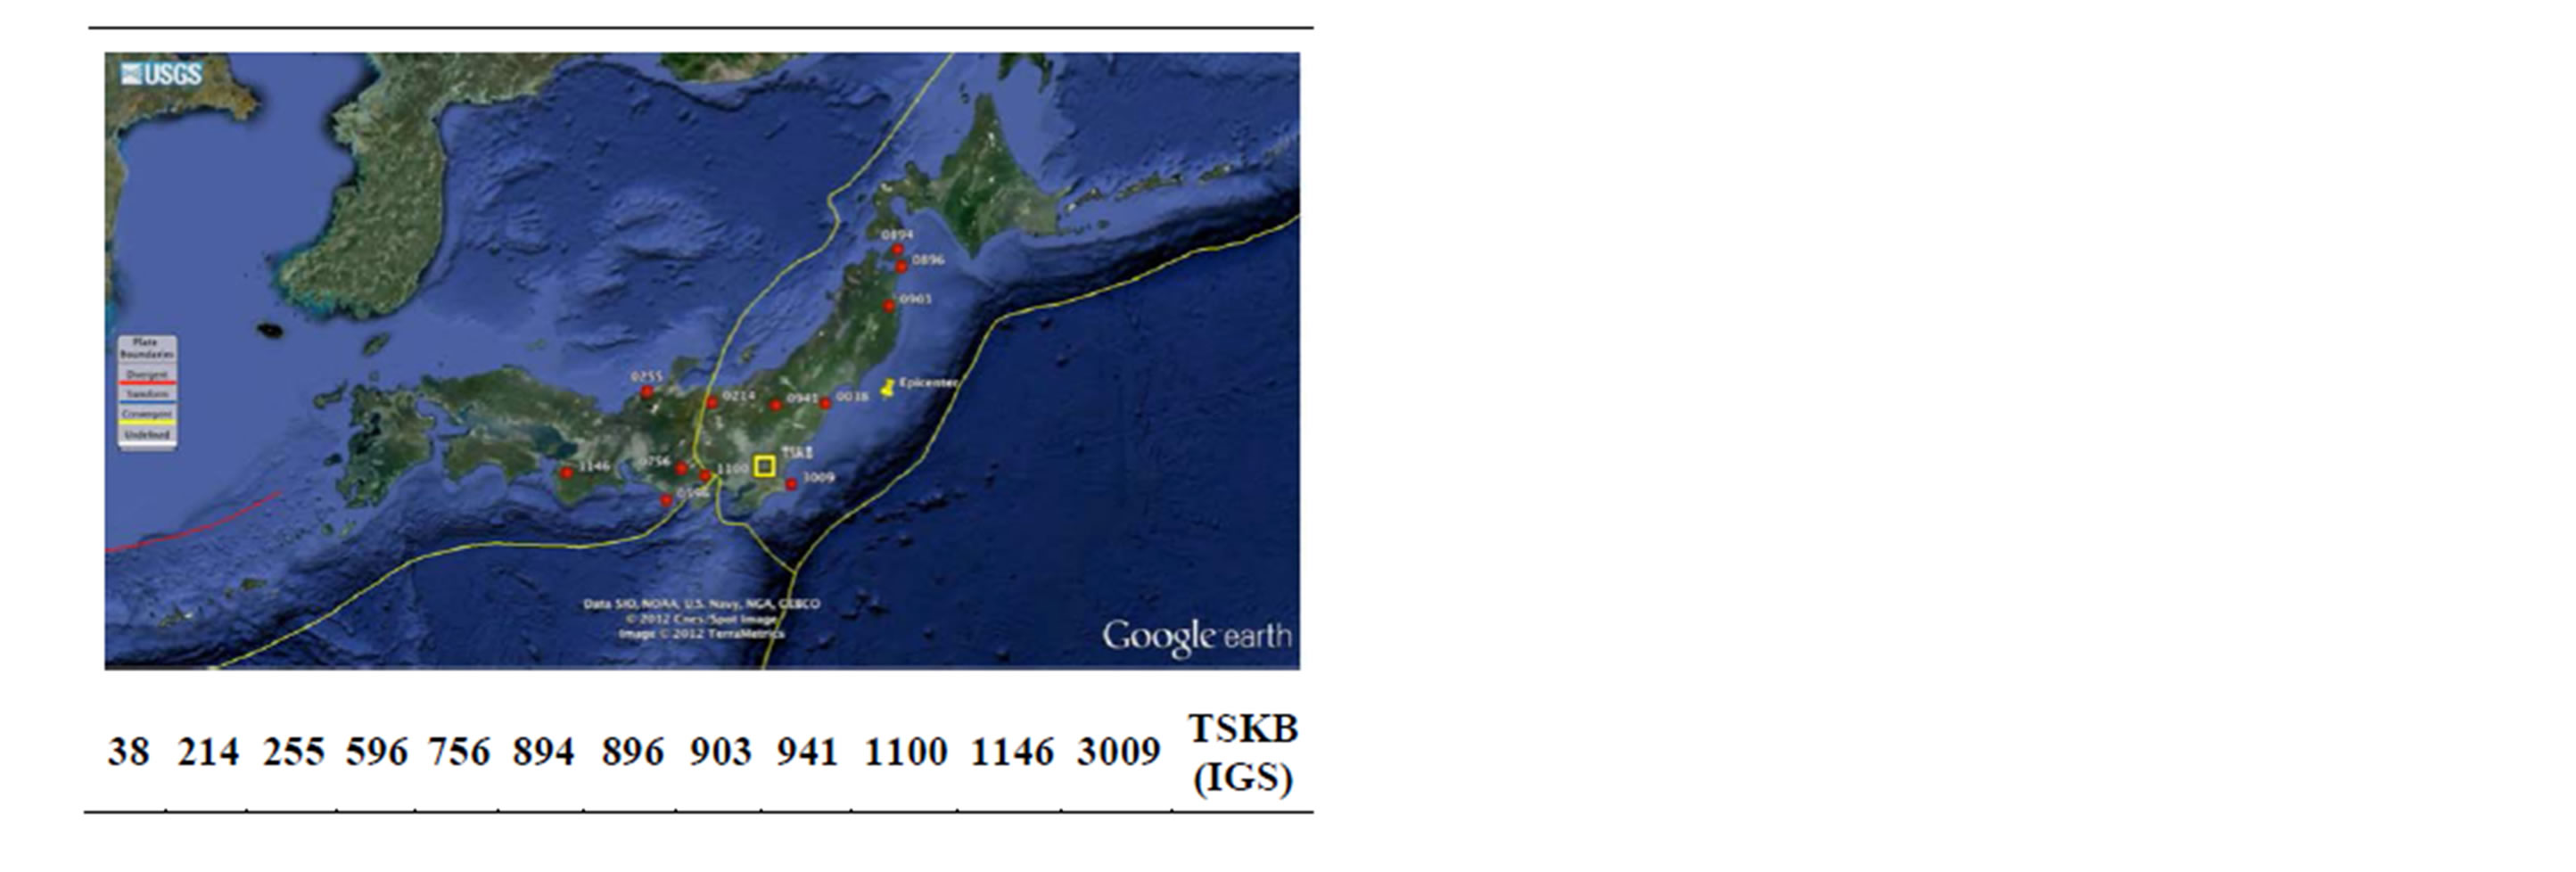
Table 1. GPS network used for hourly analysis.
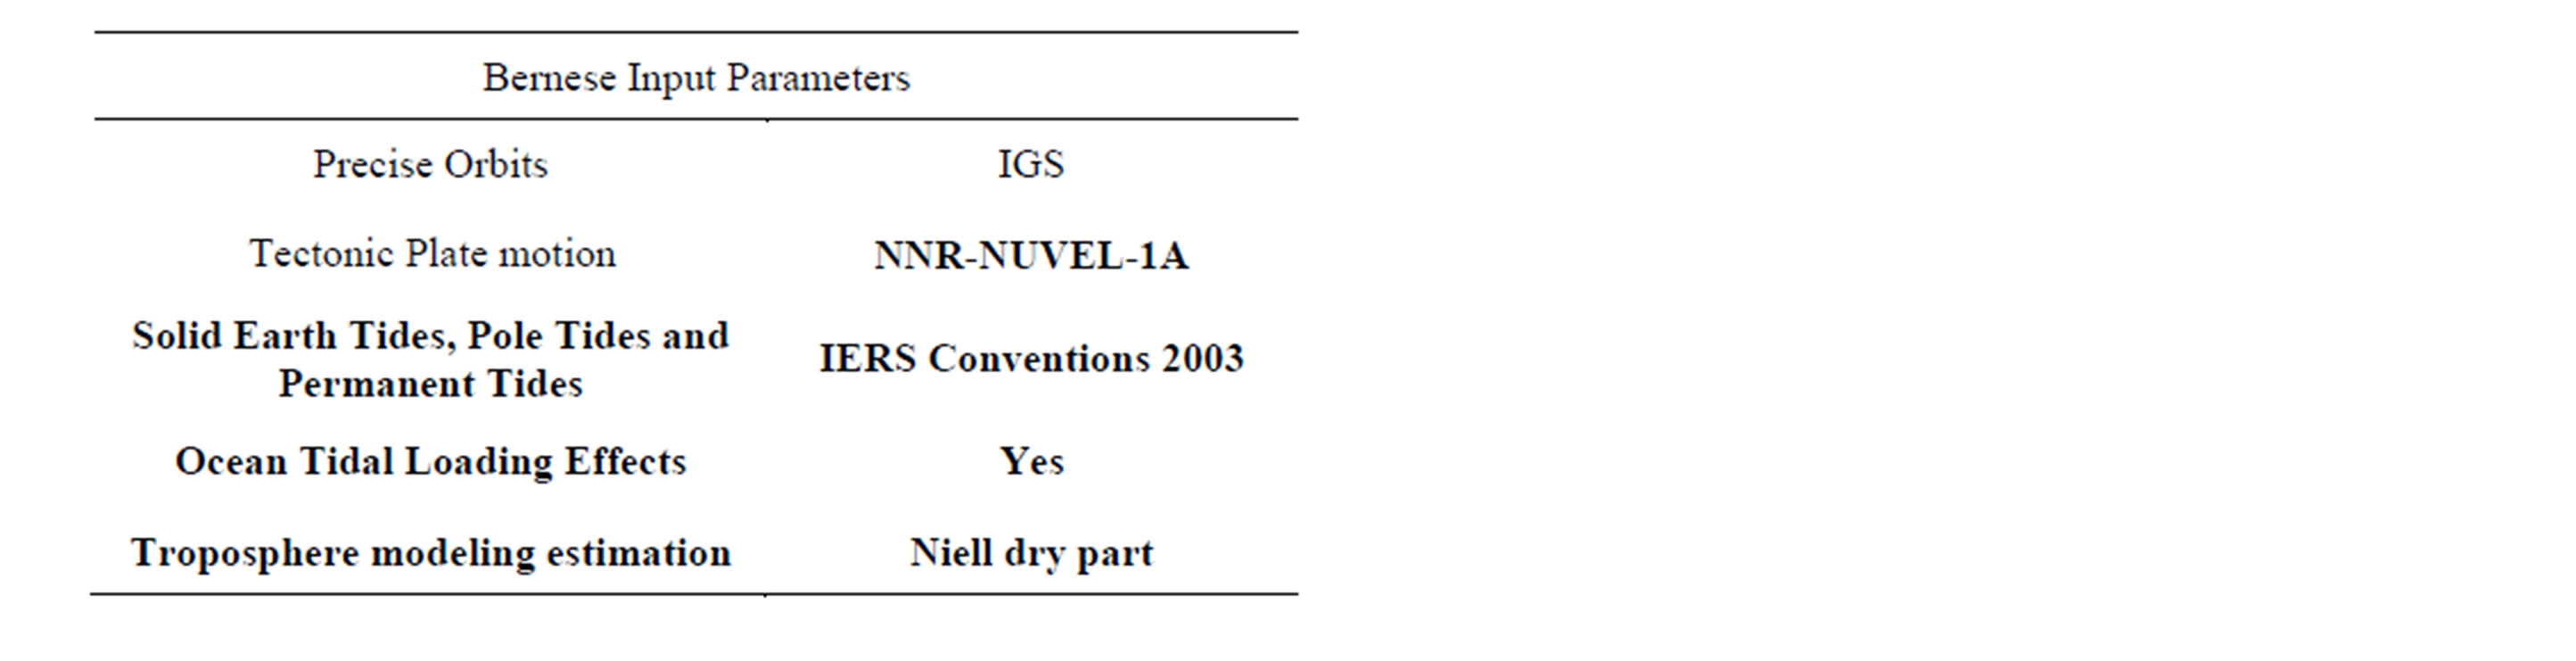
Table 2. Bernese Input Parameters.
possible to reach the same network analysis precision.
The PPP approach in our case is useful to identify problems and reject eventually GPS stations from the selected network before the RNX2SNX.
The RNX2SNX is intended for a double-difference based analysis of RINEX GNSS observation data from a regional network. Station coordinates and troposphere parameters are estimated and stored in SINEX format to facilitate further processing and combination [10].
An important feature of this technique is that observation files with significant gaps or unexpectedly big residuals are automatically removed from the processing to ensure a robust processing and a reasonable network solution. The final network solution is a minimum constraint one, accomplished by three no-net translation conditions imposed on a set of ITRF2000 reference coordinates. The coordinates of all involved 12 fiducial stations are subsequently verified by means of a 7-parameter Helmert transformation in order to produce distortion-free transformations. In case of discrepancies, the network solution is recomputed based on a reduced set of fiducial stations. Height data as a function of time has been obtained after pre-processing step.
Non linear least square method with a function  (where a and c are computed parameters) has been computed on Daily and Hourly data in order to identify possible negative trend in occasion of the Seismic event.
4. Results and Discussion
4.1. Daily Results
After plotting all 1400 GPS Network stations daily height data starting from January 1st, 2011, four different behaviors have been identified (Figure 2):
• Co-seismic effect
• Post-seismic effect
• Pre-seismic effect
• A So-called “January” effect Co-seismic effect is related to a large decrease of heights that occurs on the day of earthquake, while no other variation appears before or after the earthquake. This behavior has been revealed in many stations of the network generally located far enough from the epicentral area. These stations are reported in purple in the map (Figure 3).
Post-seismic effect concerns a permanent displacement that appears after the large decrease of altitude occurring the day of the earthquake. This behavior has been revealed in many stations of the network located mainly on the coastal direction near the epicentral area. Some of these stations are indicated in yellow in the map (Figure 3).
As for pre-seismic effect, about ten days prior the occurrence of the earthquake some suspect anomalous variation appears. This behavior was revealed in some stations of the network located mainly near the epicentral area.
Finally, during the first decades of January 2011 in many stations an evident variation of altitude (increase or decrease) appeared. In some case the variation was very large and this behavior was revealed mainly in stations located in the north of Japan. Red Squares in Figure 3 indicate GPS stations characterized by this kind of effect.
4.2. Hourly Results
Figure 4 shows the complete hourly sequence from the first of March to the end of March. As expected the result is comparable with the GSI elaborated daily data sequence. The only difference which characterizes GSI and ASI data is a negative constant of about 10 cm after the seismic event, this could depend from different parameters used for BERNESE software elaboration, GSI does not give its set of parameters but it seems that the constant shift depends on the choice of the reference point. In hourly data TSK has been set as the reference point and all GPS station positions have been calculated respect to this station. If, after the main shock, there is a TSK station shift this would appear on all GPS station measurements as a systematic error. We looked at TSK IGS elaborated data in order to confirm this hypothesis and what we found was a shift of exactly 10 cm (Figure 5).
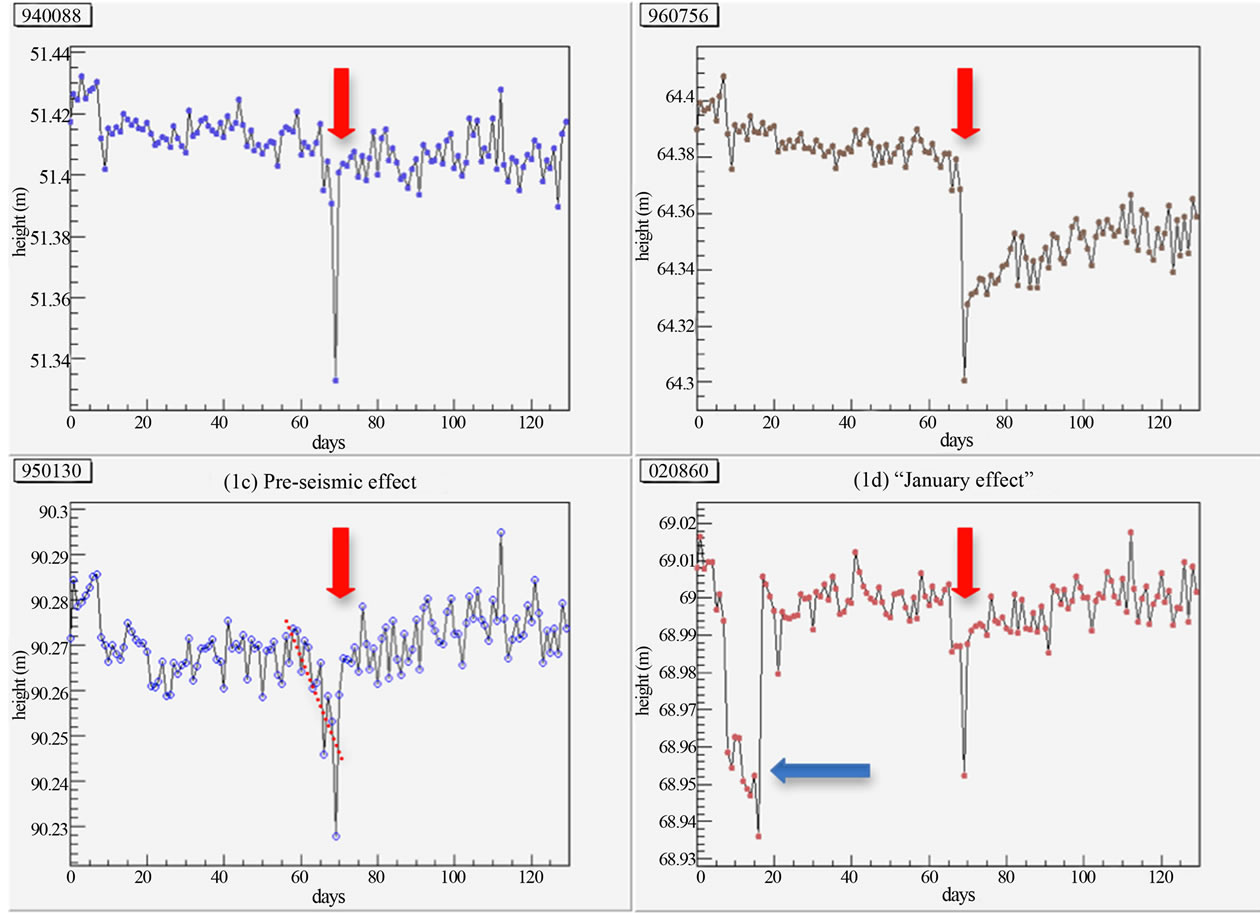
Figure 2. GPS-GSI daily data related to co-seismic effect, post-seismic effect, pre-seismic effect and January effect (Start day 1 January 2011).
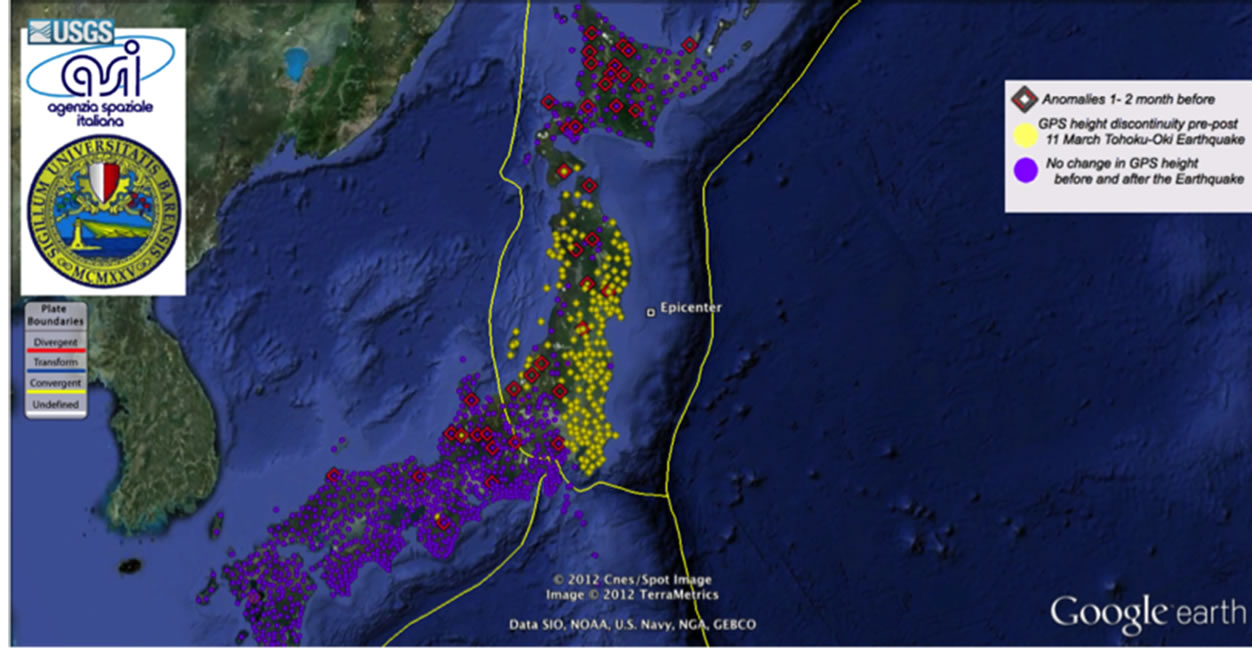
Figure 3. GPS-GSI daily data classified in terms of co-seismic effect (purple), post-seismic effect (yellow) and January anomalies (red-square).
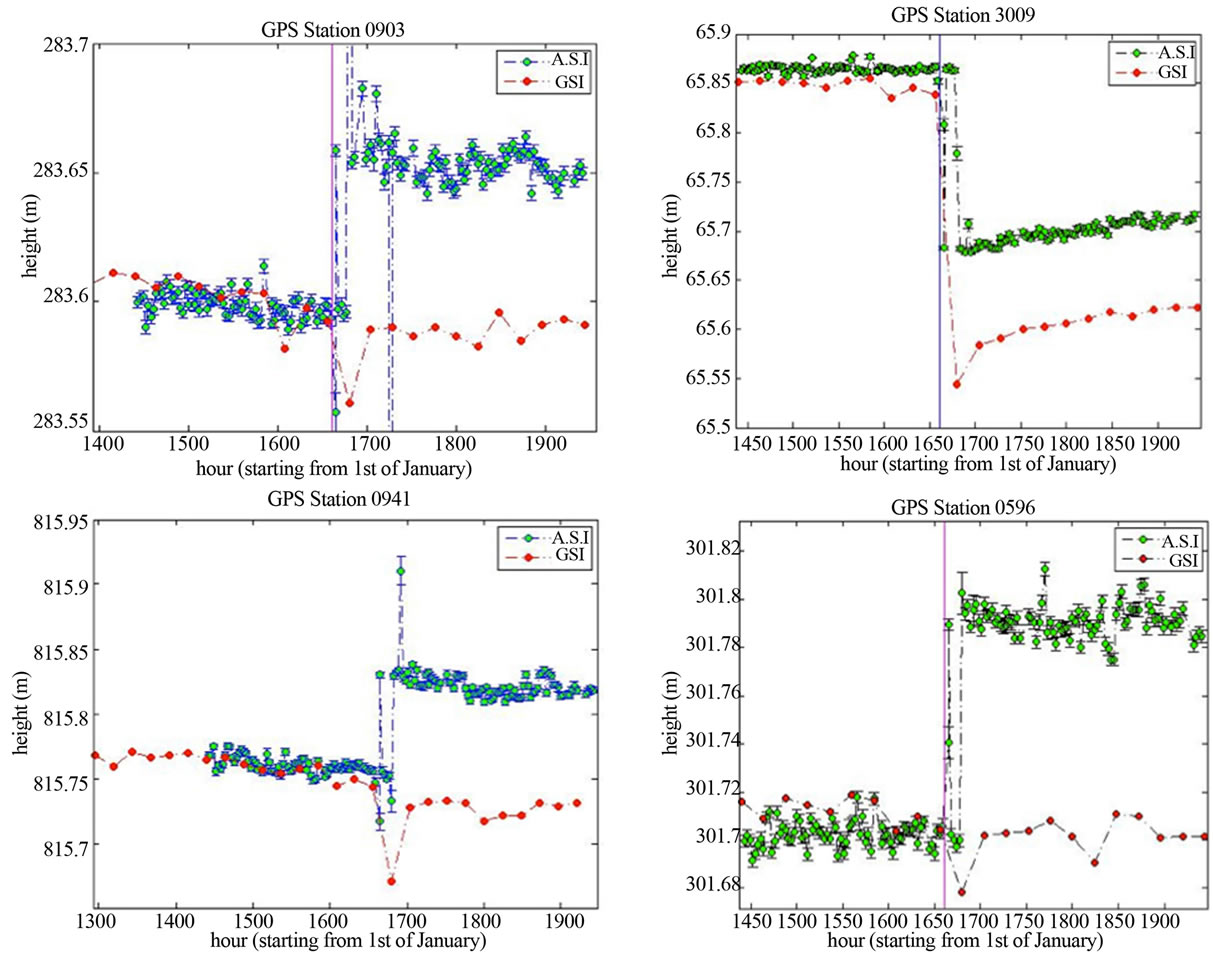
Figure 4. ASI and GSI Complete time series comparison.
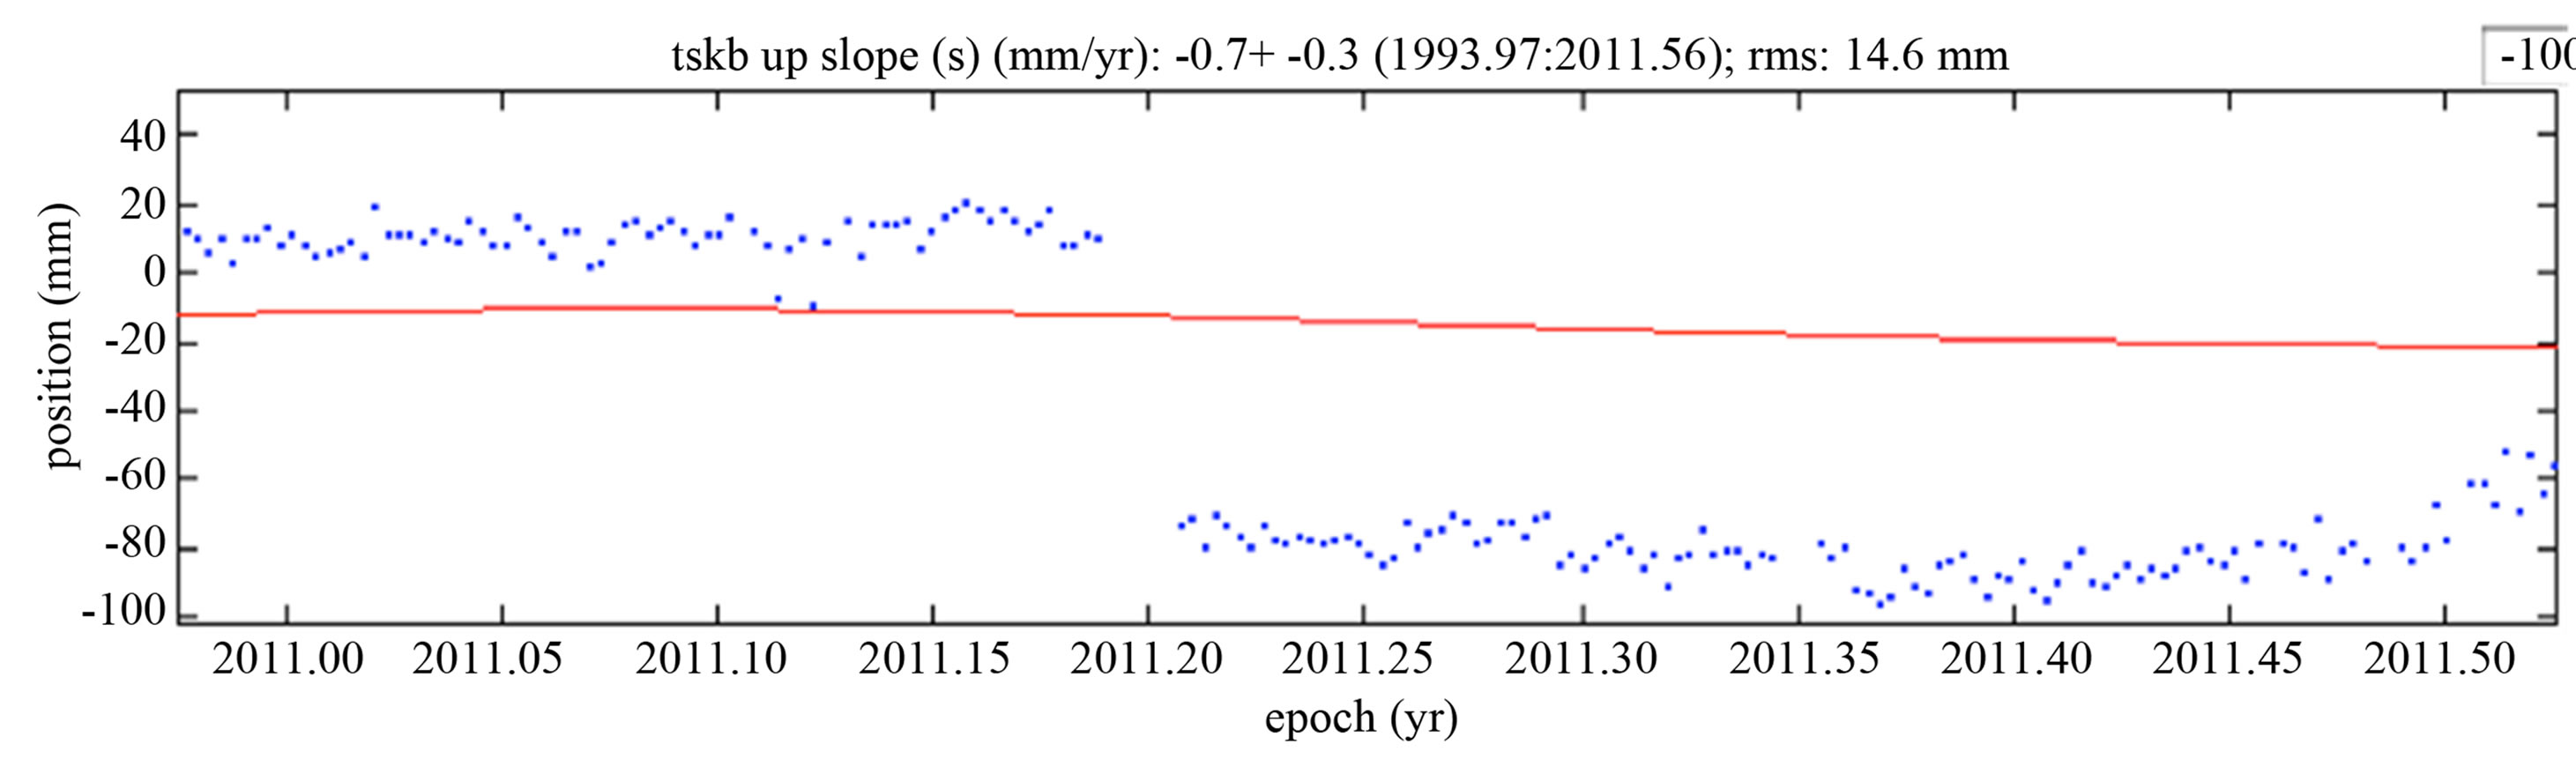
Figure 5. TSKB Altitude time series (JPL-SOPAC data [12]).
GSI and ASI GPS elaborated data substantially agree for what concerns data trends accordingly to the fact that GSI product is a data mediated over 24 hours while ASI product is a 12 hours window with a sliding window of 3 hours.
Only pre-seismic time series have been plotted in order to underline variation (Figure 6), trend fit has been added using a non linear least square method with a function
a and c are computed parameters. Purple line indicates time when the earthquake occurred.
A variation cannot be seen clearly for all stations, a different plot has been used for a better visualization (Figure 7).
It can be noticed that the 2 cm data dispersion and data trend of ASI elaborated data, substantially agrees with
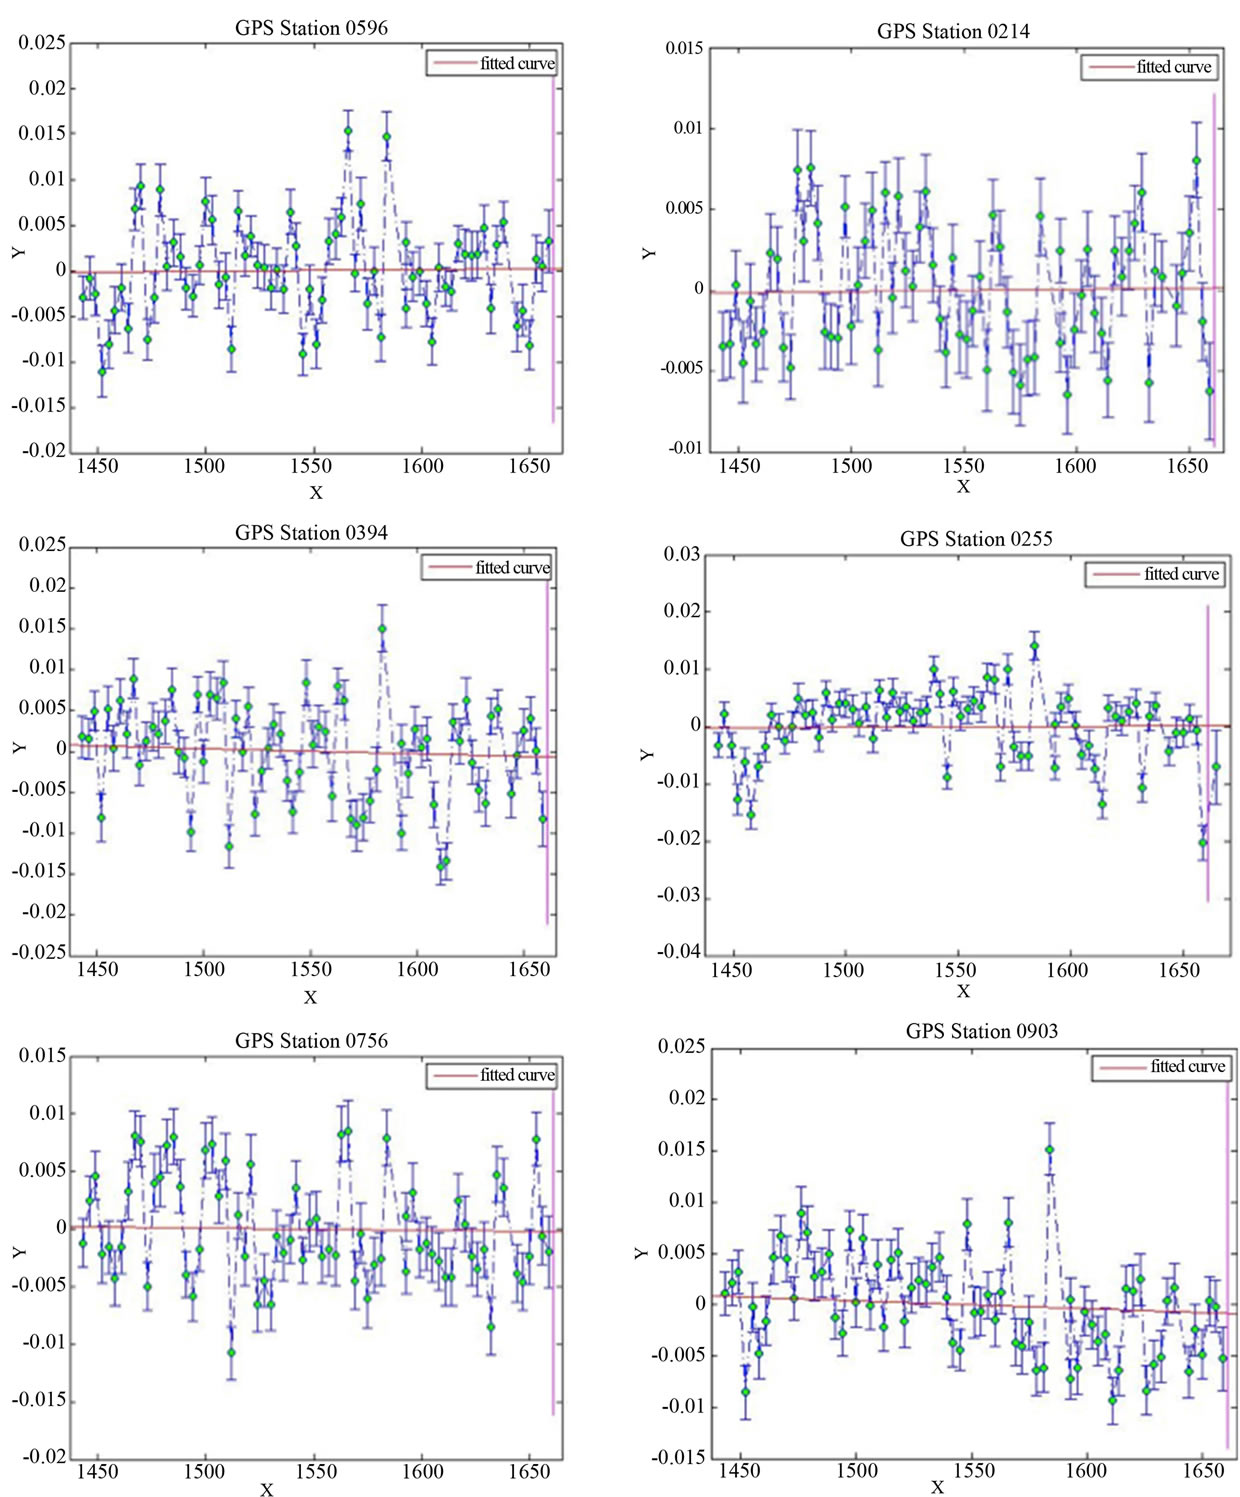
Figure 6. Pre-seismic time series of all GPS stations.
daily GSI data (Figure 8) in fact both data record a decline rate of 29.3 cm/year. According to the target, hourly analysis reduce RMS error from ±28.55 to ±8.63 cm/ year giving statistical evidence to the pre-seismic decline rate.
The explanation of the not so evident pre-seismic decrease can be found in three equally important points:
• Only 2 stations (940 and 903 Figure 7) of the GPS network chosen for 3 hours sliding window analysis show possible pre-seismic anomalies in daily data,
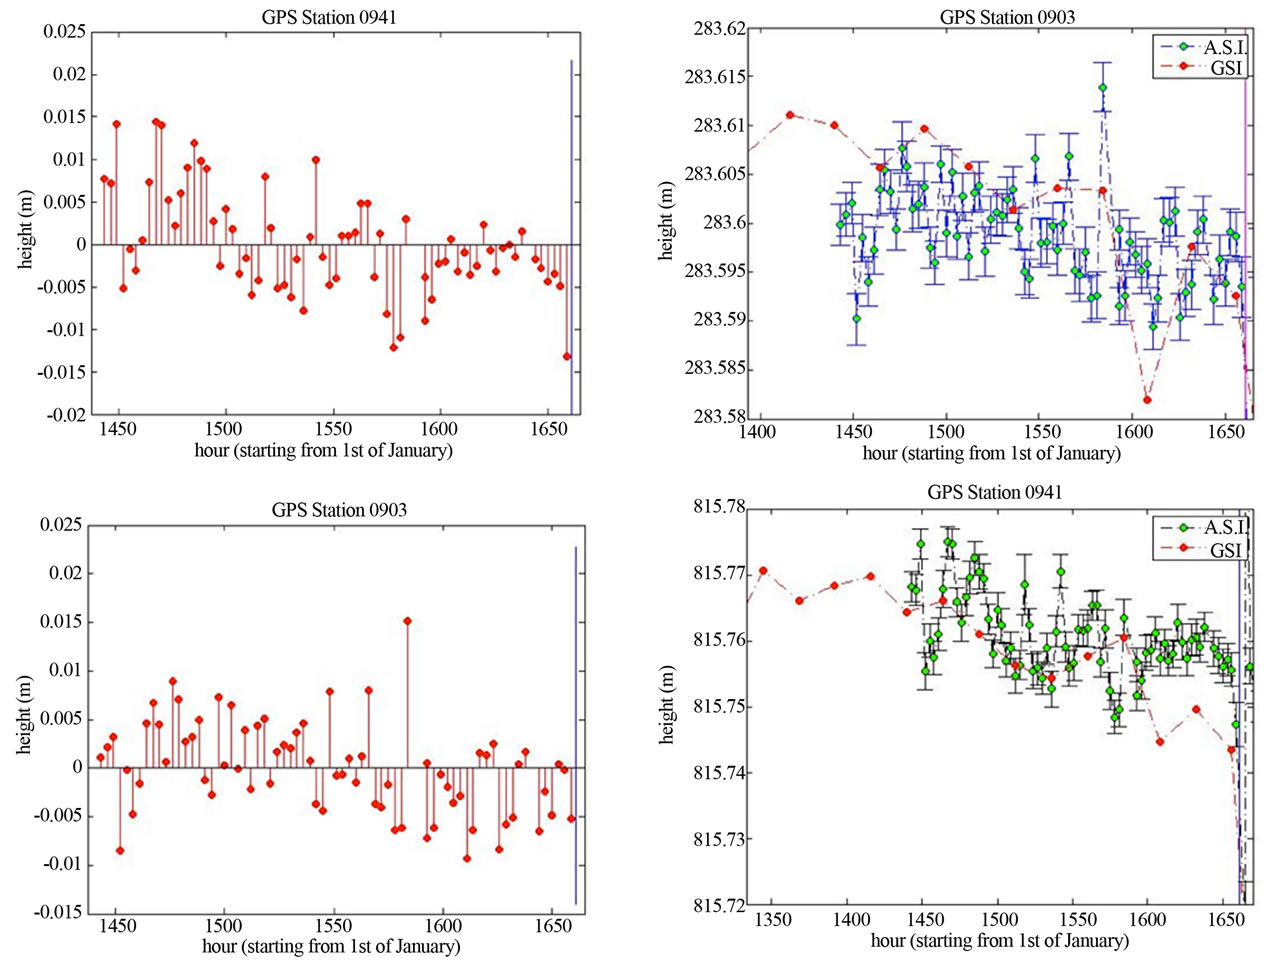
Figure 7. 903, 941 GPS stations pre seismic time series, GIS, A.S.I. Data comparison.
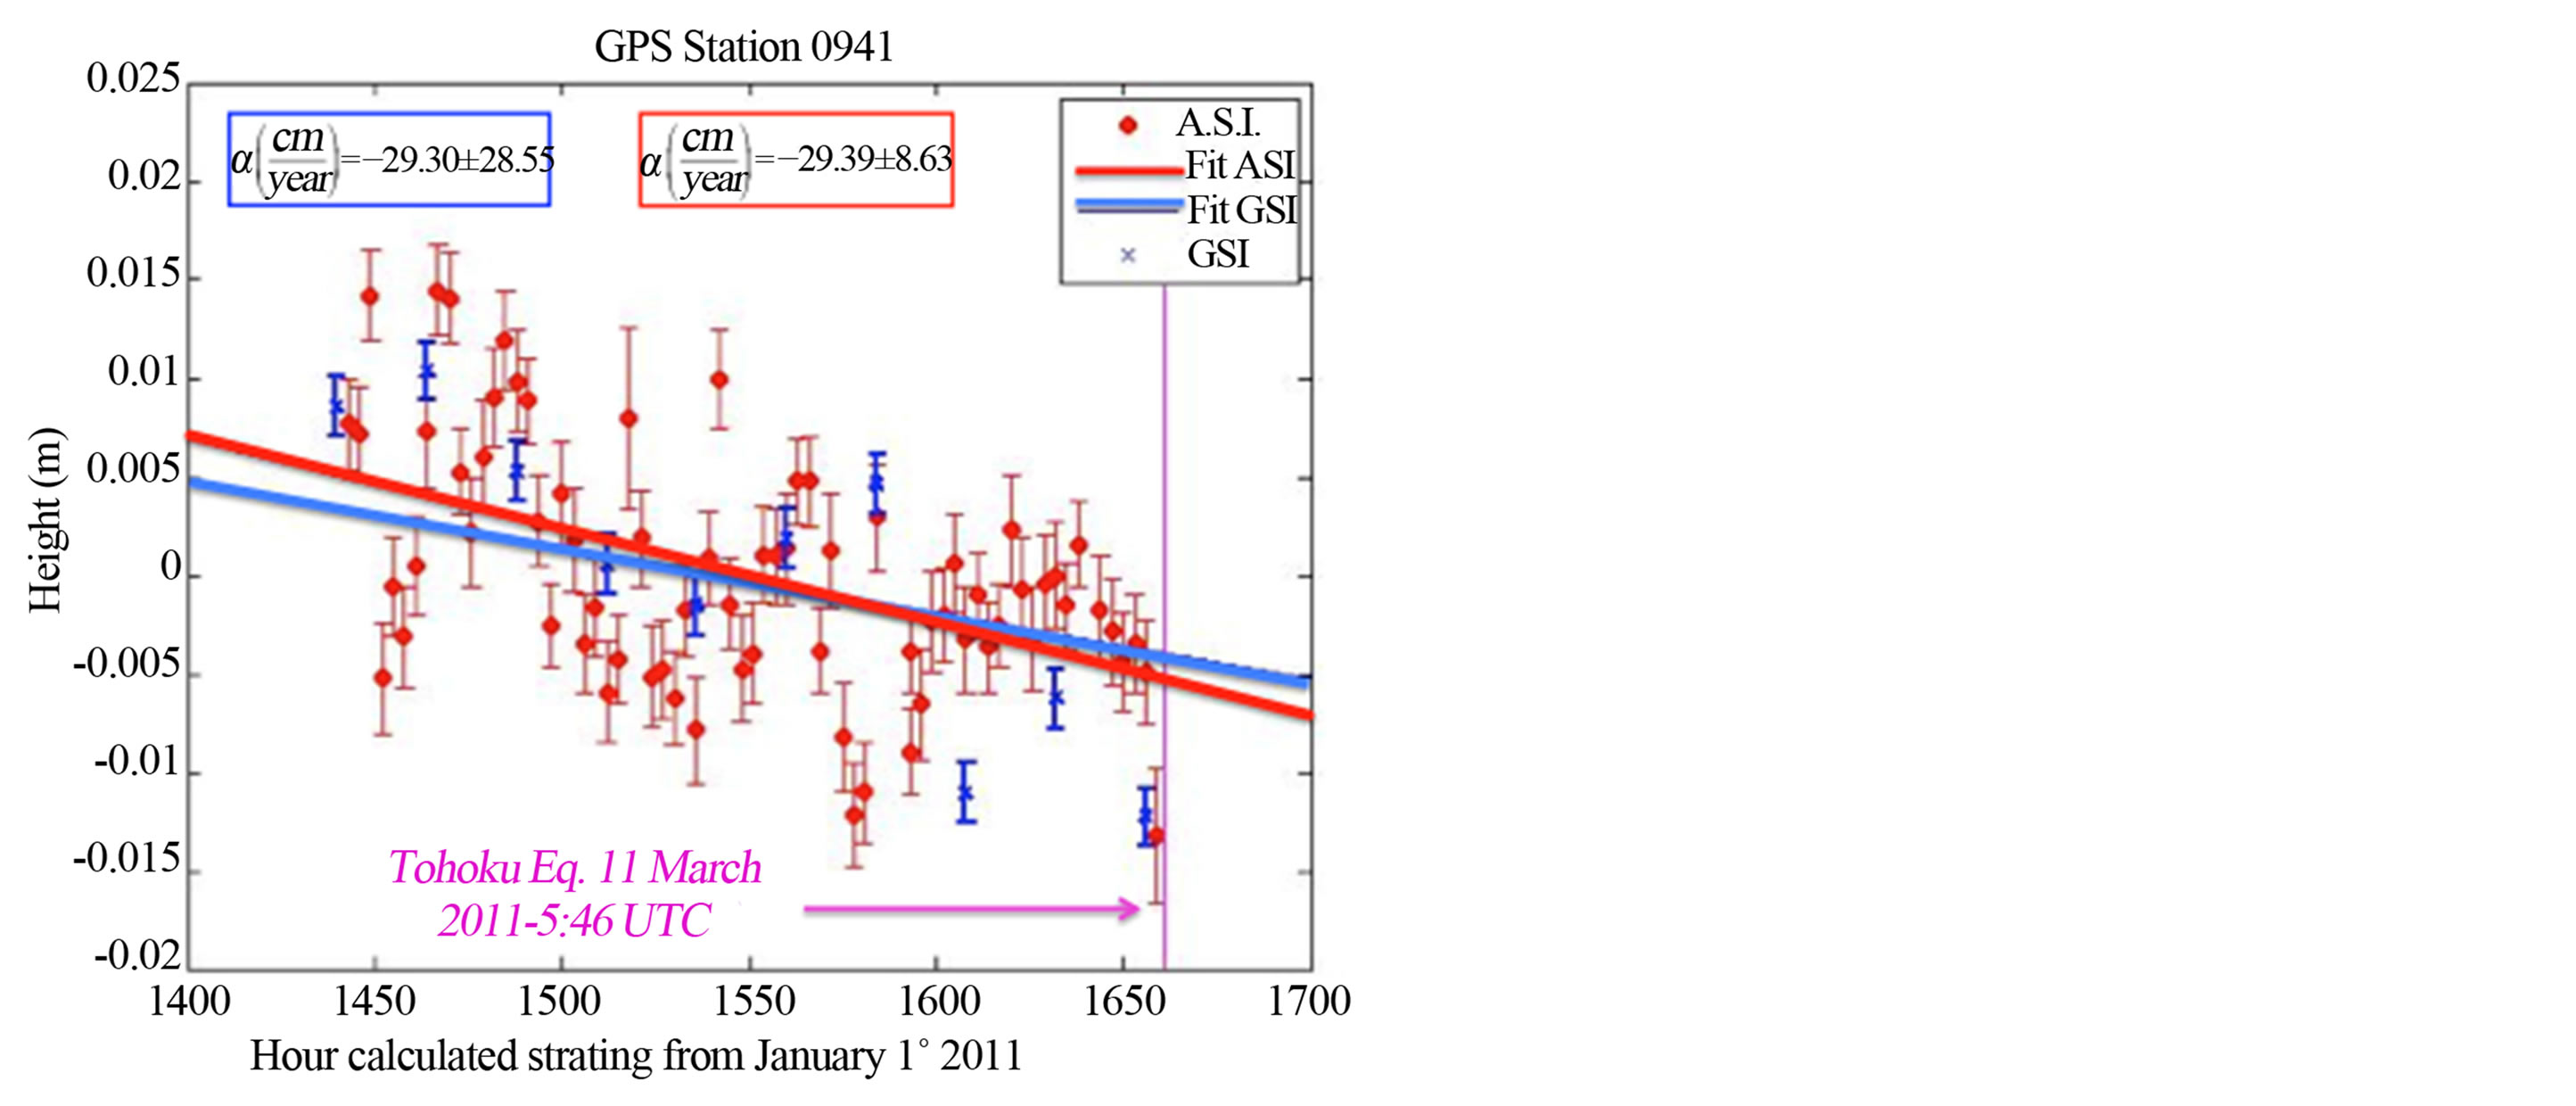
Figure 8. Dispersion and data trend of ASI elaborated data.
this negative trend is confirmed in hourly analysis with the same order of magnitude.
• Hourly analysis seems to be affected by a higher noise due to the 12 hour window used, GSI daily data use a 24 hours window, this means that if GPS acquires a signal every 30 seconds, each value of altitude is averaged over 1440 more data than a single hourly altitude value. This inevitably introduces a certain amount of noise.
• Hourly analysis covers a time period of only 10 days before the earthquake, this could have hidden in part the decrease effect as in the case of stations 903 and 941 (Figure 8).
5. Conclusions
This study has confirmed that an earthquake occurrence is a complex phenomenon that, apart from obvious coseismic and postseimic effects, implies also preseismic effects that can be described as anomalies. In this paper, the anomaly investigated refers to the value of the crustal heights measured by means of GPS techniques. In accordance with other types of anomalies, such as radio [3,5, 13,14] or chemical anomalies, the presesimic effects are mainly located around the epicentral area.
We can conclude that GPS techniques can be of extreme importance in the task of earthquake prediction, and together with other type of anomalies related to seismic activity, we can have the basis for a multi-parametric approach in earthquake prediction.
REFERENCES
- O. A. Molchanov, et al., “Precursory Effects in the Subionospheric VLF Signals for the Kobe Earthquake, Physics of the Earth and Planetary Interiors,” 1998.
- Hayakawa, et al., “On the Correlation between Ionospheric Perturbations as Detected by Subionospheric VLF/LF Signals and Earthquakes as Characterized by Seismic Intensity,” Journal of Atmospheric and Solar-Terrestrial Physics, Vol. 72, No. 13, 2010, pp. 982-987. http://dx.doi.org/10.1016/j.jastp.2010.05.009
- http://www.izmiran.ru/projects/IK19/
- Kasahara, et al., “The Ionospheric Perturbations Associated with Asian Earthquakes as Seen from the Subionospheric Propagation from NWC to Japanese Stations,” Natural Hazards and Earth System Sciences, Vol. 10, No. 8, 2010, pp. 581-588. http://dx.doi.org/10.5194/nhess-10-581-2010
- Hayakawa, et al., “A Statistical Study on the Correlation between Lower Ionospheric Perturbations as Seen by Subionospheric VLF/LF Propagation and Earthquakes,” Journal of Geophysical Research, Vol. 115, No. A9, Article ID: A09305.
- K. Heki, “Ionospheric Electron Enhancement Preceding the 2011 Tohoku-Oki Earthquake,” Geophysical Research Letters, Vol. 38, No. 8, Article ID: L17312.
- http://www.gsi.go.jp/
- http://acc.igs.org
- http://www.denshi.e.kaiyodai.ac.jp/ja/
- Bernese, “GPS Software Reference Manual,” University of Bern-Version 5.0, 2007.
- http://facility.unavco.org
- http://sopac.ucsd.edu/
- M. Hayakawa, et al., “A Possible Precursor to the 2011 3.11 Japan Earthquake: Ionospheric Perturbations as Seen by Subionospheric VLF/LF Propagation. (in Phase of Pubblication),” 2011.
- Biagi, et al., “Anomalies Observed in VLF and LF Radio Signals on the Occasion of the Western Turkey Earthquake (M = 5.7) at May 19, 2011 (in phase of pubblication),” 2011.