Journal of Minerals and Materials Characterization and Engineering
Vol.05 No.05(2017), Article ID:78892,14 pages
10.4236/jmmce.2017.55023
Fatigue Behaviour of Silicon Carbide and Fly Ash Dispersion Strengthened High Performance Hybrid Al 5083 Metal Matrix Composites
N. Santhosh1*, U. N. Kempaiah1, Ganesh Sajjan2, Ashwin C. Gowda3
1Department of Mechanical Engineering, University Visvesvaraya College of Engineering, Bangalore University, Bangalore, India
2Department of Aeronautical Engineering, Nitte Meenakshi Institute of Technology, Bangalore, India
3Department of CAE, VIAT, VTU - PG Centre, Muddenahalli, India

Copyright © 2017 by authors and Scientific Research Publishing Inc.
This work is licensed under the Creative Commons Attribution International License (CC BY 4.0).
http://creativecommons.org/licenses/by/4.0/


Received: June 30, 2017; Accepted: September 1, 2017; Published: September 4, 2017
ABSTRACT
Fatigue is a major issue concerning the use of aluminium composites in structural applications. Fatigue leads to weakening of material majorly due to the strain bands formed in the material when it is subjected to repeated loading; the damage that occurs due to fatigue is a progressive and localized one. The fatigue may occur at a stress limit much lesser than the ultimate stress limit of the composite specimen. Henceforth in the current work, fatigue behaviour of silicon carbide and fly ash dispersion strengthened high performance hybrid Al 5083 metal matrix composites are evaluated. The main purpose of fatigue characterisation is to distinctly evaluate the life cycle of components that are fabricated from metal matrix composites and eventually develop a framework model for the significant study of fatigue strength of the structure with persistent striations all along the interstitials of aluminium- silicon carbide-fly ash interfaces. Fatigue is a stochastic process rather than a deterministic one that gives a considerable scatter, even among samples of similar composition with the tests carried out in some of the critically controlled environments. Hence there is a need for statistical validation of the results to authenticate the data collected. Thus in the current work, analysis of variance is carried out to establish the authenticity of the results and validate them. The results and plots are presented with suitable rationale and inferences.
Keywords:
Fatigue, Aluminium, Silicon Carbide, Fly Ash, Statistical Validation

1. Introduction
The utilization of silicon carbide (SiC) particulate-reinforced aluminum matrix composites as a substitute of solid aluminum combinations in auxiliary applications, particularly in the aviation and automobile industry, is ending up noticeably progressively alluring. This is a direct result of their predominant quality; however, the fatigue of the aluminium silicon carbide composites, at lower stress cycles is a matter of concern. The fatigue conduct of the above mentioned composites is commanded by the interface between the aluminum lattice and the SiC particles. While reinforcing of silicon carbide depends on the load transfer at the interface, durability is affected by the conduct of the split at the limit between the matrix and the reinforcement, henceforth, a lot of research is conducted to overcome this influence by the unwinding of pinnacle worries close to the interface in view of the plastic deformation at fracture [1] [2] . As a result, the non- versatile conduct of the composite is critically examined by researchers, i.e. the fatigue behavior, and furthermore the fractography is evaluated in view of the justification of the inferences made. These progressions comprise of isolation and precipitation caused by the heat treatment that is anticipated to radically influence the fatigue behaviour of the Al/SiC composites [3] .
The reaction of the basic component to fatigue is very much important for some applications. On account of metal matrix composites (MMCs), the fatigue conduct varies from that of unreinforced metals in a few ways. On account of particle reinforced metals, various reviews have concentrated on understanding the impact of the strengthening molecule on the network microstructure and the relating impact on the fatigue conduct of the MMCs [4] [5] [6] [7] [8] . The size and weight percentage of the reinforcements are likewise influencing the fatigue life. Now and again, it has been observed that the fatigue behaviour may improve by the addition of fly ash as reinforcements [9] [10] . The association of various structures in view of the nearness of the reinforcements may prompt antagonistic consequences for the fatigue life. The fatigue quality of silicon carbide (SiCP)-strengthened A359 aluminum matrix composites has been answered to be for the most part impacted by the thermo-mechanical synthesis of the composite. Late reviews have talked about the impact of heat treatment on the interfacial quality and the mechanical properties of silicon carbide (SiCP)-strengthened A359 aluminum matrix composite [11] . The outcomes demonstrated the interrelation between the heat treatment, the matrix reinforcement interface quality and the characterization of static properties of the composite. Further to the static properties, the heat treatment is normal to be of huge significance for the dynamic conduct of these materials. The objective of this study involved the characteristic evaluation of fatigue properties of aluminium composites for varying percentages of silicon carbide and fly ash particulates and statistically validating the same for checking its authenticity.
2. Materials and Its Characteristics
Aluminium AA 5083 alloy with exceptional performance in extreme environments and highest strength among non heat treatable alloys is processed along with the class C Fly ash (Requirements matching ASTM C618 standards) and 35 micron to 50 micron size silicon carbide enroute stir casting. The properties of each of the materials chosen and process parameters selected for development of composite material are as given below in the following Tables 1-4.
The silicon carbide and fly ash particulates are observed and their micrographic images are obtained at a magnification of 500× and 7 kV acceleration voltage in an Hitachi make SU-3500 scanning electron microscope with a low vacuum premium SE detector setup. The SEM images clearly given an inference of the mesh size of each of the particulates taken, the size of silicon carbide particulates vary in the range of 30 microns to 50 microns, whereas the size of fly ash flakes vary in the range of 5 microns to 25 microns with some flakes having sizes more than 50 microns and extending up to 100 microns (Figure 1).

 (a) (b)
Figure 1. (a) SEM image of Fly ash Particulates; (b) SEM image of Silicon Carbide particulates.

Table 1. Composition specification in weight percentage of elements.
Table 2. Properties table of Al AA 5083 alloy.
Table 3. Composition table of Fly ash.
Table 4. Property table of silicon carbide.
3. Material Processing Methodology
Stir casting of aluminium-silicon carbide-Fly ash composites is achieved in a graphite crucible mounted in an oil fired furnace fitted with a zircon-graphite coated mild steel stirrer with impeller attachments.
Ingots of Aluminium 5083 alloys are initially cut into small pieces and weighed for a specified accuracy of the scale and are preheated at a temperature of 400˚C for a duration of 60 minutes to 90 minutes before melting and mixing the preheated and electro-less nickel coated silicon carbide and fly ash particulates, The temperature of the furnace is at the first, raised to about 750˚C + 100˚C to begin with the melting of the aluminium metal pieces and then brought down to the preset liquidus temperature of aluminium to facilitate the dispersion of silicon carbide and fly ash particulates in the molten metal, further the slurry is stirred using the refractory coated mild steel impeller coupled to a motor with a varying speed gear box attachment.
After initial stirring of the molten metal and the reinforcements, the furnace temperature is set to maintain at a parametric range selected in current work and stirred at a preset speed for definite time duration.
The process parameters selected for stir casting the aluminium composites based on extensive review of literature and thorough evaluation of the capabilities of the equipment, are listed below in Table 5.
4. Experiments and Validation
The fatigue test is carried out on an Instron make Rotating beam fatigue testing machine, wherein the specimen is taken to be a beam loaded symmetrically at either ends such that the specimen is subjected to a cycle of tension and compression and thereby the flexural stresses above and below the neutral fibre becomes maximum and minimum during one course of loading [12] - [17] . The test is carried out for all the specimens in accordance with the ASTM F1160, ISO 1143 specifications and the values noted for further tabulation and statistical validations. The maximum load applied on specimen is 75 kg (735 N, Approximately 0.75 kN).
The specimen is a straight shank one, prepared as per the drawings given by Instron, the gauge diameter of the specimen is taken as 8 mm with the gauge length considered as 49.212 mm; the overall length of the specimen is considered at 87.31 mm (Figure 2).
The trials are carried out as per the design of experiments comprehensively including L16 orthogonal array using Taguchi method for characteristic evaluation.
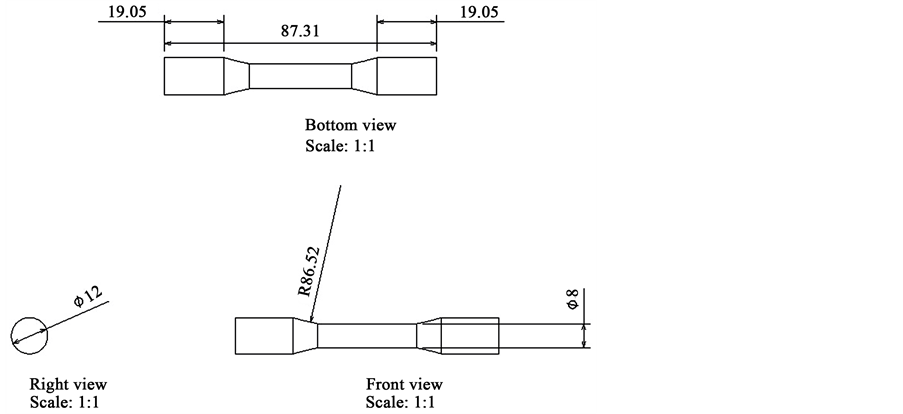
Figure 2. Specimen dimensions for Fatigue test (Source: Instron RRM Equipment Manual).
Table 5. Process parameters selected for stir casting.
The Taguchi method is majorly used, especially in situations where the settings of many factors are necessary. The Taguchi method is extensively of help in processing of a composite and evaluation of the properties of the material developed. Henceforth it is very important to choose appropriate orthogonal arrays especially in case of multiple factors as in current work. An extensive of available literature has been carried out and appropriately a L16 orthogonal array is constituted for experimentations.
The L16 orthogonal array is constituted considering five factors namely, Melt temperature, Rotation speed, Stirring duration, Wt % of SiCp, Wt % of Fly ash, The table gives a matrix of 16 experiments that is carried out in particular relation to the factors and the response (which is the fatigue strength of the specimens) is noted for each and every trial. Further upon the analysis of variance is carried out to effectively determine the variation of means of the results obtained at the end of each trial.
The results of fatigue tests for different trials designed as per L16 orthogonal array are tabulated and further analyzed for optimized parameters, rank and delta values for each of the factors considered.
The specimens are evaluated for fatigue life and fracture behaviour and the data obtained are validated for authenticity.
In order to carry out the fatigue test, the specimen is held tightly by the collets and supported by the clamp using a press down type locking arrangement; the load to be applied on the specimen is decided upon the bending moment to be imposed. Better loading capabilities is ensured by making use of a pin support, otherwise the specimen will rotate without the application of load; once the specimen is loaded, the motor is started and thus the alternate cycles of load is imposed on either side of the neutral axis and there by flexural tensile stress and flexural compressive stress are imparted on the opposite sides of mid-plane [18] [19] [20] [21] [22] (Figure 3).
The endurance strength for the given specimen are generally calculated using either Soderberg, Goodman or Gerber equations, out of which Soderberg equation is the most conservative one, Thus Soderberg equation is considered as the governing equation for establishing the relationship for endurance strength of the specimens (Figure 4).

Figure 3. Catia part model of the fatigue specimen.

Figure 4. A typical schematic showing Gerber, Goodman and Soderberg lines and relation between the variable stress and the mean stress in an ideal fatigue test (Image Source: NPTEL Courseware) [23] .
(1)
where is the stress amplitude, is the endurance limit, is the mean stress value and is the yield stress limit of the specimen.
The stress caused in specimen due to fatigue is determined from the experimentation using the equation
(2)
where M is the bending moment given by the equation
(3)
Z is the section modulus given by the equation
(4)
5. Results and Discussion
5.1. Experimental Values
The results of the experiments carried out as per the L16 orthogonal array is presented as in the table below, and critical inferences are drawn based upon the results obtained.
The results of the fatigue test for different composition and parameters as obtained from L16 orthogonal array of Taguchi Genichi method are as tabulated in Table 6, it can be noticed from the table that the fatigue strength of the specimens ranges from a minimum of 138.65 MPa to a maximum of 218.52 MPa and the number of cycles to failure varies from a minimum of 8.29 × 10³ cycles to a maximum of 4.37 × 10⁷ cycles, i.e. the number of cycles to failure varies in the range of 103 cycles to 105 cycles for specimens with lesser endurance limit, (considered as fatigue strength in present work) whereas it ranges up to 109 cycles for specimens with higher endurance limit. The SN curve clearly indicates that the endurance limit is a major factor to exhibit fatigue behaviour by any material (Figure 5).
5.2. Taguchi Method
Taguchi genichi method mainly aims at optimizing the loss function. In this approach, basically the deviation of a value from its characteristic nominal value is optimized. It basically gives an overview of the uncontrollable factors termed as noise in this approach and its responsible parameters for deviation of the results in experiments. Thus it gives an array of different runs (trials) for conducting the experiments such that the design of experiments developed is robust to give optimal solutions. In Taguchi method the process and product parameters are set such that the variability is minimized and the results optimized, that is the design experiments is majorly aimed at designing experiments such the signal to
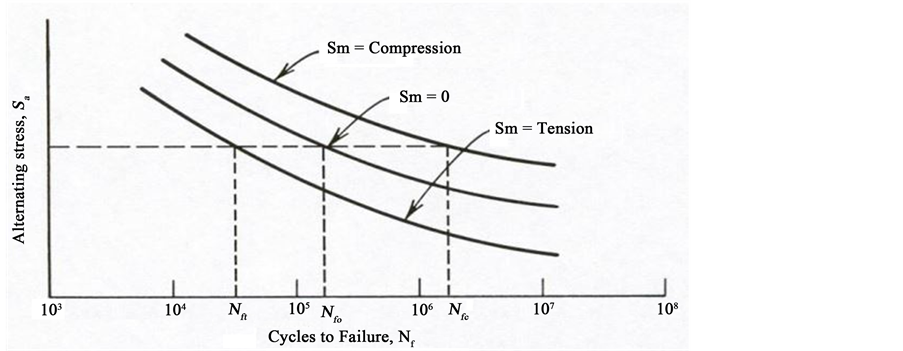
Figure 5. A Typical SN Curve for estimating the fatigue life (Image Source: Metal Fatigue in Engineering, 2nd Edn, Ralph I. Stephens, Ali Fatemi, Robert R. Stephens, Henry O. Fuchs) [24] .
Table 6. Results of fatigue test carried out in the run order of L16 Orthogonal array.
noise ratios are determined to optimize the factors considered for design of the experiments. The signals to noise (SN) ratios are basically derived based on the loss functions as suggested by Taguchi. In current work, the condition of “Larger is Better”, is considered for determining the SN ratio to evaluate the effect of design factors on fatigue behavior of the specimens. The response considered for evaluation is fatigue strength (Endurance limit) in MPa, with factors considered for the same being Melt temperature in degree Celsius, stirring speed in rpm, stirring duration in minutes, weight percentage of SiCp, weight percentage of fly ash. The plots obtained after Taguchi analysis is mean of means versus temperature and mean of SN ratios versus temperature. The critical elements of results of the Taguchi analysis are as tabulated (Table 7).
The main effect plot for SN ratios gives a clear inference that the weight percentage of silicon carbide is the major factor in deciding the fatigue strength followed by weight percentage of fly ash, stirring duration, stirring speed and melt temperature. The SN ratio is optimized for larger is better condition and tabulated (Figure 6).
From critical evaluation of the response Table 8 for signal to noise ratios, it can be clearly seen that the weight percentage of silicon carbide is the major factor that improves the fatigue strength ranked first among all the other contributing factors, followed by weight percentage of fly ash, stirring duration, stirring speed and melt temperature. The combination of weight of about 9% of silicon carbide, weight of about 5% of fly ash, stirring duration of 15 minutes, stirring speed of 50 rpm, and melt temperature of 670˚C is the optimized set of parameters that will yield the best result, i.e. the maximum fatigue strength possible (Figure 7).
Table 7. L16 orthogonal array for design of experiments using Taguchi Genichi statistical validation methods.

Figure 6. Main Effects Plot for SN ratios.

Figure 7. Mean of Means plot for different factors.
Table 8. Response matrix for signal to noise ratios (Larger is better).
The main effect plot for mean of means gives a clear inference that the weight % of silicon carbide is the major factor which can enhance the fatigue strength of the specimens, followed by the weight % of fly ash, stirring duration, stirring speed and melt temperature.
From critical evaluation of response Table 9 for mean of means, it can be clearly seen that the mean of means of fatigue strength is maximum for a weight of 9% of silicon carbide, followed by a weight of 5% of fly ash, stirring duration of 15 minutes, stirring speed of 50 rpm and melt temperature of 670˚C.
Thus the Taguchi method gives an optimized set of values which yield maximum fracture strength among all the composites developed. These results can be used to further enhance the characteristics of composite materials developed by adopting process parameters provided by statistical validations as optimum from rigorous analysis.
5.3. Fractography
Fractography of the specimen is taken to visualize the fatigue zone, in which the stress is fully reversed; the irregular striations with random and crack front locations are identically seen in fractograph captured using SEM. The typical fractograph for the composite developed with 3% Silicon carbide and 2% Fly ash at a melt temperature of 650˚C, stirring speed of 50 rpm and stirring duration of 15 minutes is given in Figure 8.

Figure 8. SEM Fractograph of Aluminium―3% SiC and 2% Fly ash composite specimen cast at a melt temperature of 650˚C, Stirring speed of 50 rpm and Stirring duration of 15 minutes.
Table 9. Response matrix for mean of means.
From the fractograph, clear inferences can be drawn with regard to the mode of fracture which is essentially a ductile one, signified by the dimple structures and cavities interlaced with irregular striations. The cavities generally aggravate due to inclusions of precipitates that are enlarged further upon by repeated loading. The monotonic zone observed in the fractograph is an indication of the severe plastic deformation developed at the juncture of intermediate loading in the fatigue band of the specimen.
The fractograph of a fatigue specimen serves as the basis for analyzing the fracture mechanism in the component. The inferences drawn clearly give an overview of the failure of the specimen in the very context that the coarse slip bands formed provide the crack path that tends to be localized with varying stress intensity.
6. Conclusions
The analysis of the results obtained has yielded us with enough inferences to the very fact that the fatigue strength of the aluminium increases with the addition of particulate reinforcements, i.e. silicon carbide and interfacial lubricating particles in the form of fly ash particles. Furthermore, the conclusions drawn from the results of current work are:
1) The fatigue strength of specimens varies from a minimum of 138.65 MPa for the composite specimen developed with 3 weight percentage of SiCp, 4 weight percentage of fly ash at a melt temperature of 690˚C, stirring speed of 200 rpm and stirring time of 20 minutes to a maximum of 218.52 MPa for the composite specimen developed with 9 weight percentage of SiCp, 4 weight percentage of fly ash at a melt temperature of 670˚C, stirring speed of 100 rpm and stirring duration of 15 minutes.
2) The fatigue life cycle of the specimens varies from 103 cycles to 109 cycles with varying composition and process parameters. The fatigue life for the specimen with minimum fatigue strength of 138.65 MPa ranges from 2.15e3 to 5.01e5 cycles, while the fatigue life cycle for the specimen with maximum fatigue strength of 218.52 MPa ranges from 9.29e5 to 2.64e9 cycles.
3) The Taguchi method constituted using L16 orthogonal array has given a range of optimum parameters for the factors considered in the experimentation. The SN ratio is considered to be optimum for “Larger is the best condition” and henceforth the ranking based on the delta value is the highest for silicon carbide and least for the melt temperature. i.e., the effect of the weight percentage of silicon carbide as a factor on the fatigue strength is ranked first, followed by weight percentage of fly ash, stirring duration, stirring speed, and melt temperature.
4) The optimized set of values of 9 weight percentage of SiC, 5 weight percentage of Fly ash, stirring duration of 15 minutes, stirring speed of 50 rpm and melt temperature of 670˚C will yield the maximum fatigue strength based on the signal to noise ratio and mean values obtained from Taguchi analysis.
5) The fractographs clearly indicate the presence of irregular striations with random and crack front locations interlaced with dimple structures and cavities that are a distinctive feature of fatigue failure.
Cite this paper
Santhosh, N., Kempaiah, U.N., Sajjan, G. and Gowda, A.C. (2017) Fatigue Behaviour of Silicon Carbide and Fly Ash Dispersion Strengthened High Performance Hybrid Al 5083 Metal Matrix Composites. Journal of Minerals and Materials Characterization and Engineering, 5, 274-287. https://doi.org/10.4236/jmmce.2017.55023
References
- 1. Schwartz, M.M. (1997) Composite Materials: Processing, Fabrication and Application. Prentice Hall, Upper Saddle River, New Jersey.
- 2. Ceschini, L., Minak, G. and Morri, A. (2006) Tensile and Fatigue Properties of the AA6061/20 vol.% Al2O3p and AA7005/10 vol.% Al2O3p Composites. Journal of Composite Science and Technology, 66, 333-342. https://doi.org/10.1016/j.compscitech.2005.04.044
- 3. Kaynak, C. and Boylu, S. (2006) Effects of SiC Particulates on the Fatigue Behaviour of an Al-Alloy Matrix Composite. Journal of Materials and Design, 27, 776-782. https://doi.org/10.1016/j.matdes.2005.01.009
- 4. Hashim, J., Looney, L. and Hashmi, M.S.J. (2002) Particle Distribution in Cast Metal Matrix Composites Part I. Journal of Material Processing Technology, 123, 251-257. https://doi.org/10.1016/S0924-0136(02)00098-5
- 5. Prangnell, P.B., Barnes, S.J., Withers, P.J. and Roberts, S.M. (1996) The Effect of Particle Distribution on Damage Formation in Particulate Reinforced Metal Matrix Composites Deformed in Compression. Materials Science and Engineering A, 220, 41-56. https://doi.org/10.1016/S0921-5093(96)10461-5
- 6. Yotte, S., Breysse, D., Riss, J. and Ghosh, S. (2001) Cluster Characterization in a Metal Matrix Composite. Materials Characterization, 46, 211-219. https://doi.org/10.1016/S1044-5803(01)00126-7
- 7. Bindumadhavan, P.N., Chia, T.K., Chandrasekaran, M., Keng, W.H., Nee, L.L. and Prabhakar, O. (2001) Effect of Particle-Porosity Clusters on Tribological Behavior of Cast Aluminum Alloy A356-SiCp Metal Matrix Composites. Materials Science and Engineering A, 315, 217-226. https://doi.org/10.1016/S0921-5093(00)01989-4
- 8. Hong, S.J., Kim, H.M., Huh, D., Suryanarayana, C. and Chun, B.S. (2003) Effect of Clustering on the Mechanical Properties of SiC Particulate Reinforced Aluminium Alloy 2024 Metal Matrix Composites. Materials Science and Engineering A, 347, 198-204. https://doi.org/10.1016/S0921-5093(02)00593-2
- 9. Llorca, J. (2002) Fatigue of Particle- and Whisker-Rein-Forced Metal-Matrix Composites. Progress in Materials Science, 47, 283-353. https://doi.org/10.1016/S0079-6425(00)00006-2
- 10. Bonnen, J.J., You, C.P., Allison, J.E. and Jones, J.W. (1990) Fatigue Properties of SiC Particulate Reinforced Al-Alloys. Proceeding of 4th International Conference on Fatigue, Honolulu, 887-892.
- 11. Suresh, S. (1991) Fatigue of Materials. Cambridge University Press, Cambridge.
- 12. Logsdon, W.A. and Lian, P.K. (1986) Tensile, Fracture Toughness and Fatigue Crack Rate Properties of Silicon Carbide Whisker and Particulate Reinforced Aluminium Metal Matrix Composites. Engineering Fracture Mechanics, 24, 737-751. https://doi.org/10.1016/0013-7944(86)90246-8
- 13. Kumai, S., Yoshida, K., Higo, Y. and Nunomura, S. (1992) Effects of the Particle Distribution Fatigue Crack Growth in Particulate SiC/6061 Aluminium Alloy Composites. International Journal of Fatigue, 14, 105-112. https://doi.org/10.1016/0142-1123(92)90086-R
- 14. Leinum, J.R., Pedersen, K. and Roven, H.J. (1992) Effects of Crack Direction on Fatigue Crack Propagation Mechanisms in an Uncrystallized AlM gSi Alloy. The Proceeding of the 3rd International Conference on Aluminium Alloys, Norway, 521-526.
- 15. Niklas, A., Froyen, L., Wevers, M. and Delaey, L. (1995) Acoustic Emission during Fatigue Crack Propagation in SiC Particle A1 Matrix Composites. Metallurgical and Material Transaction A, 26, 3183-3189. https://doi.org/10.1007/BF02669447
- 16. Shang, J.K. and Ritchie, R.O. (1989) On The Particle-Size Dependence of Fatigue-Crack Propagation Thresholds in SiC-Particulate Reinforced Aluminium Alloy Composites: Role of Crack Closure and Crack Trapping. Acta Metallurgical, 37, 2267-2278. https://doi.org/10.1016/0001-6160(89)90154-5
- 17. Davison, D.L. (1989) The Growth of Fatigue Cracks Through Particulate SiC Reinforced Aluminium Alloys. Engineering Fracture Mechanics, 33, 965-977. https://doi.org/10.1016/0013-7944(89)90111-2
- 18. Kassam, Z.H.A., Zhang, R.J. and Wang, Z.R. (1994) Finite Element Situation to Investigate Interaction between Crack and Particulate Reinforcement in Metal Matrix Composites. Material Science Engineering, 203, 286-299.
- 19. Hasson, D.F., Crowe, C.R., Aheam, J.S. and Cook, D.C. (1984) Failure Mechanism in High Performance Materials. In: Early, J., Shives, R. and Smith, J., Eds., Cambridge University Press, Cambridge, 14.
- 20. Guerra-Rosa, L., Moura Branco, C. and Radon, J.C. (1984) Monotonic and Cyclic Crack Tip Plasticity. International Journal of Fatigue, 6, 17-84. https://doi.org/10.1016/0142-1123(84)90004-5
- 21. Santhosh, N., Kempaiah, U.N. and Bhanupratap, R. (2016) Critically Damped Composite Plates for Structural Applications in Smart Cities. International Conference on Development of Smart Cities, Interface, Governance & Technology, Dr Ambedkar Institute of Technology, Bangalore, Karnataka, 9-10 September 2016, 31-34.
- 22. Santhosh, N., Kempaiah, U.N. and Venkateswaran, S. (2017) Vibration Mechanics of Hybrid Al 5083/SiCp/Fly Ash Composite Plates for Its Use in Dynamic Structures. Journal of Experimental & Applied Mechanics, 8, 11-18.
- 23. Design for Strength, Module-3, NPTEL Course Ware, IITKGP. http://nptel.ac.in/courses/112105125/pdf/Module-3_lesson-4.pdf
- 24. Stephens, R.I., Fatemi, A., Stephens, R.R. and Fuchs, H.O. (2000) Metal Fatigue in Engineering. 2nd Edition, John Wiley & Sons, Hoboken.