Journal of Minerals and Materials Characterization and Engineering
Vol.2 No.5(2014), Article
ID:49526,12
pages
DOI:10.4236/jmmce.2014.25044
Carbothermic Reduction Kinetics of Ka’oje (Nigeria) Manganese Ore
R. A. Muriana1, E. Muzenda1, O. K. Abubakre2
1Chemical Engineering Department, University of Johannesburg, Johannesburg, South Africa
2Mechanical Engineering Department, Federal University of Technology, Minna, Nigeria
Email: mraremu@yahoo.com
Copyright © 2014 by authors and Scientific Research Publishing Inc.
This work is licensed under the Creative Commons Attribution International License (CC BY).
http://creativecommons.org/licenses/by/4.0/


Received 22 July 2014; revised 23 August 2014; accepted 31 August 2014
ABSTRACT
The kinetics of carbothermic reduction of manganese ore from Ka’oje deposit has been established. X-Ray diffraction analysis of the as-mined ore samples affirmed the presence of pyrolusite as the major manganese mineral in the ore, existing alongside with iron mineral present as hematite optically identified by transmitted infrared light microscopy. Samples with particles size ranges—106 µm were isothermally treated using charcoal of 52.17% carbon content as the reductant. The treatment was carried out at 550˚C, 600˚C, 650˚C and 750˚C with varied roasting retention time. Ore-mineral reduction kinetic model equations were developed using the generated thermal data. Results showed that the apparent activation energy (Ea) of the chemical reaction controlled reduction was 19.99 KJ/mole using the diminishing area rate equation. Obtained Ea values for diffusion controlled reduction of the ore-minerals were 36.28 Kj/mole and 29.56 KJ/mole using Jander and Ginsthing-Brounshtein equations respectively. These hereby established reduction susceptibility of the manganese oxide mineral from higher oxide to lower oxides meant for further hydrometallurgical treatments.
Keywords:Reductant, Pyrolusite, Frequency-Factor, Intercept and Tailings

1. Introduction
Paramagnetic higher oxide manganese minerals get reduced to ferromagnetic lower oxides when roasted in reducing environment [1] . Reduction reaction kinetics models the reaction stages and establishes reduction reaction parameters such as reduction rate, reaction frequency-factor and reaction apparent activation energy of the material undergoing reduction. In 2013, Ya-li et al. obtained 36.397 KJ/mole as the reaction Ea when low-grade manganese oxide ore was roasted in coal fluidized bed [2] . Effects of different roasting conditions of varied ore composition, roasting time, reductant content and roasting temperature could be studied while analyzing thermal data for reduction kinetics [3] and [4] . The work thereby subjected the paramagnetic Ka’oje manganese oxide ore [5] to carbothermic reduction under different reduction conditions using charcoal as the reductant. The reductants “A” and “B” (carbon-bearing materials) were thermally characterized in accordance to the American Society for Testing and Materials (ASTM) procedure D-1762-84. Reductant “A” has 6.50% moisture, 15.63% volatile, 0.43% ash and 77.33% carbon content [6] . X-Ray fluorescence (XRF), X-Ray diffractometry (XRD), Energy dispersed spectrometry (EDS), Scanning electron microscope (SEM) and Optical microscopy (OM) were all employed in the mineral characterization exercises. The reduction kinetics was studied and analyzed using Arrhenius, Jander and Ginsthing-Brounshtein equations.
2. Experimental
Obtained ore samples from Ka’oje were comminuted and screened to +335 µm, −355 + 300 µm, −300 + 212 µm, −212 + 150 µm, −150 + 106 µm and −106 µm particle size ranges. The mesh of ground (MOG) of the comminuted sample was used for the study. Thirty gram (30 g) lots of ore where thoroughly mixed with fifteen gram (15 g) lots of the reductant (2:1 ratio). Isothermal roasting at temperatures of 550˚C, 600˚C, 650˚C and 750˚C at roasting retention times of 2700 s, 3600 s, 5400 s, 6600 s and 7200 s was performed, while the weight loss was monitored with the help of laboratory digital balance. The Rigaku XRF machine operated at Rh 4.0 Kw, 24 Kv, 2 mA and temperature of 36.4˚C was used to determine elemental compositions of both as-mined MOG and treated (reduced) MOG ore samples. Quantitative analysis of the samples was further determined by generating and merging of XRD patterns under ore minerals authomatic and selective identifications. Further characterization of samples was achieved under reflected and transmitted light microscopy. SEM-EDS experimentation was used to study the ore-minerals morphology. Affirmation of reduction was further carried out using both bar magnet and lab-size Frantz magnetic separator operated at 0.15 Amp. Reduced manganese minerals were magnetic and got attracted by the magnetic field as concentrates while the unmagnetised portion came out as tailings. The reduction reaction rate depended on the contact area among the ore particles, carbon and oxygen [7] . As the reaction proceeded, virtually all the particle surface would get reduced; the reaction would then depend on diffusion of generated carbon oxide (CO) gas through the particle body. The overall reaction thermodynamically occurred as:
 (1)
(1)
where “M” is metal, which is manganese; “O” is available oxygen and “C” is carbon [8] .
Accordingly, the kinetics of earlier stage was analyzed using diminishing area Equation (2):
 (2)
(2)
where α = the removal rate of oxygen, k = reaction rate constant and, t = reaction time in seconds [9] .
The later stage of the carbothermic reaction was monitored using Jander and Ginsthing-Brounshtein diffusion model Equations (3) and (4):
 (3)
(3)
 (4)
(4)
All parameters remain the same [7] and [10] .
The ore reduction rate was calculated using Equation (5).
 (5)
(5)
where wcb and wca are carbon content in the sample before and after the reaction.
While mb, and ma are masses of sample before and after the reaction; wob = oxygen content of the sample before the reaction [7] .
3. Results and Discussion
3.1. Materials Analysis
Screen Test Results: Table 1 presents the screen test results of the as-mined comminuted ore samples showing −106 µm particle sizes as the MOG, while Figure 1 shows the relation between the particle sizes and cumulative percent undersize with mirrored cumulative percent oversize.
The MOG retained at 39.23 wt%. At sieve size 170 µm, the percentage undersize equaled the percentage oversize (50% - 50%), a guide for industrial comminution.
Composition Analysis: Mineralogical composition of the as-mined MOG sample is depicted by the XRD patterns (Figure 2) while the elemental composition as determined by the XRF is presented in Table2
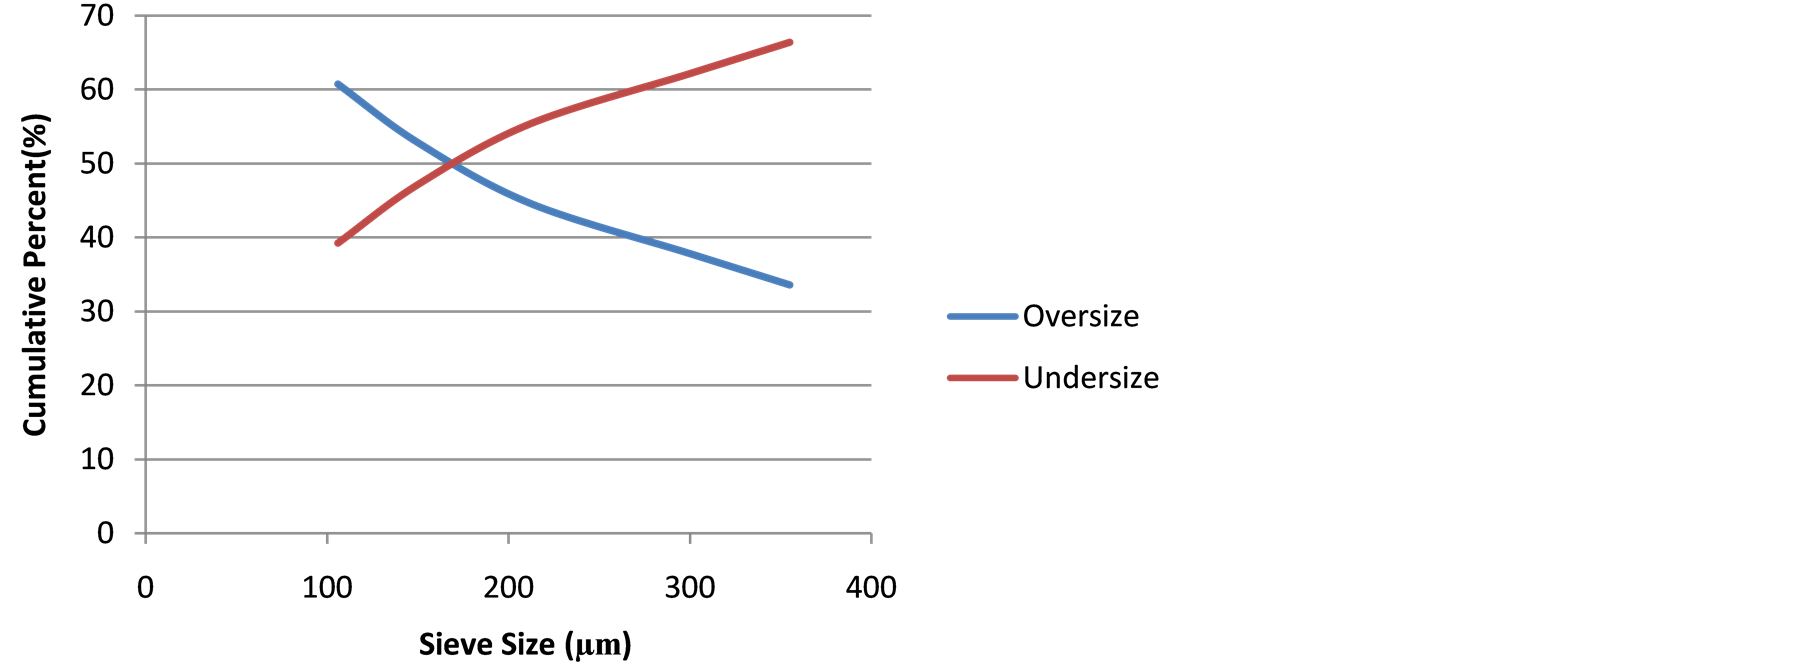
Figure 1. Particle size relationship with cumulative percent undersize/oversize.
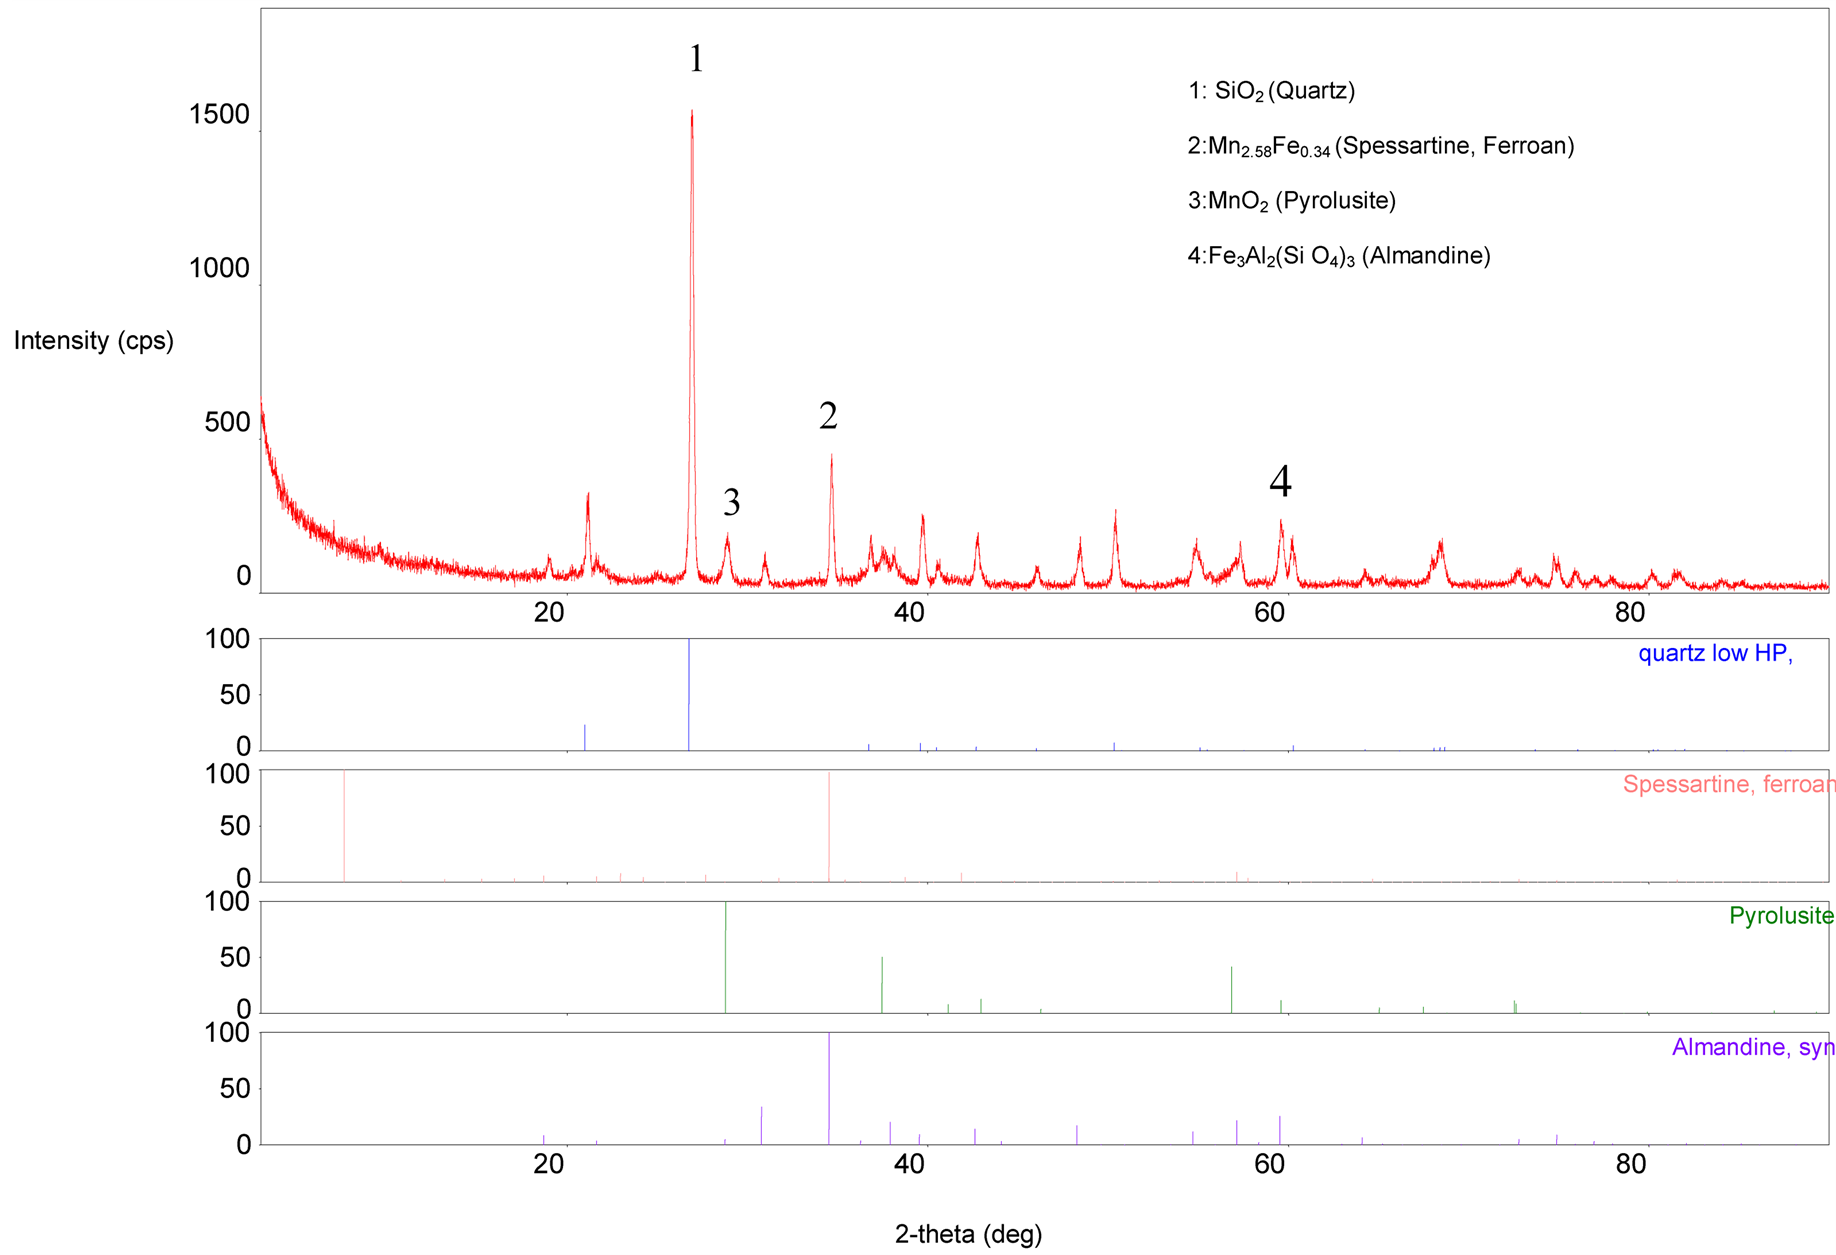
Figure 2. XRD analysis of the sample.

Table 1. Screen test results.
where “wt” is the mass of sieve fraction in gram and “% wt” is the percentage of the sieve fraction in the whole comminuted sample.
Table 2. XRF analysis of the sample.
Carbon Materials Analysis: The thermal test (proximate analysis) result of the carbon material “B” is presented in Table3
Primary patterns showed the presence of four different minerals. The XRD-weight ratio came out as 71.58% quartz, 0.05% spessartine ferroan, 10.87% pyrolusite and 17.49% synthetic almandine. The XRF results outlined more accurate percent composition of twenty one (21) elements present in the ore. Manganese and silicon are the major elements, while aluminium, calcium and iron are present as minor constituents. The remaining elements existed in traces. Further assertion tests on the true nature of manganese ore were displayed in the petrography, Figure 3. Hematite appeared with its characteristic reddish thin edges (Label “A”) under transmitted infrared light. Few quartz crystals, in grayish white (Label “B”), were embedded in oxide manganese minerals crystals which did not transmit light at all hence appeared black (Label “C”).
Ore Minerals Assemblage and Phase composition: The ore minerals morphology is revealed by SEM images (Figures 4-7) as EDS analysis established the phases elemental compositions (Figures 8-10).
Treated Sample Composition Analysis: Figure 11 shows the XRD pattern of the treated magnetic (concentrate) portion of the ore sample. Iron mineral was reduced from hematite (Fe2O3) to magnetite (Fe3O4). The diffraction intensity [11] of spessartine increased from 400 to 1773.7 cps as pyrolusite got reduced.
3.2. Reduction Reactions Kinetics
Reduction Rate Determination The plot of average of the reduction rate (Equation (5)) at different roasting time is shown in Figure 12. The reduction was zero at time zero, and it was fast up to the fifty minute after which it slowed down and maintained the slow pace reduction with very light and stabilizing rate to constancy as the reducible oxygen gets exhausted.
The values of rate constant, “k” using Equations (2), (3) and (4) and the respective natural log were calculated and presented in Tables 4-6.
The value of reaction rate constant “k” is given by Arrhenius equation as:
 (6)
(6)
where “A” = Frequency factor, “Ea” = Apparent activation energy in J/mol, “R” = Constant equal to 8.314 J/mol-K and T = Absolute temperature in Kelvin [12] .
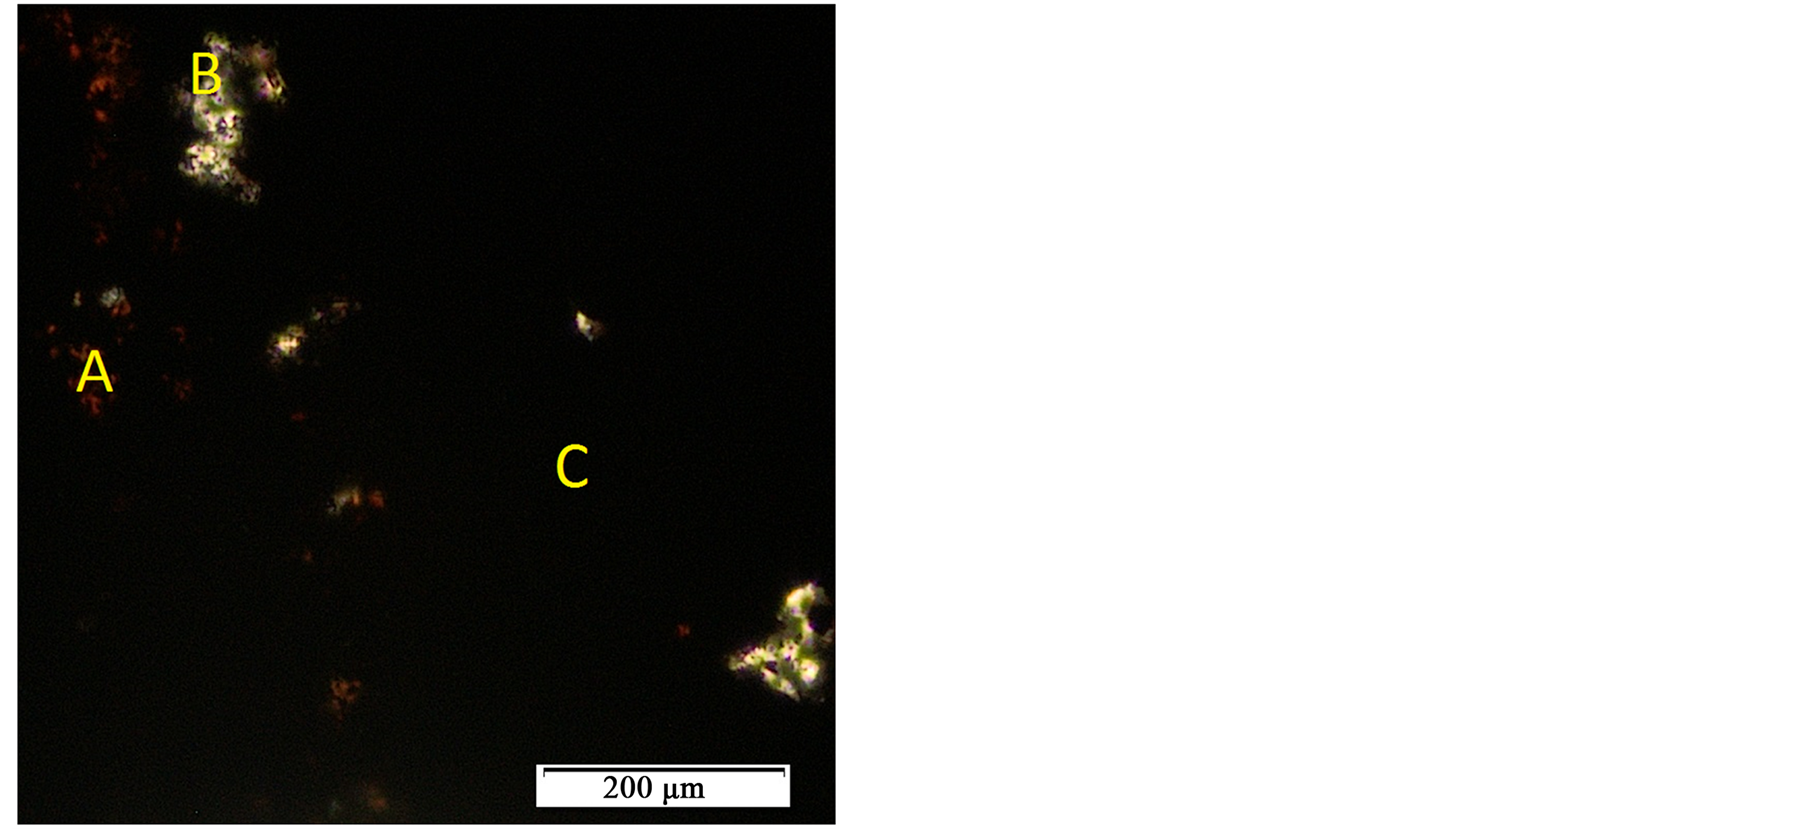
Figure 3. Transmitted light petrograph with dominant manganese oxide mineral (C) and reddish spots (A) of hematite. × 40.
Table 3. Proximate analysis of carbon material “B”.
Table 4. Rate constant values using Equation (2) at various temperatures.
Table 5. Rate constant values using Equation (3) at various temperatures.
Table 6. Rate constant values using Equation (4) at various temperatures.
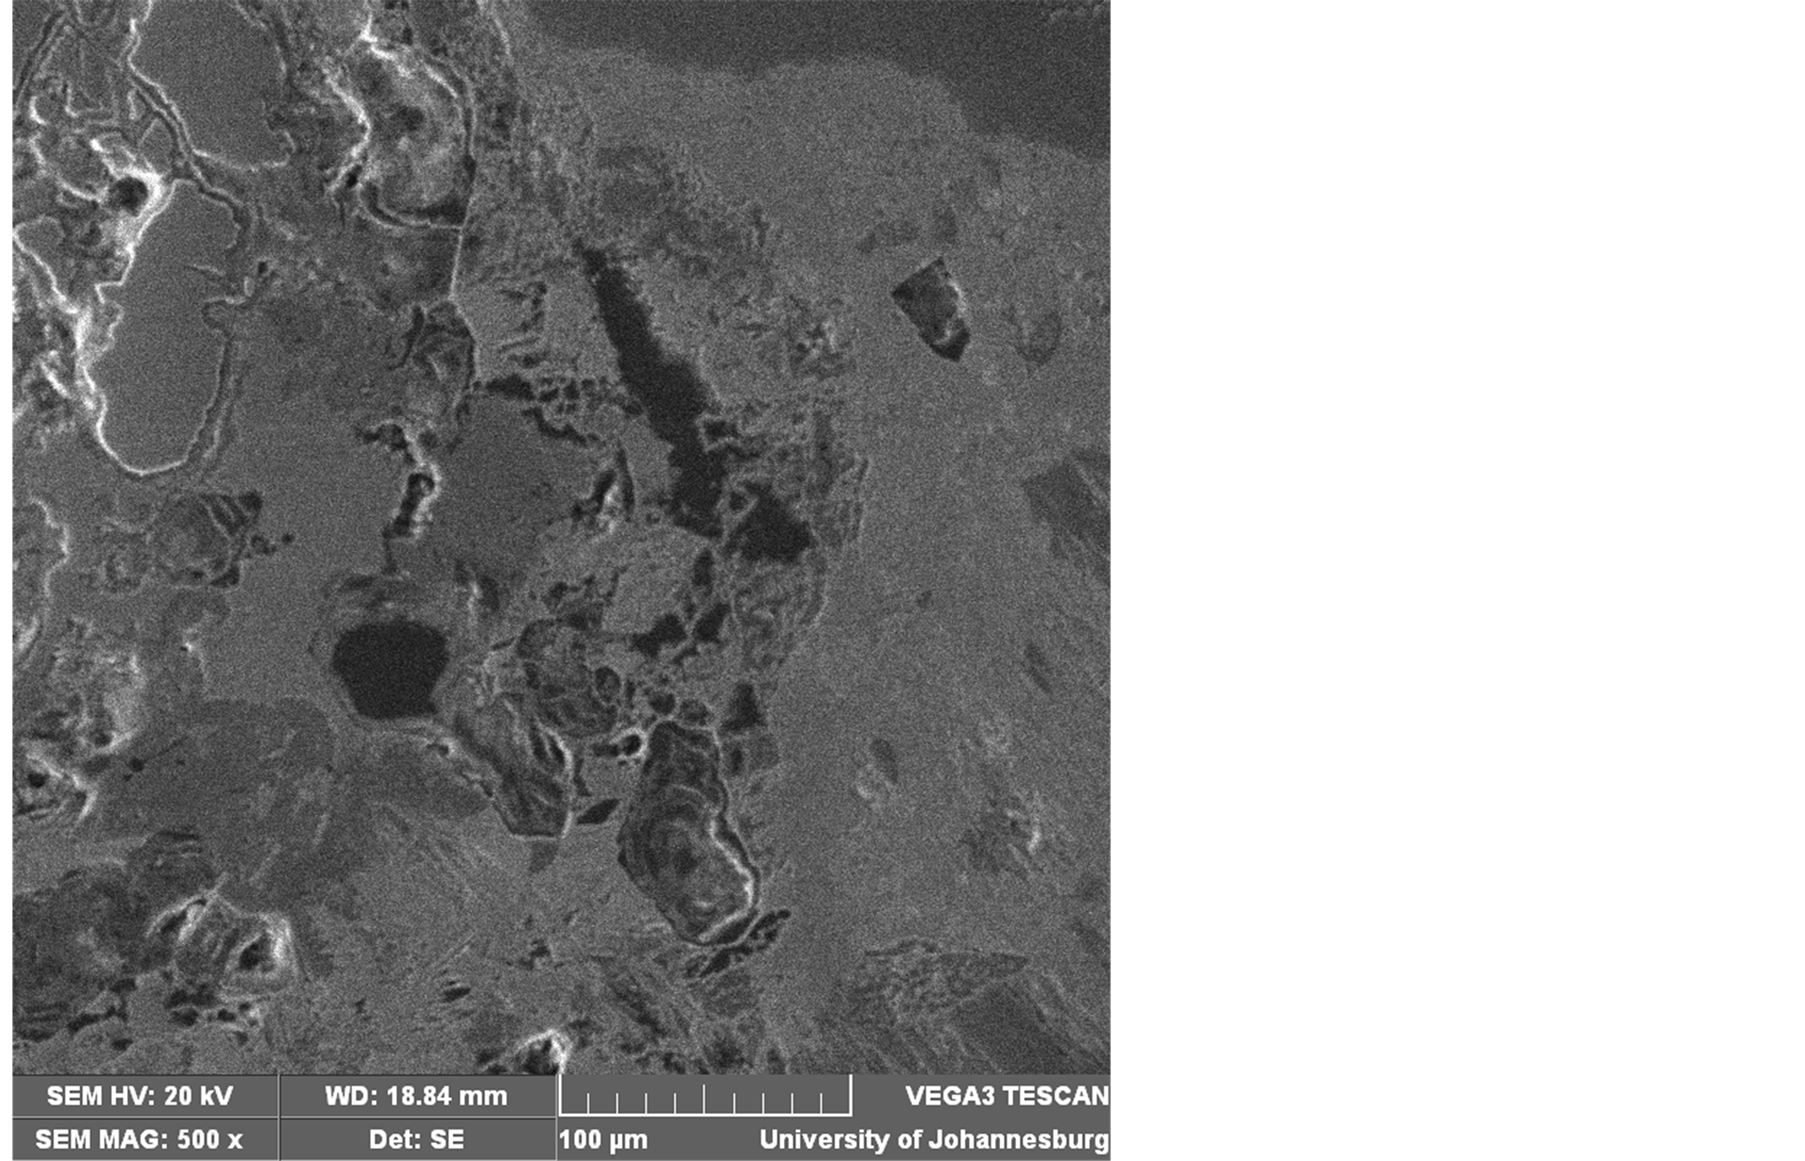
Figure 4. SEM image of the as-mined ore sample showing the minerals’ assemblage. × 500.
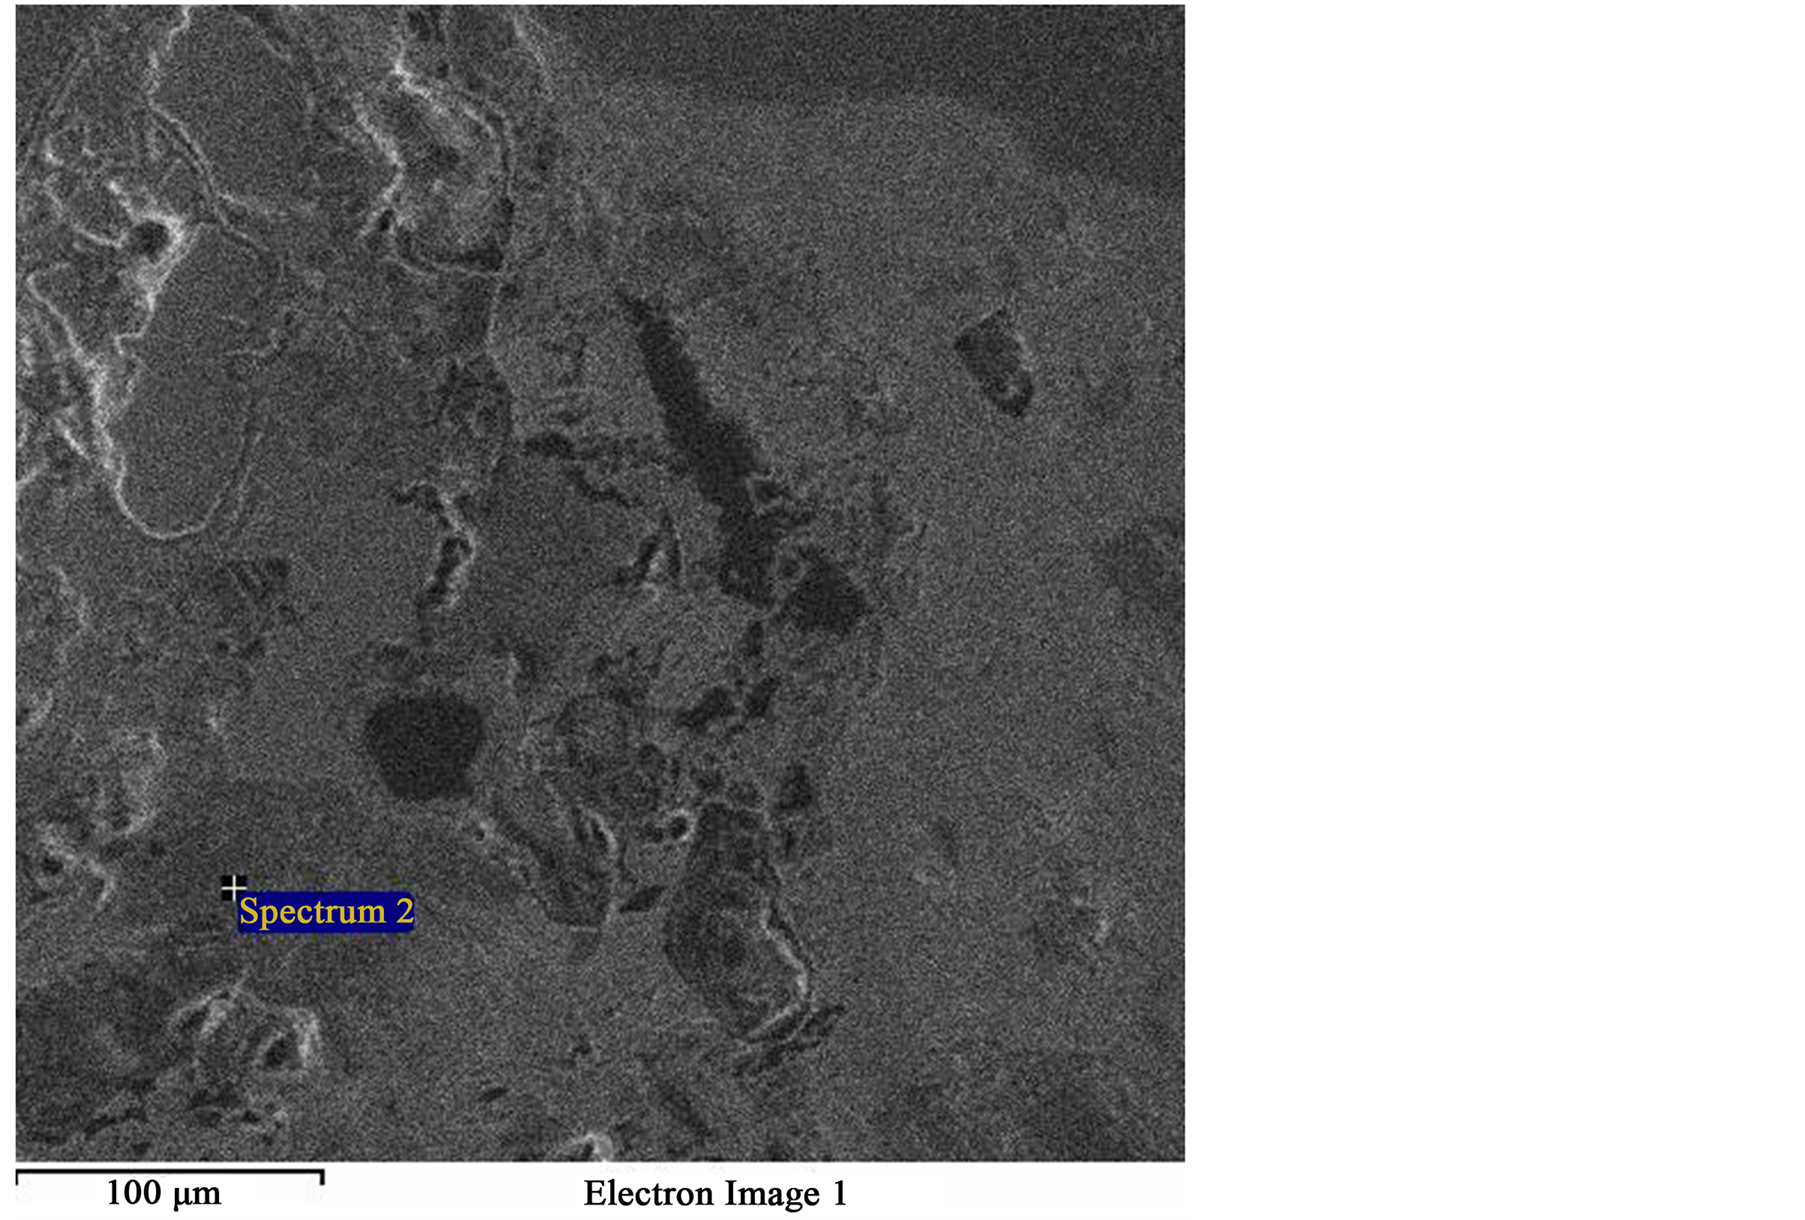
Figure 5. SEM image of same field as Figure 4 showing spectrum 2 (Light gray phase).
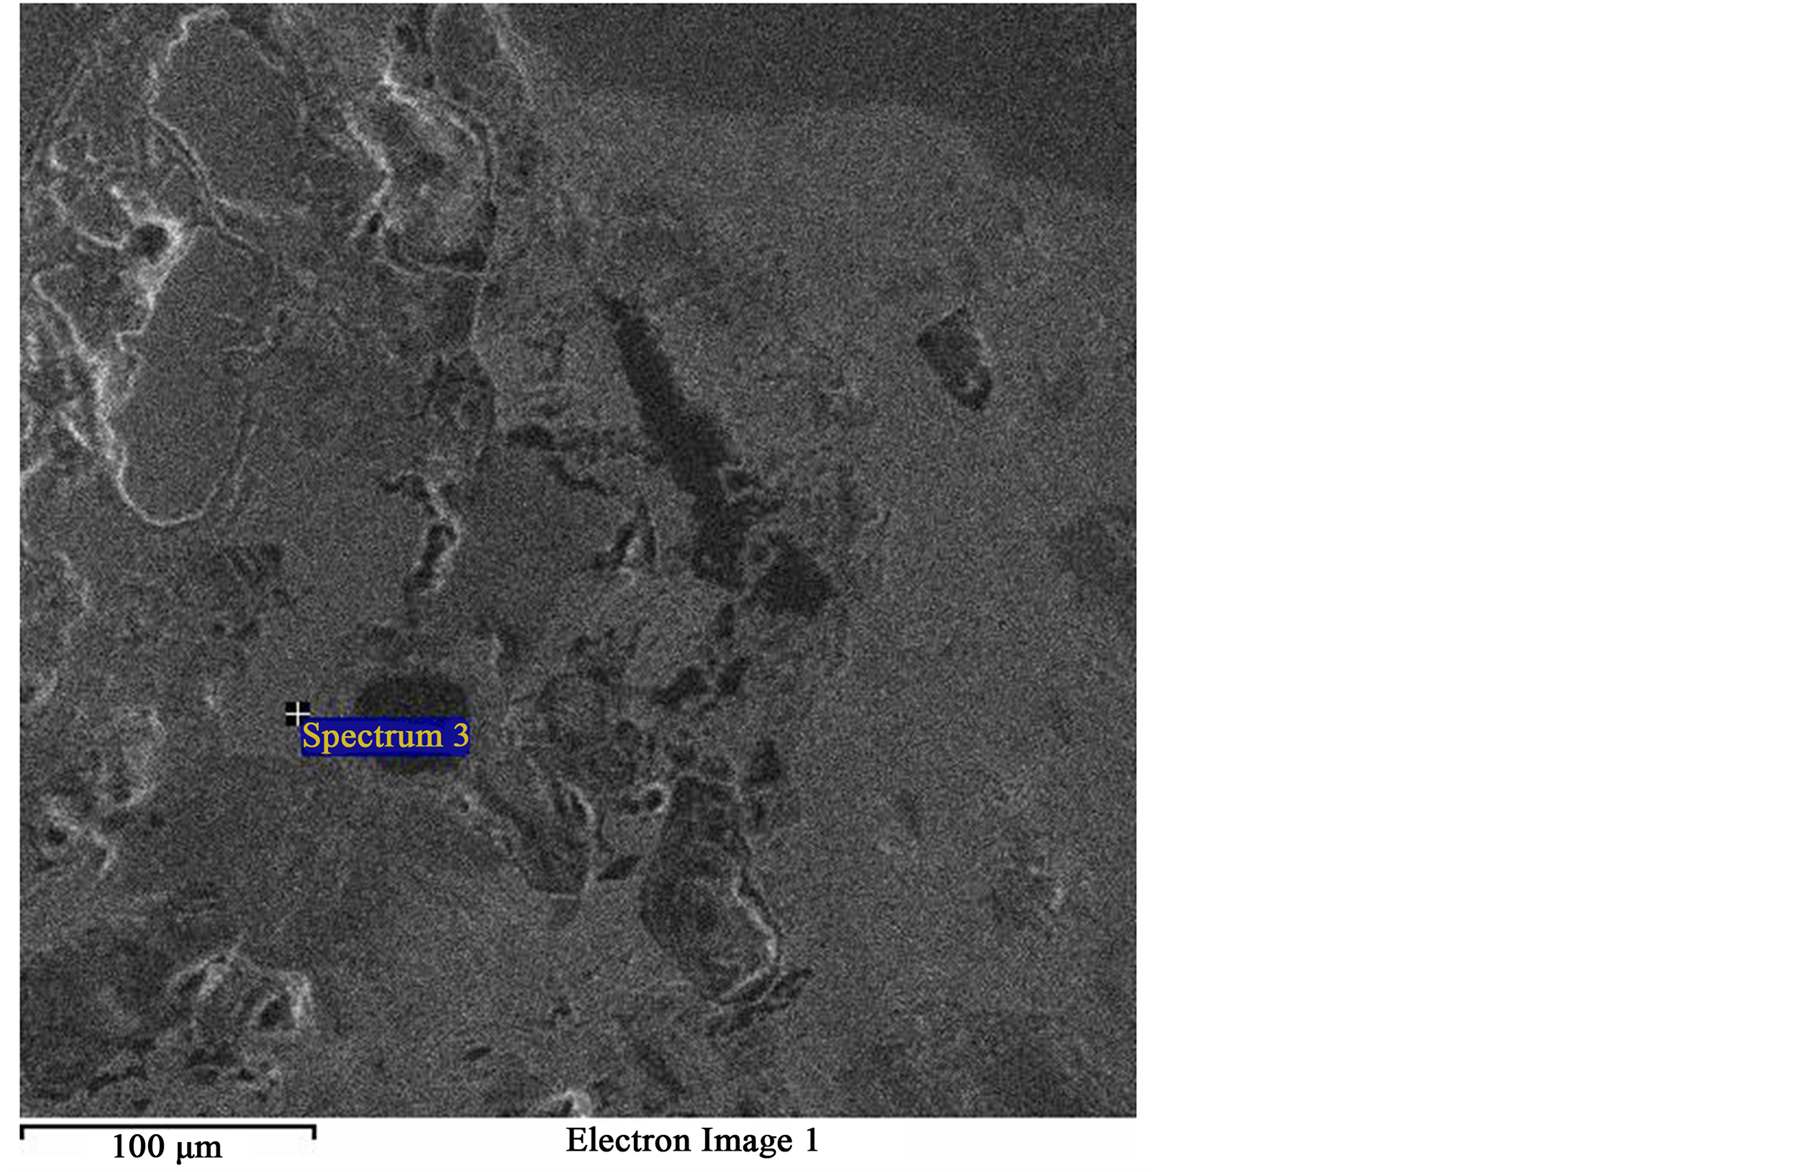
Figure 6. SEM image of same field as Figure 4 showing dominant spectrum 3 (Lighter gray phase).
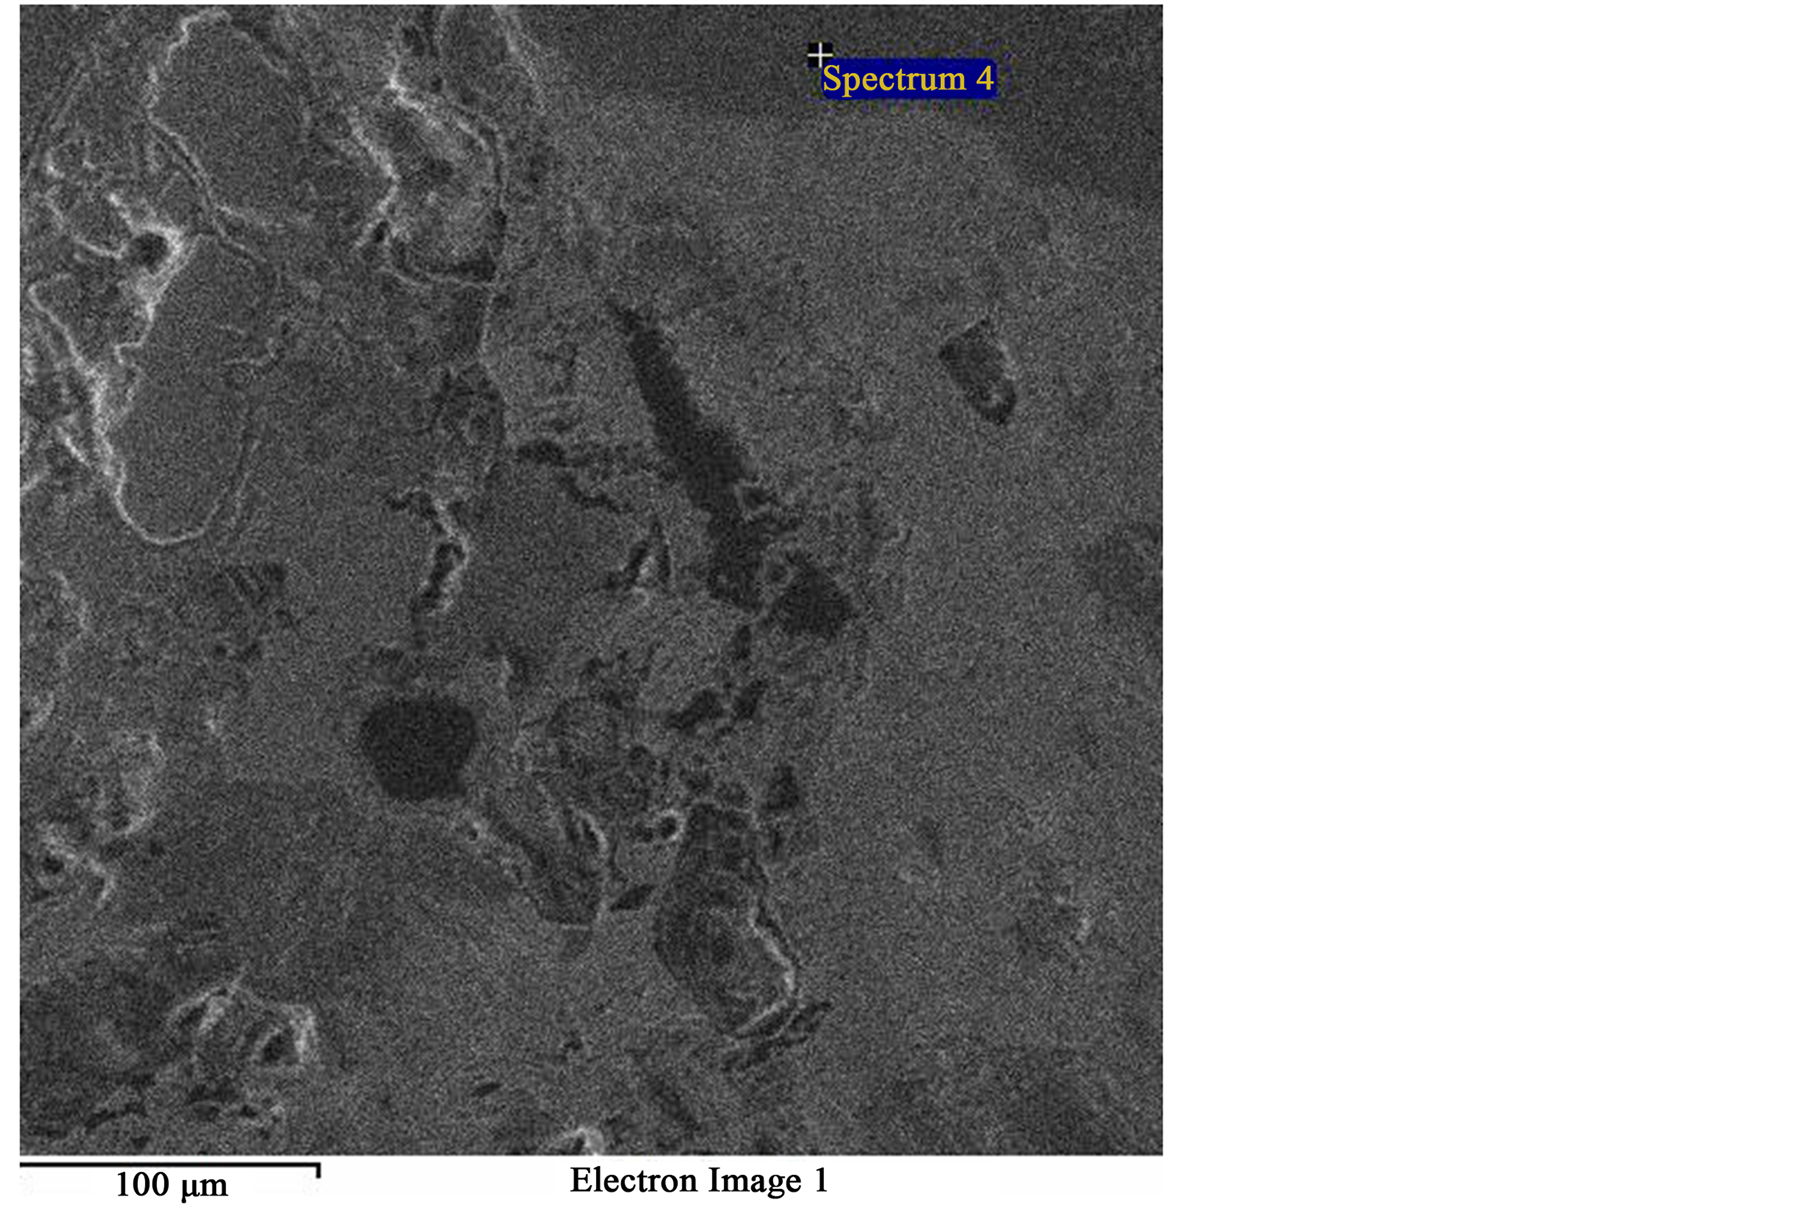
Figure 7. SEM image of same field as Figure 4 showing spectrum “4” (Dark phase).
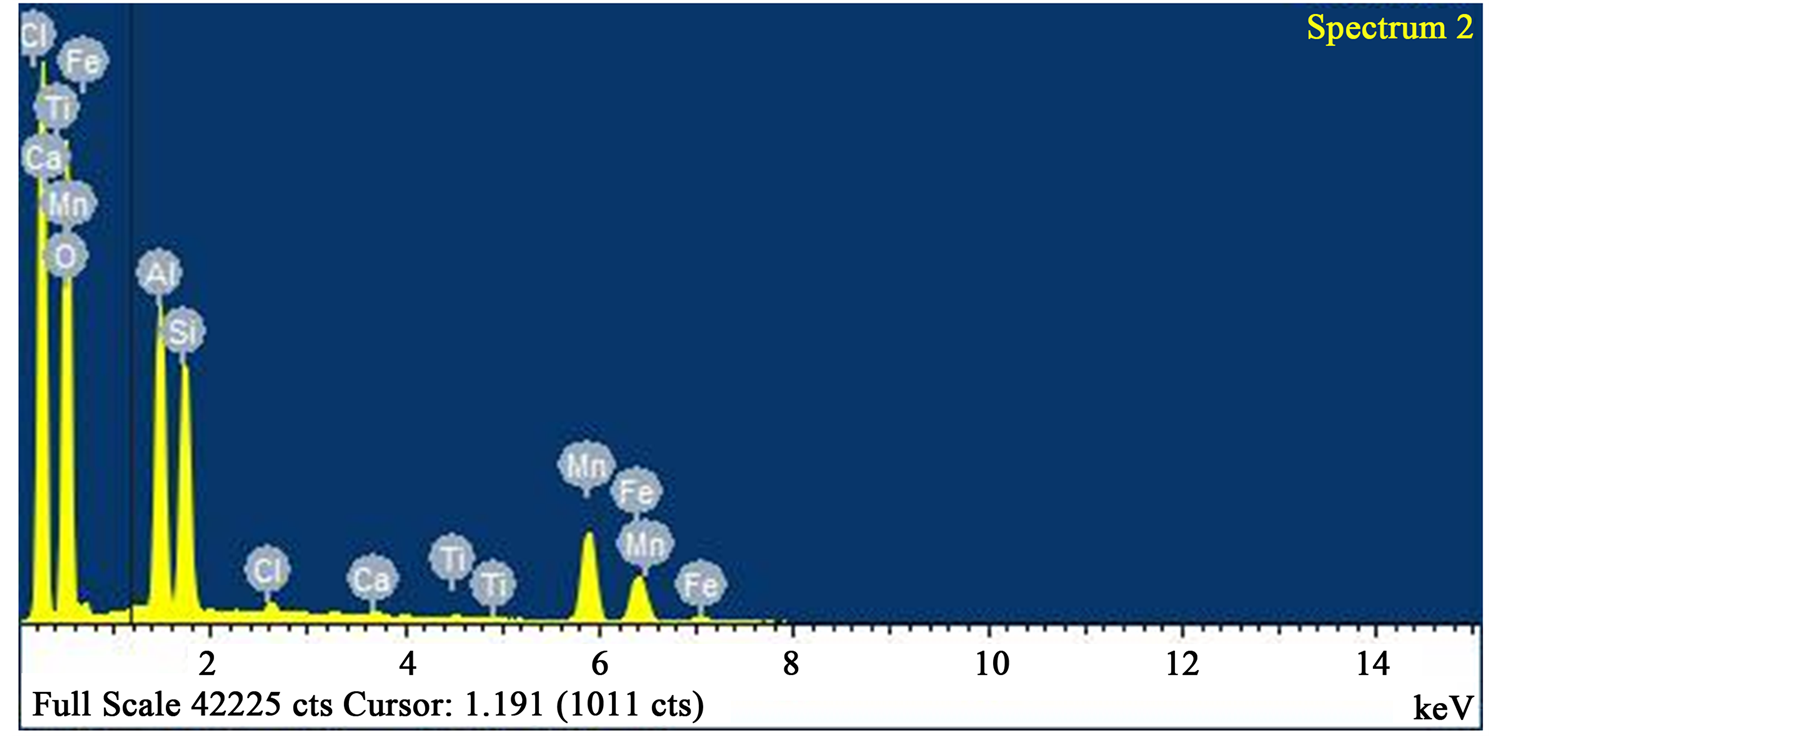
Figure 8. EDS analysis of spectrum “2”. Composition: 52.10 wt% oxygen, 13.30 wt% aluminium, 12.23 wt% silicon, 13.95 wt% manganese and 7.42 wt% iron.
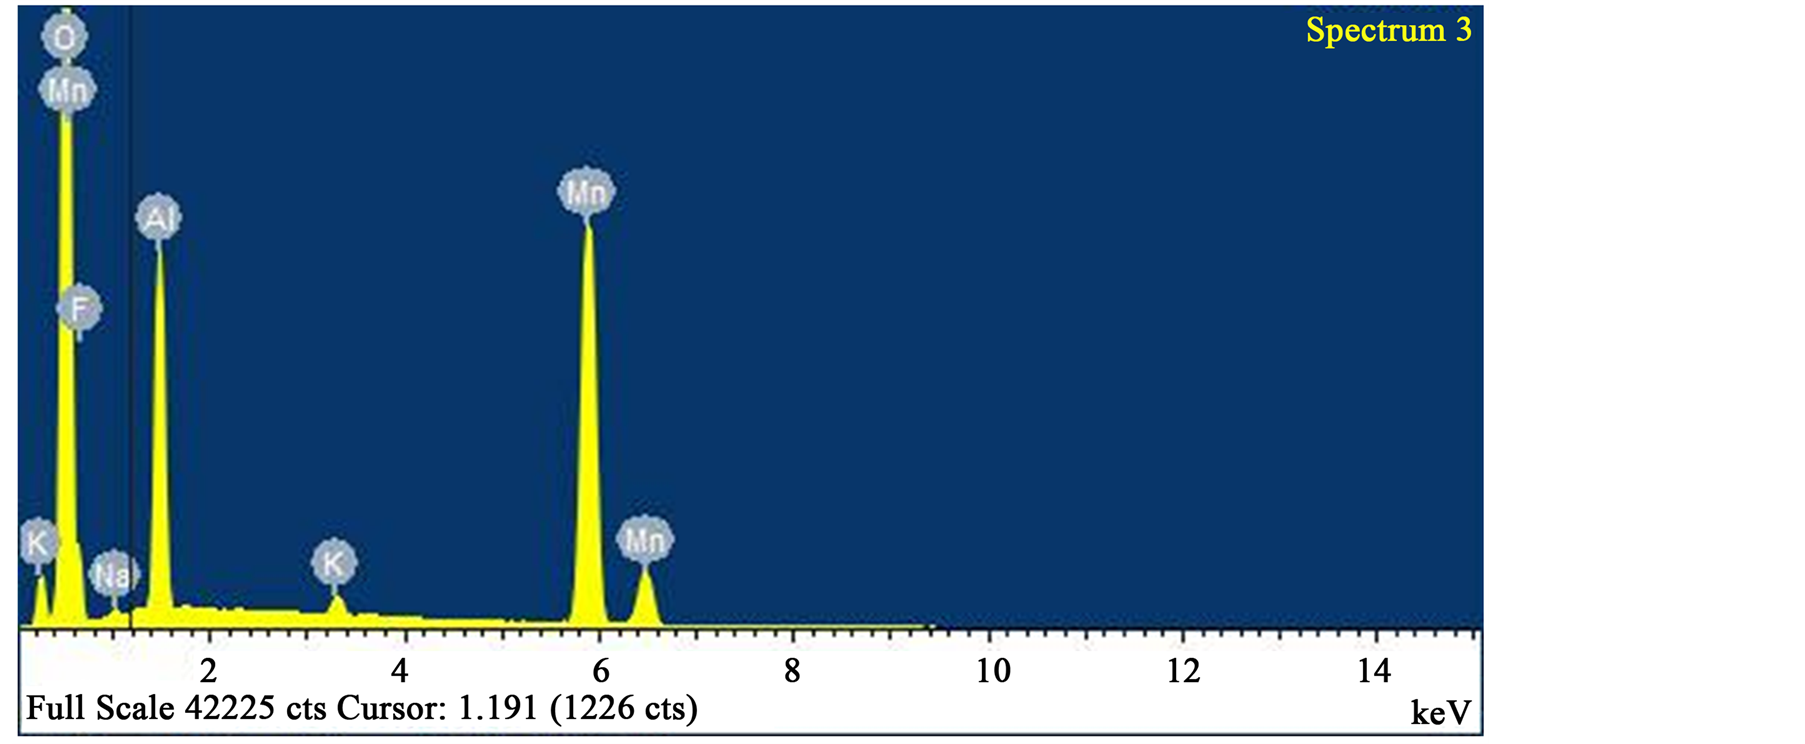
Figure 9. EDS analysis of spectrum “3” with 53.08 wt % oxygen, 33.92 wt % manganese, 9.57 wt % aluminium. Iron and silicon were absent.
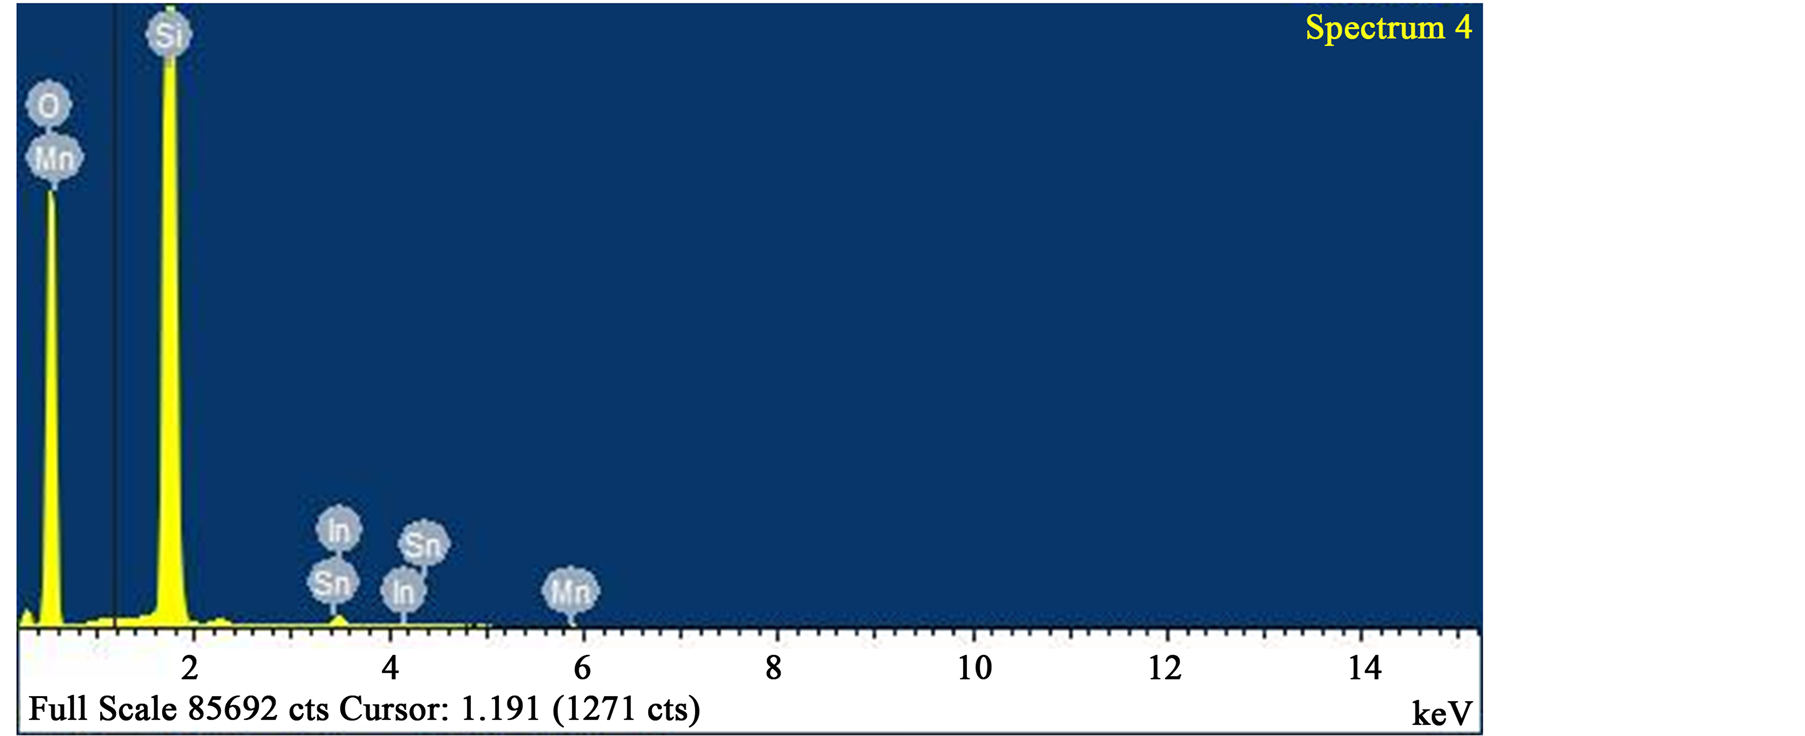
Figure 10. EDS analysis of spectrum 4 with 57.71 wt% oxygen, 0.14 wt% manganese and 41.14 wt% silicon. Alumunium and iron were absent.
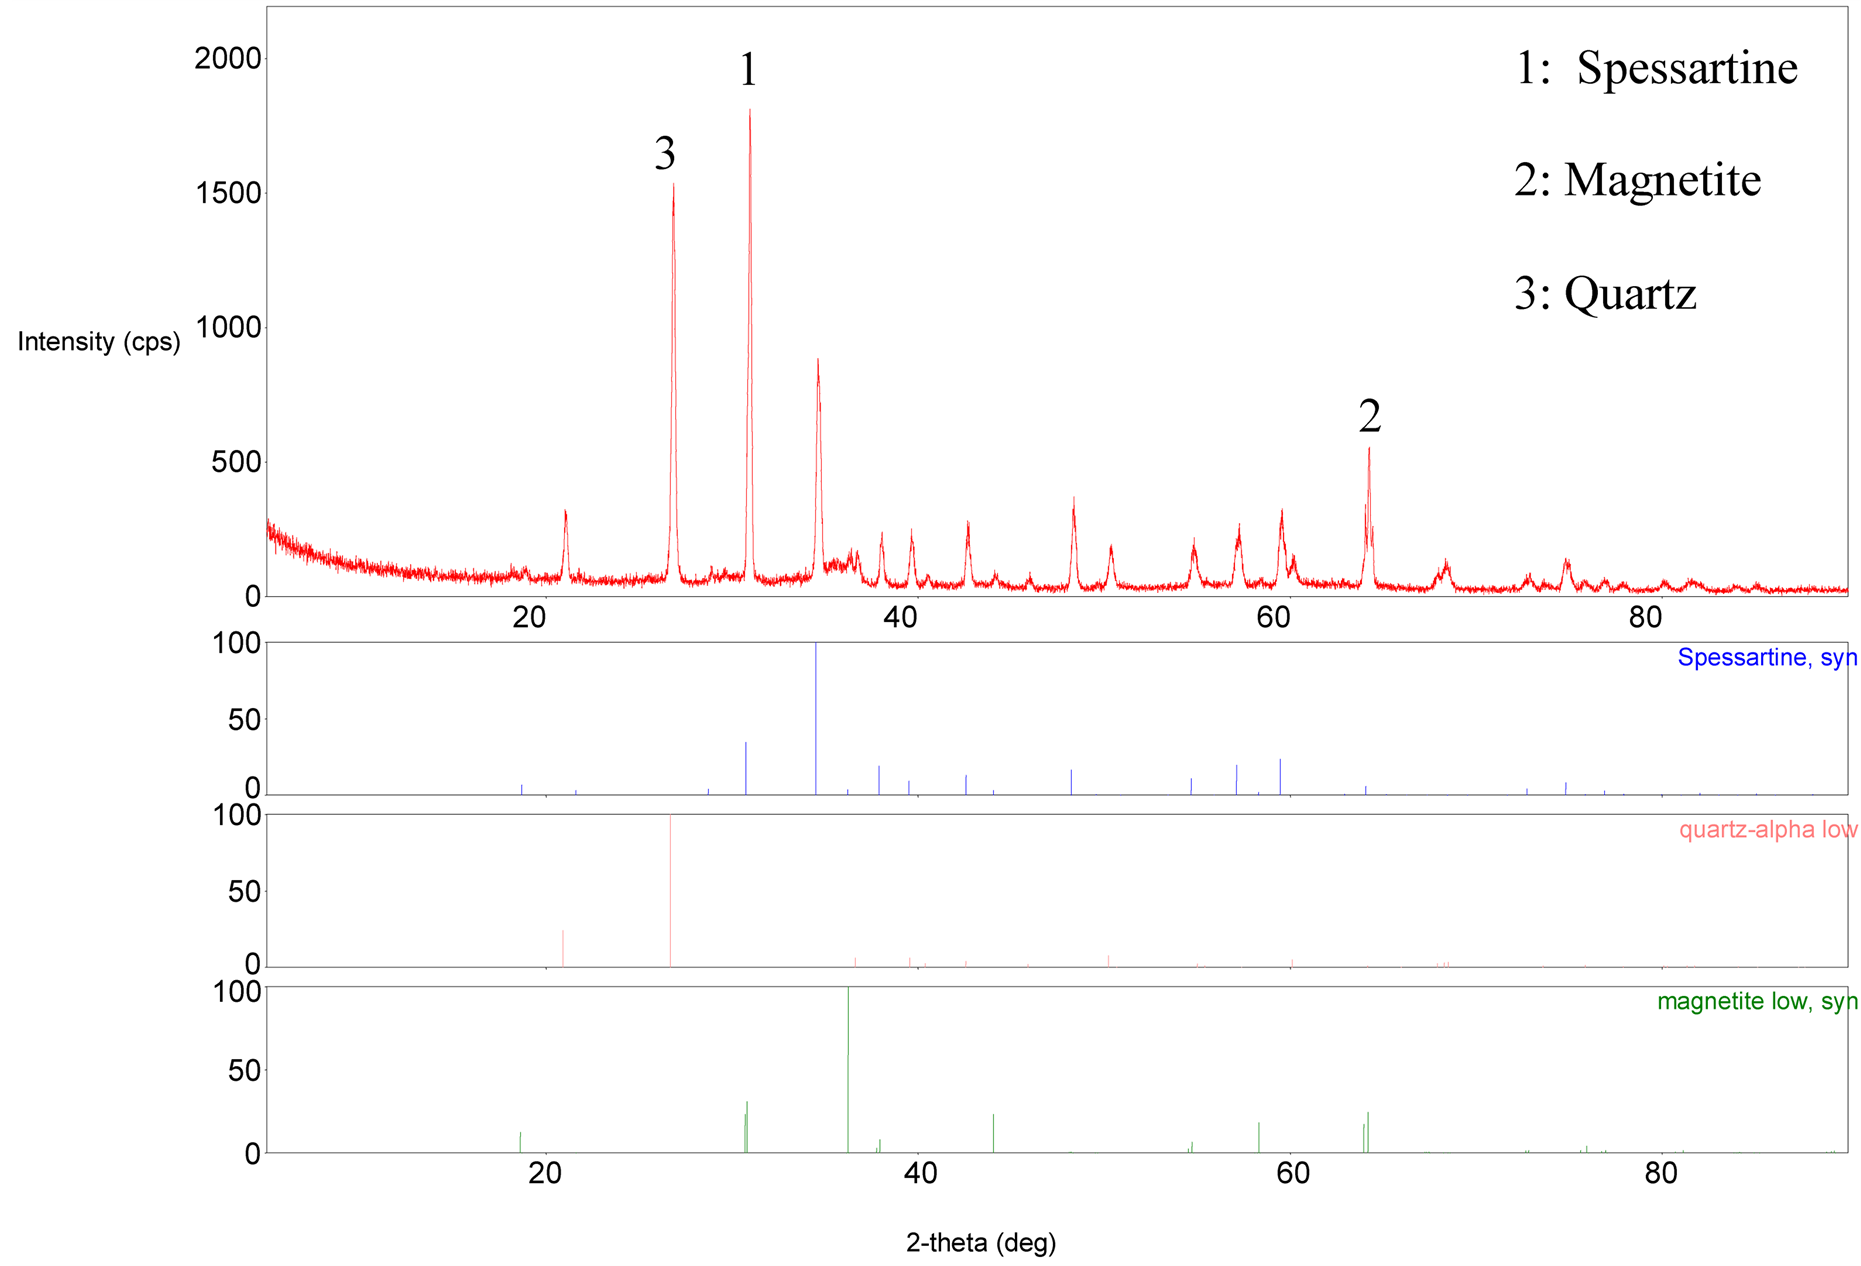
Figure 11. XRD pattern of the treated sample concentrate.
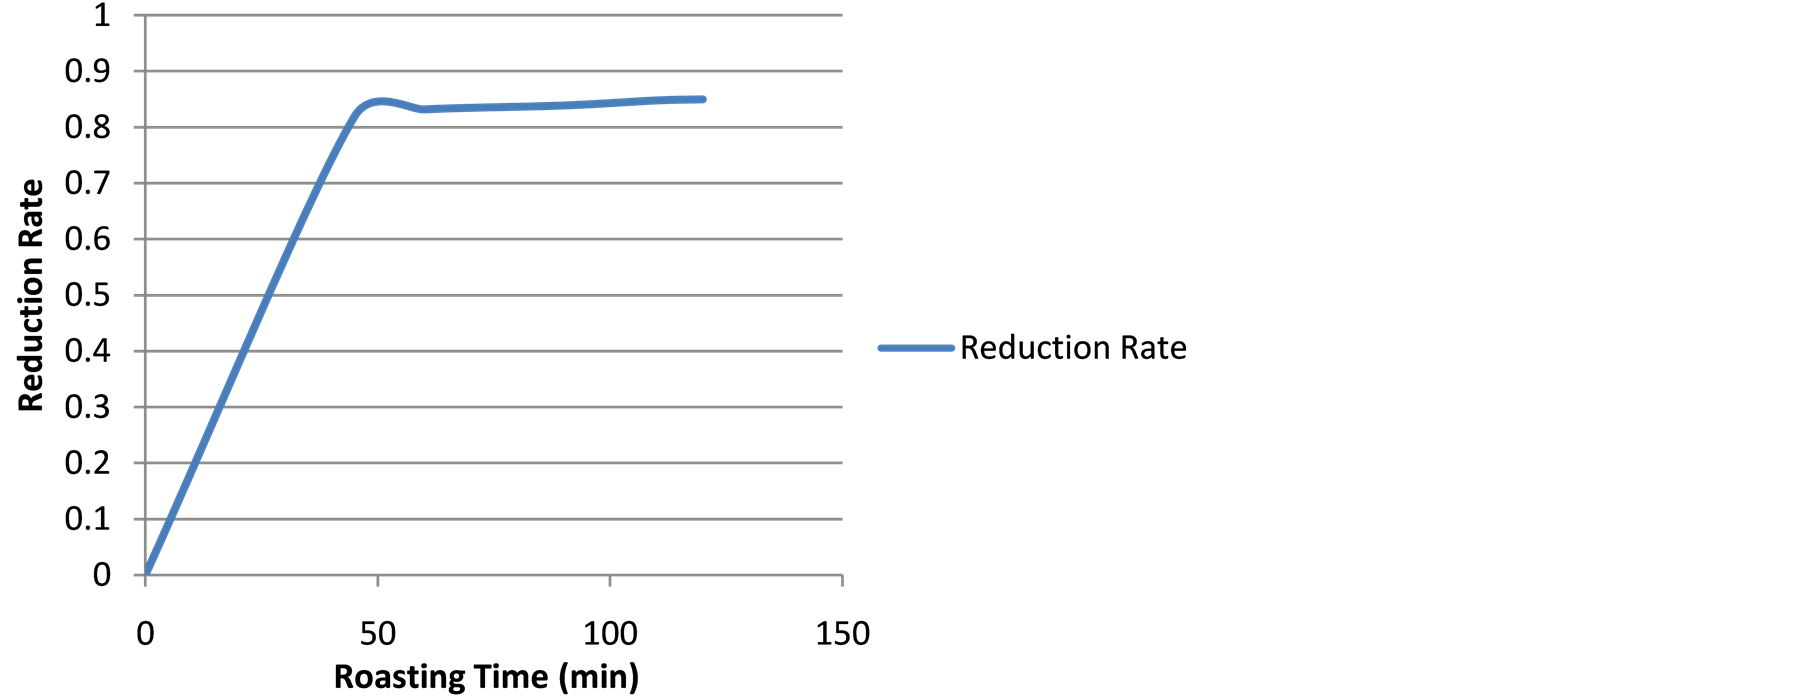
Figure 12. Average reduction rate-time curve.
From Equation (6),


A plot of inverse of “T” against “ln k” should give a straight line graph with “ln A” as intercept along “ln k” and  as slope. The values of “A” and “Ea” can then be calculated.
And the merging of Equations (2) and (6) gives Equation (7) thus:
 (7)
(7)
The plots of absolute temperature inverses against respective natural log values of rate constants are shown in Figures 13-15.
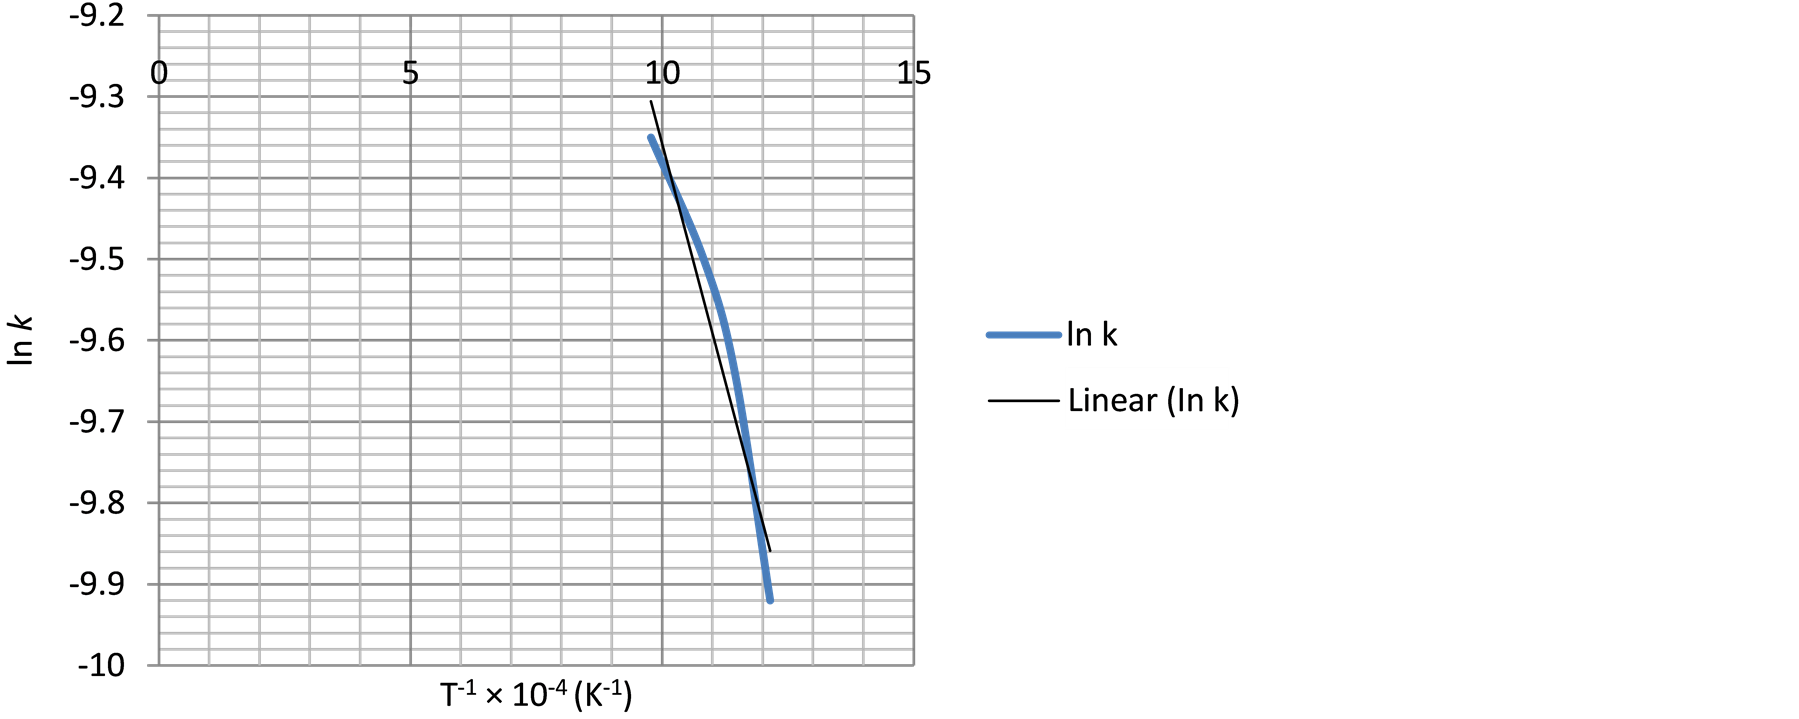
Figure 13. The relationship between temperature inverse and ln k using Equation (2).
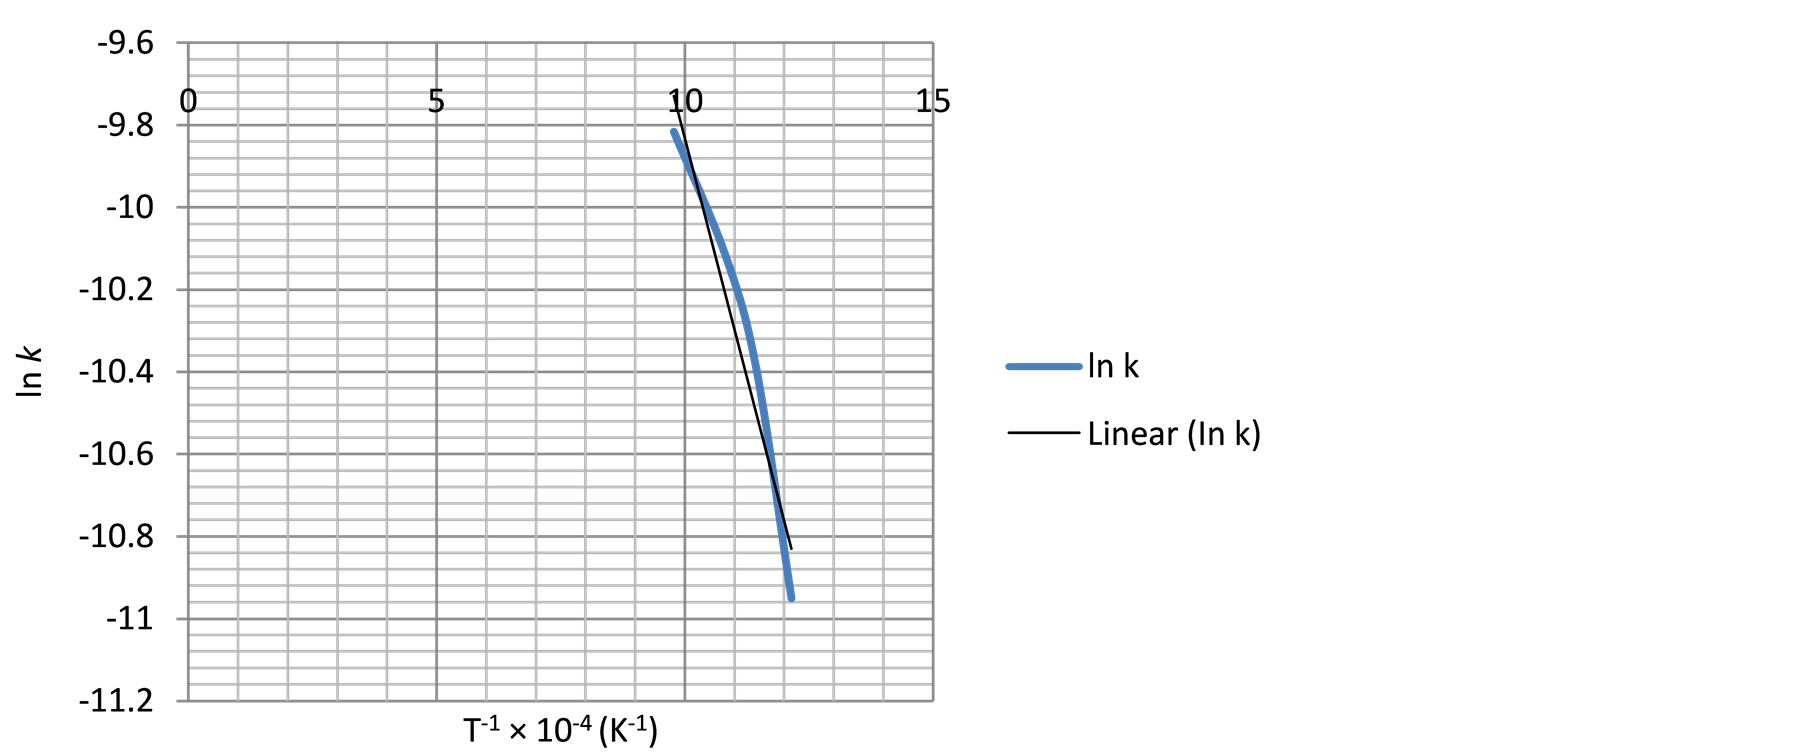
Figure 14. The relationship between temperature inverse and ln k using Equation (3).
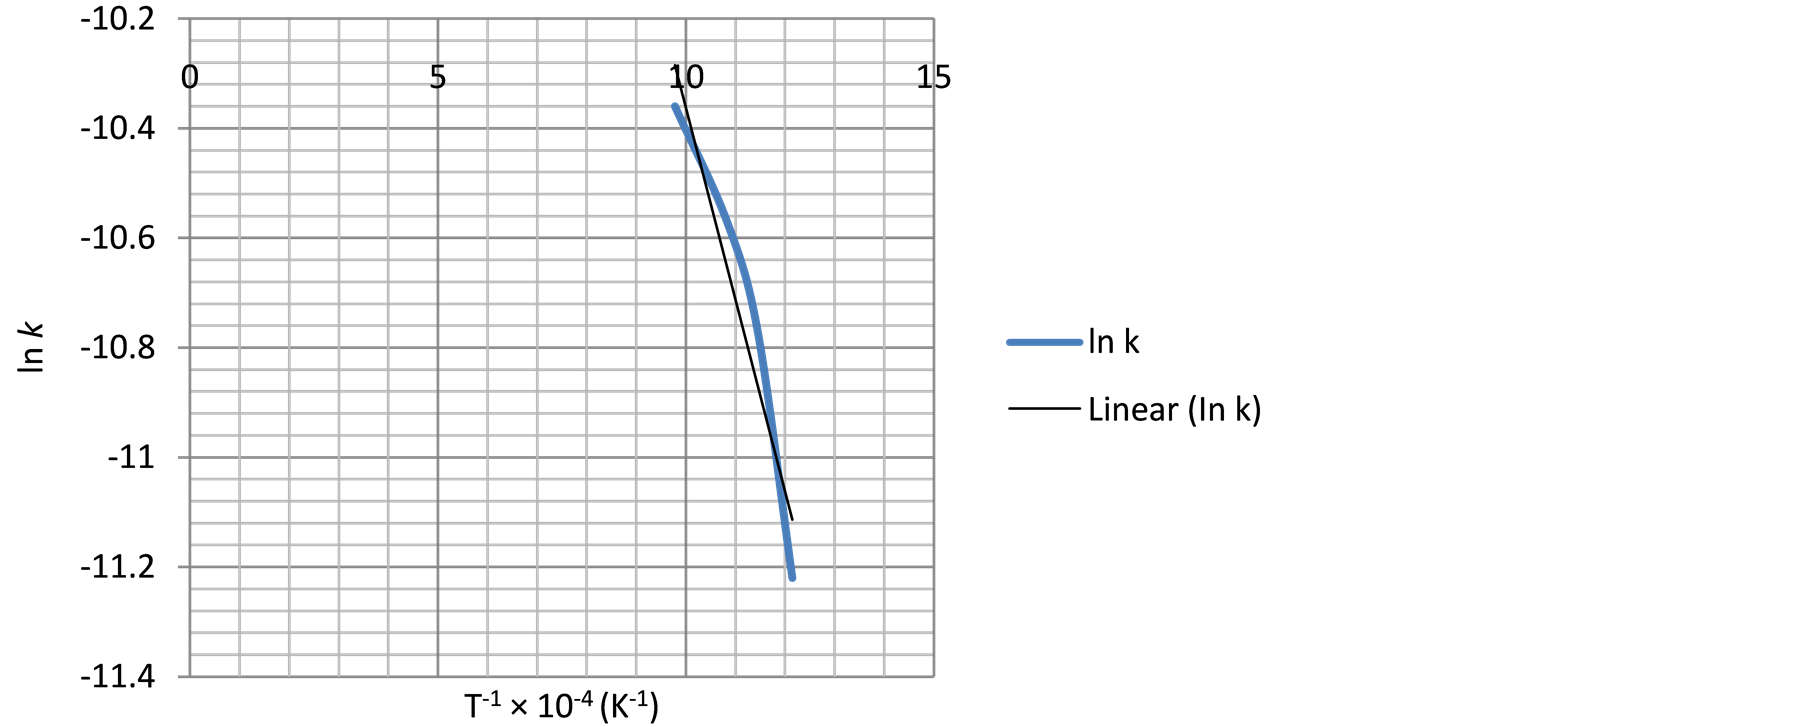
Figure 15. The relationship between temperature inverse and ln k using Equation (4).
The intercept along “ln k” in Figure 13 is (−7.0).
Therefore,


The slope of the graph is “−2404.37” therefore,


The ore-mineral reduction kinetic equation when chemical reaction controlled the kinetics is hereby modeled as:
 (8)
(8)
Similarly, the frequency factor, “A” and apparent activation energy, “Ea”, values from Figure 14 and Figure 15 are 0.005976 and 0.001136; 36279.27 J/mole (36.28 KJ/mole) and 29560.89 J/mole (29.56 KJ/mole) respectively. And the diffusion controlled reduction kinetic model equations are:
 (9)
(9)
and
 (10)
(10)
4. Conclusion
Carbothermic reduction could transform the higher oxide paramagnetic Ka’oje manganese ore-mineral to lower oxide ferromagnetic mineral. Reaction kinetic evaluation of the reduction processes showed apparent activation energy value of 19.99 KJ/mole for diminishing area condition, while 29.56 KJ/mole and 36.28 KJ/mole are apparent activation energy values for diffusion controlled condition using Ginsthing-Brounshtein and Jander equations respectively. The ore-mineral reduction kinetic equations are hereby established.
References
- Kothari, S.V. and Subramanian, N.A. (1993) Process for the Reduction Roasting of Manganese Ores and Device Thereof. United State of America (USA) Patent: 5270022.
- Feng, Y.-L., Cai, Z.-L., Li, H.-R., Du, Z.-W. and Liu, X.-W. (2013) Fluidized Roasting Reduction Kinetics of LowGrade Pyrolusite Coupling with Pretreatment of Stone Coal. International Journal of Minerals, Metallurgy and Materials, 20, 221-227.
- Li, J., Wang, L., Li, B.W. and Zhang, B.W. (2011) Kinetics of Reduction Roasting of Hematite to Magnetite in Crude Niobium Concentrate under Microwave Irradiation. Journal of Advanced materials Research, 201-203, 1714-1720.
- Anthony, M.P., Jha, A. and Tathavadkar, V. (2006) Alkali Roasting of Indian Chromite Ores: Thermodynamics and Kinetics Considerations. Manley Publishing. Journal of Mineral Processing and Extractive Metallurgy, 115, 71-79.
- Abubakre, O.K., Muriana, R.A. and Arogundade, A.I. (2010) Petrological and Mineralogical Characterization of Ka’oje (Kebbi State, Nigeria) Manganese Ores. Journal of Engineering Research, 15, 20-28.
- Muriana, R.A., Abubakre, O.K., Mudiare, E., Ndlovu, S., Issa, A.W. and Arogundade, A.I. (2013) Beneficiation of Ka’oje (Nigeria) Ferruginous Manganese Ore for Metallurgical Applications. Journal of Engineering Research, 18, 85- 96.
- Zhang, B., and Xue, Z. (2013) Kinetics Analyzing of Direction Reduction on Manganese Ore Pellets Containing Carbon. International Journal of Nonferrouse Metallurgy, 2, 116-120.
- Rankin, W.J. and Van Deventer, J.S.J. (1980) The Kinetics of the Reduction of Manganous Oxide by Graphite. Journal of the South African Institute of Mining and Metallurgy, 8, 239-247
- Manoj, K., Ranganathan, S. and Sinha, S.N. (2007) Kinetics of Reduction of Different Manganese Ores. Proceedings of Innovations in Ferro Alloy Industry INFACON XI Conference. New Delhi, February, 2007, 241-246.
- Byung-Su, K., Eun-Young, K., Chi-Kun, K., Hoo-In, L. and Jeong-Soo, S. (2008) Kinetics of Oxidative Roasting of Complex Copper Concentrate. Materials Transactions Regular Article, The Japan Institute of Metals, 49, 1192-1198.
- Sam, Z., Lin, L. and Ashok, K. (2009) Materials Characterization Techniques. Taylor and Francis Group, CPC Press, Boca Raton, 139-142.
- Kotz, J.C., Treichel Jr., P.M. and Harman, P.A. (2003) Chemistry and Chemical Reactivity. Thomson Books/Cole, United States.