Food and Nutrition Sciences
Vol.4 No.4(2013), Article ID:29738,7 pages DOI:10.4236/fns.2013.44049
Resting Energy Expenditure in a Controlled Group of Young Arab Females: Correlations with Body Composition and Agreement with Prediction Equations
![]()
1Human Nutrition Program, Department of Health Sciences, Qatar University, Doha, Qatar; 2Department of Mathematics, Statistics and Physics, Qatar University, Doha, Qatar.
Email: ahassan@qu.edu.qa
Copyright © 2013 Abdelmonem Hassan et al. This is an open access article distributed under the Creative Commons Attribution License, which permits unrestricted use, distribution, and reproduction in any medium, provided the original work is properly cited.
Received February 10th, 2013; revised March 10th, 2013; accepted March 17th, 2013
Keywords: Resting Energy Expenditure; Indirect Calorimetry; Body Composition; Young Arab Women
ABSTRACT
Objectives: To assess correlates of body compositions measures and resting energy expenditure (REE) in young Arab females, and to compare measured REE values with values calculated from REE predictive equations. Methods: Seventy nine healthy women, aged 18 - 30 years, were recruited for the study. All volunteers fasted for 8 hours, abstained from vigorous physical activity, smoking and caffeinated beverages for twelve hours before measuring body composition and REE. Resting energy expenditure was measured by indirect calorimetry and body composition was measured by a bioelectrical impedance analysis. Results: Measured-REE was significantly correlated with body fat mass, fat free mass, skeletal muscle mass, and soft lean mass (R2 ranges 0.498 - 0.592; p < 0.001). Fat-free mass had the highest correlation with measured REE (0.592). Resting energy expenditure predicted by Harris-Benedict equation was significantly higher (+90.2 kcal, p < 0.001), and REE predicted by Owen equation was significantly lower (−101.9 kcal, p < 0.001) compared to measured REE. Measured REE was not significantly different from REE predicted by either Mifflin equation or WHO/FAO/UNU equation (p > 0.05). Mean measured REE varied significantly with BMI (p < 0.001), but not with age or ethnic background. Conclusion: All body composition measures were significantly correlated with REE measured. Mifflin-St. Jeor equation showed the closest estimate to the measured REE in predicting REE of participants who had a normal weight or were overweight. Harris-Benedict equation significantly overestimated REE and Owen significantly underestimated REE.
1. Introduction
Resting energy expenditure (REE), also referred to as basic metabolic rate (BMR) includes energy spent in vital activities such as respiration, circulation, and energy consumed by the central nervous system. In general, REE accounts for 60% - 75% of the total energy expenditure (TEE). The major determinants of REE are age, gender, body size, and body composition. In addition, REE is highly sensitive to the level of hormones e.g. thyroid hormones, growth hormone, cortisol, and insulin [1]. Energy consumed by lean body mass, via the vital organs and the highly active skeletal muscles, accounts for the greatest proportion of REE consumed, whereas, the fat mass is less active metabolically and thus consumes much less energy [2].
Energy determination is of great importance in clinical dietetics practice and it is an essential component of nutritional assessment and accurate estimation of daily energy requirement and weight management. Resting energy expenditure can be either estimated or measured [3]. Direct calorimetry is the gold standard for accurately measuring REE, yet its use is limited since it is expensive, complex, making it unsuitable for use in a clinical setting. Indirect calorimetry have been developed, and validated against direct calorimetry, to measure energy expenditure by calculating the respiratory quotient (RQ) [4]. Estimation of REE by indirect calorimetry has been shown by many investigators to be practically identical to estimation of REE by direct calorimetry [5]. In clinical settings, energy expenditure is not routinely measured, instead, it is estimated using numerous REE predicting equations, such as Harris-Benedict’s [6], Mifflin-St. Jeor’s [7], World Health Organization/Schofield (WHO/FAO/ UNU’s) [8] and Owen’s [9]. Although these equations had been found valid for predicting REE in certain ethnic groups, many researches showed that it might not be reliable to apply to different ethnicities; especially, that a major determinant of REE, body composition, vary from one ethnicity to another [2,3].
Simple hand held REE measuring devices that are very convenient to use in a clinical settings are now available. These devices, designed to measure oxygen consumption, are lightweight, self-contained and some are battery operated. Many investigator reported the accuracy of these handheld devices in measuring REE compared to classically used indirect calorimetry measuring device e.g. Douglas bag [10]. The availability and future development of these products are thought to allow use of indirect calorimetry in clinical and subclinical settings; and to help developing ethnic specific equations for estimating REE.
To our knowledge, no studies on measured REE in Arab population groups has not been reported before. The objective of this study was to assess the possible association of measured REE with body composition measures and to compare the measured REE values with values predicted by the most commonly used REEpredictive equations in a controlled sample of young Arab females. In this communication we report our first findings of a larger study designed to determine accuracy of the most used REE predicting equations, and to develop and validate REE predicting equations for the Arab populations, that incorporate body composition measures such as fat free mass.
2. Methods
2.1. Participants
This study was conducted during the period of October 2011 to December 2011, among 79 young Arab females, aged 18 to 30 years from two broad ethnic groups, Arabian Gulf (Qataris, Bahrainis and Saudis) and Sham Region Arab population (Palestinians, Syrians, Lebanese and Jordanians). Participants were recruited by advertising posters, distribution of fliers, e-mails, and word of mouth. In addition to, a Facebook group was created for further announcements. All announcements emphasized the importance of following the study instructions prior to measurements. One hundred and thirty respondents showed interest to participate in response to the announcements. However, fifty one respondents did not meet one or more of the study selection criteria, and therefore were excluded. All participants included in the study signed informed consent forms after they received full written and verbal information about the study procedures. The study protocol was approved by Qatar University Internal Review Board.
2.2. Inclusion and Exclusion Criteria
Subjects were selected based on BMI (Less than 30 Kg/m2), health status (no diagnosed disease), age (18 - 30 years), gender (females) and ethnicity (Arab from Arabian Gulf or Sham Region countries). Respondents were excluded from participation in the study on basis of BMI (greater than 30 Kg/m2), ethnicities other than Gulf Arabian and Shami, male gender, age (younger than 18 and older than 30 years), diagnoses with chronic illnesses such as diabetes, hypertension, and heart diseases. Also, females on their menstruation period were excluded.
2.3. Subject Profile
The subject profile consisted of four main categories: demographic data (age, and nationality) as reported by participants, anthropometric and body composition measurements (BMI, waist circumference, body fat mass, fat-free mass, skeletal muscle mass, and soft lean mass), measured REE, reported physical activity pattern and the date of last menstrual period.
2.4. Anthropometric Measurements
Height was measured to the nearest 0.5 cm using a stadiometer fitted on a scale (Tanita Corporation, Tokyo, Japan) and weight was measured to the nearest 0.1 kg while participants stood straight barefooted with light clothing. BMI was calculated by dividing weight in kilograms by height in meters squared. Waist circumference was determined by placing the measuring tape halfway between the lowest rib and the top of the hipbone, roughly in the line of the belly button.
2.5. Body Composition and Indirect Calorimetry
Measurements of body composition and REE were conducted on consented participants in a laboratory between 8:00 - 11:00 AM, after a minimum of 12 hours of fasting. All individuals were asked to abstain from vigorous physical activity and exercise, smoking and caffeinated beverages for twelve hours before measuring body composition and REE.
2.6. Body Composition Analysis
A bioelectrical impedance analysis (BIA) device (inBody 720, Biospace, Seoul, Korea) was used to assess the body composition of the participants. Data was collected in the morning between 8:00 - 11:00 AM. All fasting participants confirmed following the study protocol and that they did abstain from vigorous physical activity and exercise, smoking and caffeinated beverages for twelve hours preceding showing up in the laboratory for measuring of their body’s composition and REE. Weight, height and personal information were entered to the device software. Following inBody 720 protocol, participants were asked to take off their shoes, socks, watches, bracelets, and any other heavy materials that may interfere with the measurement. According to the inBody 720 manual; each participant was asked to wipe off their feet’s sole, and hands with electrolyte tissue as any unclean feet or hands pads will affect the results of the measurements. Body composition data for each individual was recorded by the device in special printed sheets. The data collected for the study included body fat mass, fat-free mass, skeletal muscle mass, and soft lean mass.
2.7. Indirect Calorimetry
For clarification of terms we used the term resting energy expenditure to mean “the amount of energy used in 24 hours by a person who is lying at physical and mental rest, measured at least 8 - 12 hours after the last meal, in thermo-neutral environment that prevents the activation of heat-generating processes such as shivering”.
Indirect calorimetry was used to measure REE using Fitmate metabolic system (Fitmate, COSMED, Rome, Italy). The Fitmate is a small (20 × 24 cm) metabolic analyzer designed for measurement of oxygen consumption to calculate energy expenditure during rest and exercise. Nieman et al. conducted a validation study on Fitmate metabolic system and provided evidence that Fitmate is a reliable and valid system for measuring oxygen consumption and hence REE in adults [11]. The laboratory was kept under calm atmosphere, with appropriate temperature (22˚C - 25˚C) to ensure ultimate comfort to the participants. Fasting participants were asked to place an electrode belt in the area beneath the breast, and were requested to rest in the supine position for about 10 minutes. A disposable face mask was then worn and well-fitted into the face to assure the absence of any gas leakage. Participants were asked to stay calm and measurements were made when the steady state conditions were reached. Indirect calorimetry measuring procedure was run after entering all required basic personal information (ID, Name, Date of birth, weight and height). Finally, the obtained data was collected as a hard copy and soft copy on a computer software program.
2.8. REE Predictive Equations
The following four REE predictive equations were used to calculate participants REE using age, body weight (BW) and height (Ht) measurements;
The Harris-Benedict for women [6]:
REE = 655.09 + (9.56 × B (kg)) + (1.850 × Ht (cm)) − (4.67 × age in years);
Mifflin-St. Jeor for women [7]:
REE = 9.99 × BW (kg) + 6.25 × Ht (cm) − 4.92 × Age (years) − 161;
WHO/FAO/UNU for women 18 - 30 years [8]: REE = 14.7 BW (kg) + 496;
Owen for women [9]: REE = 795 + (7.18 × BW (kg)).
2.9. Statistical Analysis
Statistical analysis was performed using the software package “Statistical Analysis for Social Sciences” (SPSS, IBM Corporation, New York, USA; version 19). Descriptive statistics were used to describe demographic and body composition data. Results of body composition and REE measurements are expressed as mean, standard deviation (SD) or standard error of the mean (SEM) unless otherwise noted. Student t-test and analysis of the variance (ANOVA) were used to assess differences between mean values of measured and a predicted REE, and differences in REE between groups with different BMI, age and ethnicity. Tukey post-hoc multiple comparison was used to test significance of differences between means. Pearson’s correlation was used to assess the association between measured and predicted REE, and REE and body composition parameters. The level p < 0.05 was considered as the cut off value for significance.
3. Results
Participants demographic characteristics are presented in Table 1. Seventy nine participants completed the study and were included in the analyses. More than half of the total subjects (52 participants, 65%) were from different Arabian Gulf countries (AGC; Qatar, Bahrain, Saudi), and 27 participants (35%) were from the Sham Region populations (Palestinians, Syrians, Lebanese and Jordanians). Twenty participants were 18 - 19 years old, thirty were 20 - 21 years old, and twenty-nine were 22 - 30 years old; representing 25.3%, 38.0%, and 36.7% of the total number of participants, respectively. All participants were free from chronic diseases. Table 1 also shows results of anthropometric and body composition measurements obtained from the BIA device (inBody 720) of all participants. Mean waist circumference (WC) was 68.97 cm, mean BMI was 22.67 kg/m2, mean body fat mass was 20.02 kg, and mean fat free mass for all participants was 37.31 ± 3.89 kg. The mean waist circumference and the mean BMI were within the normal ranges (WC < 88 cm, BMI within 18.8 - 24.9).
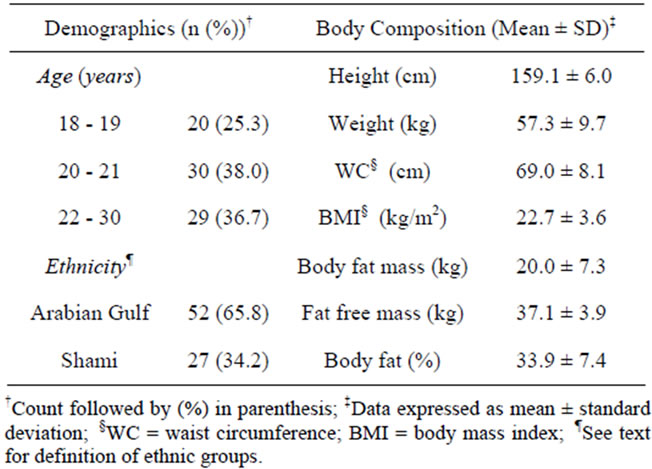
Table 1. Demographic characteristics and body composition data.
Table 2 shows that measured-REE was highly correlated with body composition parameters of all participants. Fat-free mass and soft lean mass had the highest correlations with measured REE (R2 = 0.596, R2 = 0.592, respectively). Correlations of measured REE with all body composition parameters were highly significant (p < 0. 001).
The correlations of measured REE with each of the four predictive equations, and the correlations between the four predictive equations, are presented in Table 3. The correlation coefficients (R2) between measured REE and predicted-REE derived from Mifflin-St. Jeor, Owen, Harris Benedict, and WHO/FAO/UNU equations were 0.618, 0.615, 0.619, and 0.615, respectively. Correlation coefficients between predictive equations (0.945 - 0.998) were higher than correlation coefficients of each predictive equations with the measured REE (0.615 - 0.619).
The mean measured REE and predicted REE and the differences (in Kcal) between the mean measured REE and predicted REE are presented in Table 4. For all participants, the mean measured REE was 1308.4 Kcal/day. The mean predictedREE by Harris Benedict equation (1398.5 Kcal) was significantly higher (p < 0.001) compared to the measured mean REE, and the mean REE predicted by Owen equation (1206.5 Kcal) was significantly lower (p < 0.001) than the measured REE mean. Mean REE predicted by the WHO/FAO/UNU equation (1338.5 Kcal) and that predicted by Mifflin equation were not significantly different (p = 0.065, p = 0.616, respectively) from the measured REE mean.
The variations of measured mean REE and means of REE predicted by the four equations with BMI, age and ethnic back ground are shown in Table 5. There was no significant difference between measured and REE predicted by the four equations among underweight participants (BMI < 18.5). For normal weight participants (BMI
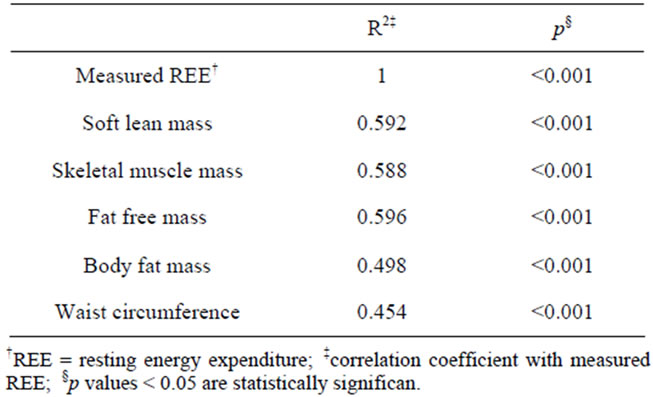
Table 2. Pearson correlation coefficients for measured REE and body composition measurements.
= 18.6 - 24.9), the Harris-Benedict equation significantly overestimated REE (1372.3 Kcal), and the Owen equation significantly underestimated REE (1187.9 Kcal) compared to the measured REE (1288.4 Kcal, p < 0.001). The Owen equation also significantly underestimated REE (1280.5 Kcal) of overweight participants (BMI = 25.0 - 29.9) compared to measured REE (1413.6 Kcal, p < 0.001). No significant differences were observed between measured and REE predicted by the four equations in participants categorized in different age groups (p = 0.416) or ethnic background (p = 0.777).
4. Discussion
The importance of determining individuals’ energy needs accurately and reliably had always been a cornerstone in the dietetic practice. Today, especially with the current obesity epidemic reported in different populations around the world, accurate determination of REE is highly required for appropriate planning of individualized nutrition care. Tools that were available before the turn of the century for measuring REE in clinical setting, e.g. traditional indirect calorimeters, are of limited use because of high cost, time spend to complete the measurement and technical expertise needed to operate these equipment. Traditional equations for estimating REE have been recently criticized and many investigators had shown that most of these equations do not correctly estimate REE for different ethnic groups and for obese individuals [12-14]. Recent advances in technology made it possible to develop portable, inexpensive and easyto-use accurate devices for measuring REE that do not require a specific laboratory setting or trained technologists to operate them. The recent decade had also witnessed much progress in the technology needed to manufacture reliable bioelectric impedance (BIA) devices that are portable, inexpensive, easy-to-operate and can provide more accurate measures body composition components. In this study we used the Cosmed’s Fitmate,
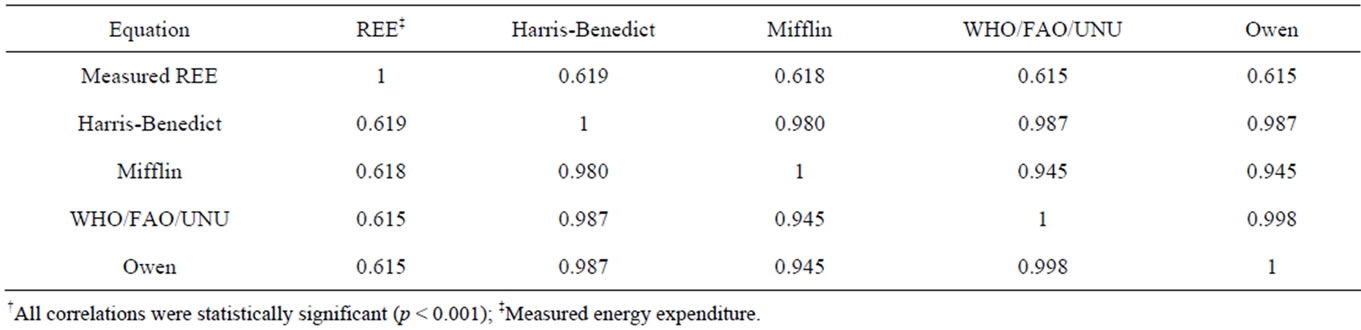
Table 3. Pearson correlation coefficients for measured and predicted REE†.
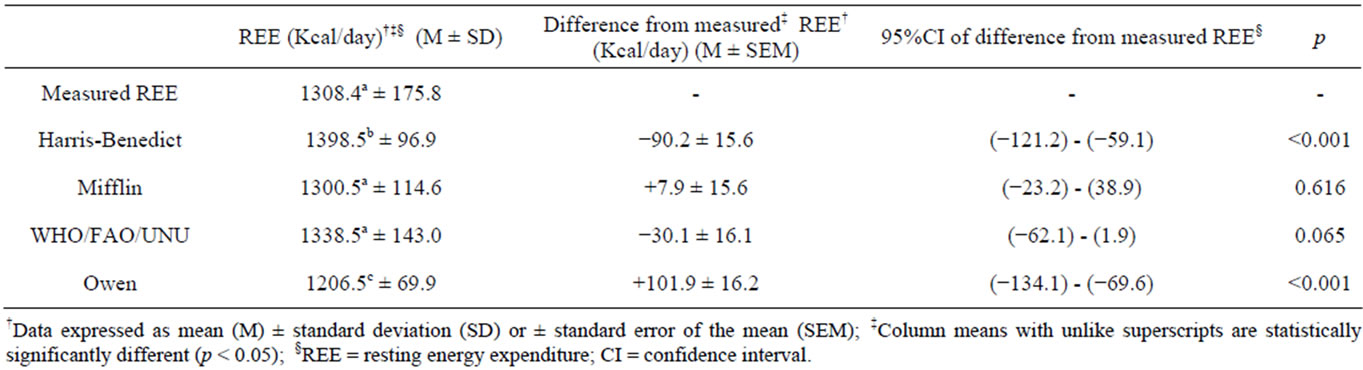
Table 4. Comparison of predicted and measured resting expenditure.
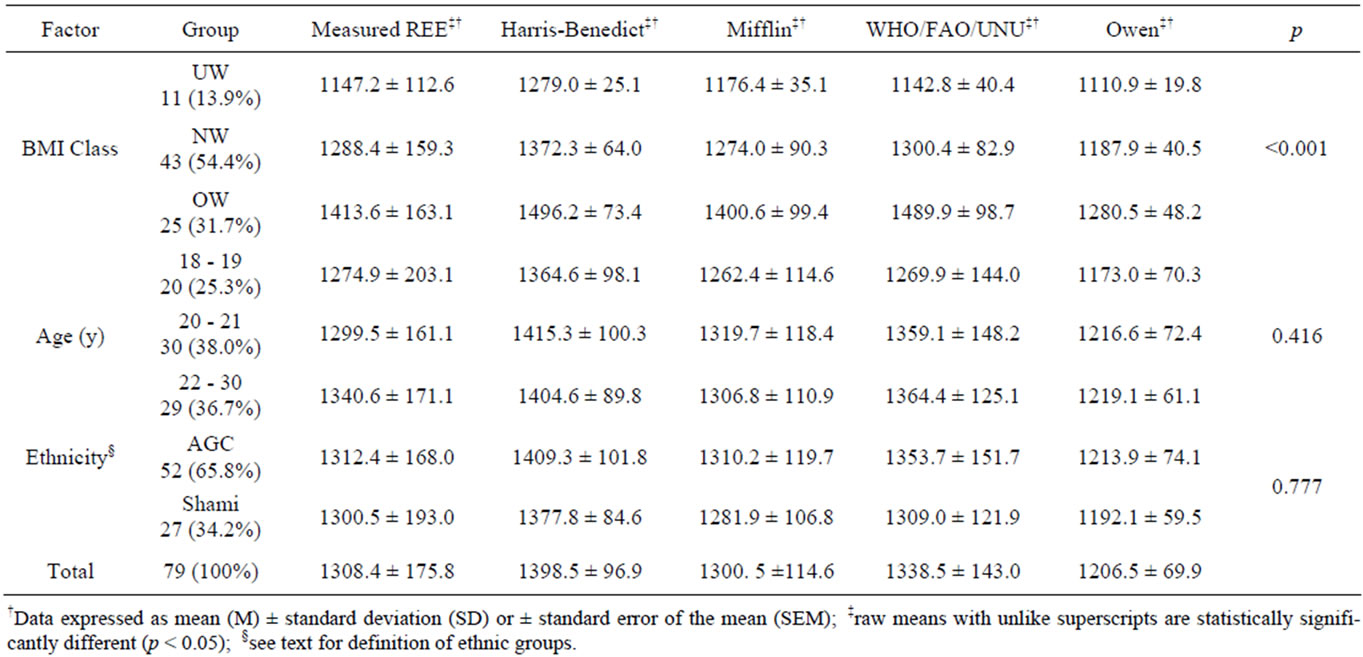
Table 5. Variation of resting energy expenditure with body mass index, age, and ethnicity.
a recently marketed device for measuring REE during rest and exercise. The device has been validated against the Douglas bag by Nieman et al., and was found to be a ‘reliable and valid system for measuring oxygen consumption and RMR in adults [11].
The selection criteria for volunteers in this study considered definite age groups (18 - 19, 20 - 21 and 22 - 30 years), gender (females), two Arab ethnic groups (AGC and Shami), and three BMI groups (UW, NW, OW). As our emphasis was to assess correlates and compare measured and predicted REE, this inclusion criteria was intended to reduce possible confounding factors known to influence REE [12-14].
Our results (Table 2) show that body composition measurements including body fat mass, waist circumference, fat free mass, skeletal muscle mass, and soft lean mass were all significantly correlated with measured REE (p < 0.001). Fat-free mass had the highest correlation with measured REE (R2 = 0.596). Taaffe et al. reported similar correlation (R2 = 0.55, p < 0.001) between fat free mass measured by indirect calorimetry (Parkinson Cowan gasometer calibrated against Tissot gasometer) and fat free mass measured by dual energy X-ray absorptiometry [15]. This observation indicate that correlations between REE and fat free mass measured by traditional indirect calorimetry and by the new available REE measuring device devices, such as the one we used in this study, are in agreement. Other investigators had also concluded that fat free mass is the largest determinant of REE [12,16,17]. Thus, with the availability of new affordable and easy to use devices for measuring REE and body composition, it is now possible to develop specific REE prediction equations based on body composition parameters, that are shown to be major determinants of REE, e.g. fat free mass, rather than using variables such as age, weight and height to develop these equations.
In the present study, the correlations between measured and estimated REE calculated using four predictive equations (Table 3) were highly significant (p < 0.001), indicating that indirect calorimetry measurement trends using Fitmate metabolic analyzer was in general agreement with the REE predicted by the four equations. The same observation was reported by Taaffe et al. who showed that the predicted RMRs by eight equations, including the Harris-Benedict, Owen et al. and Mifflin et al. were correlated with measured BMR (p < 0.001) [15].
Resting energy expenditure in this study were calculated by four commonly used REE predictive equations: Harris-Benedict, Owen, Mifflin-St. Jeor, and Schofield and compared to measured-REE values (Table 4). Mifflin-St. Jeor equation most closely predicted REE in this group of participants with non-significant difference of a mean of 8.0 kcal/day, compared to the measured REE.
This value was similar to predicted and measured REE values reported for the general public and healthy Hispanic adults in USA by De La Torre et al. and Frankenfield et al., respectively [13,18]. Agreement of measured REE and REE predicted by the Mifflin-St. Jeor equation, reported in this other study do not agree with the findings reported by Hasson et al., who indicated that the Mufflin-St. Jeor equation significantly under-predicted REE in both sexes of normal weight non-Hispanic participants [14]. A possible reason for this disagreement may by difference in ethnicity, however, such a conclusion cannot be based on results of this study. Resting energy expenditure predicted by WHO/FAO/UNU equation in this study was not significantly different from measured REE (mean difference 30.1 kcal/day, p > 0.05) (Table 4). Similarly, Hasson et al. and Rodriguez et al., and, have shown that Schofield equation (WHO/FAO/UNU) is the best of the four equations in predicting REE in young adults [14,19]. Nevertheless, this equation seemed to overestimate REE in overweight individuals [14].
In the present study, no significant differences in measured REE between participants due to age or ethnic background were detected (p > 0.05) (Table 5). This could be explained on the basis of the narrow range of the participants’ age (18 - 30 years) and homogeneity between the AGC and Shamis ethnic backgrounds, both ethnic groups being of Arab (Middle East) origin. However, significant differences were observed in measured and predicted REE for normal weight and overweight participants. Our results (Table 5) show that HarrisBenedict equation overestimated REE of normal weight participants compared to measured REE; and Owen equation predicted values for REE for normal weight and overweight participants that were significantly lower than measured REE (p < 0.001). Several studies indicated that Harris-Benedict equation overestimated REE, particularly among overweight and obese individuals [12,20-22]. Owen equation was also reported by others to under-predict REE in underweight, normal and overweight males and females individuals among aged 18 - 49 year [14]. Results of these studies strongly agree with the results obtained in this study (Table 5).
5. Conclusion
Results of this study reveal that body composition measured by BIA, including body fat mass, fat free mass, skeletal muscle mass, and soft lean mass were all significantly correlated with REE measured by the handheld device Fitmate. Fat-free mass had the highest correlation with measured REE. This study also showed that Mifflin-St Jeor equation and WHO/FAO/UNU provide an estimate of REE that is highly correlated and in good agreement with the REE measured by indirect calorimetry. Mifflin-St. Jeor equation showed the closest estimate to the measured REE in predicting REE of participants who had a normal weigh or were overweight. The results of this study also indicate that the Harris-Benedict equation significantly overestimated REE and Owen significantly underestimated REE; confirming earlier reports published by other investigators.
6. Acknowledgements
The authors are grateful to Mrs. Zeina Aljamal and Mr. Jaafer Bakri of the Department of Health Sciences, Qatar University, for their technical support and assistance in performing REE and BIA measurements.
REFERENCES
- L. K. Mahan and S. Escott-Stump, “Krause’s Food, Nutrition, and Diet Therapy,” 10th Edition, W.B. Saunders, Philadelphia, 2000.
- M. Johnstone, S. D. Murison, J. S. Duncan, K. A. Rance and J. R. Speakman, “Factors Influencing Variation in Basal Metabolic Rate Include Fat-Free Mass, Fat Mass, Age, and Circulating Thyroxine but Not Sex, Circulating Leptin, or Triiodothyronine,” American Journal of Clinical Nutrition, Vol. 81, No. 4, 2005, pp. 941-948.
- C. Compher, D. Frankenfield, N. Keim N and L. RothYousey, “Best Practice Methods to Apply to Measurement of Resting Metabolic Rate in Adults: A Systematic Review,” Journal of the American Dietetic Association, Vol. 106, No. 6, 2006, pp. 881-903. doi:10.1016/j.jada.2006.02.009
- Stanford University, “Measuring Energy Expenditure,” 2006. http://www.medschool.lsuhsc.edu/medical_education/undergraduate/nutrition/nutrprinc/unit5/c9u5measure.html
- R. D. Lee and D. C. Nieman, “Nutritional Assessment,” 5th Edition, McGraw-Hill Incorporation, New York, 2010.
- J. A. Harris and F. G. Benedict, “Biometric Study of Basal Metabolism in Man,” Carnegie Institute of Washington, Washington DC, 1919.
- M. D. Mifflin, S. T. St Jeor and L. A. Hill, “A New Predictive Equation for Resting Energy Expenditure in Healthy Individuals,” American Journal of Clinical Nutrition, Vol. 51, No. 2, 1990, pp. 241-247.
- World Health Organization, “Report of a Joint FAO/ WHO/UNU Expert Consultation,” Technical Report Series 724, World Health Organization, Geneva, 1985.
- O. E. Owen, E. Kavle and R. S. Owen, “A Reappraisal of Caloric Requirements in Healthy Women,” American Journal of Clinical Nutrition, Vol. 44, No. 1, 1986, pp. 1-19.
- D. C. Nieman, G. A. Trone and M. D. Austin, “A New Handheld Device for Measuring Resting Metabolic Rate and Oxygen Consumption,” Journal of the American Dietetic Association, Vol. 103, No. 5, 2003, pp. 588-593. doi:10.1053/jada.2003.50116
- D. C. Nieman, M. D. Austin, L. Benezra, S. Pearce, T. McInnis, J. Unick and S. T. Gross, “Validation of Cosmed’s FitMate in Measuring Oxygen Consumption and Estimating Resting Metabolic Rate,” Research in Sports Medicine, Vol. 14, No. 2, 2006, pp. 89-96. doi:10.1080/15438620600651512
- C. Douglas, J. Lawrence, N. Bush, R. Oster, B. Gower and B. Darnell, “Ability of the Harris-Benedict Formula to Predict Energy Requirements Differs with Weight History and Ethnicity,” Nutrition Research, Vol. 27, No. 4, 2007, pp. 194-199. doi:10.1016/j.nutres.2007.01.016
- C. L. De La Torre, F. A. Ramírez-Marrero, L. R. Martínez and C. Nevárez, “Predicting Resting Energy Expenditure in Healthy Puerto Rican Adults,” Journal of the American Dietetic Association, Vol. 110, No. 10, 2010, pp. 1523-1526. doi:10.1016/j.jada.2010.07.006
- R. Hasson, C. Howeb, B. Jones and P Freedson, “Accuracy of Four Resting Metabolic Rate Prediction Equations: Effects of Sex, Body Mass Index, Age, and Race/Ethnicity,” Journal of Science and Medicine in Sport, Vol. 14, No. 4, 2011, pp. 344-351. doi:10.1016/j.jsams.2011.02.010
- D. R. Taaffe, J. Thompson, G. Butterfield and R. Marcus, “Accuracy of Equations to Predict Basal Metabolic Rate in Older Women,” Journal of the American Dietetic Association, Vol. 95, No. 12, 1995, pp. 1387-1392. doi:10.1016/S0002-8223(95)00366-5
- P. J. Arciero, M. A. Goran, A. M. Gardner, P. A. Andes, R. S. Tyzber and E. T. Poehlman, “A Practical Equation to Predict Resting Metabolic Rate on Older Females,” Journal of the American Geriatric Society, Vol. 41, No. 4, 1993, pp. 395-398.
- J. J. Cunningham, “Body Composition as a Determinant of Energy Expenditure: A Synthetic Review and a Proposed General Prediction Equation,” American Journal of Clinical Nutrition, Vol. 54, No. 4, 1991, pp. 963-969.
- D. Frankenfield, L. Roth-Yousey and C. Compher, “Comparison of Predictive Equations for Resting Metabolic Rate in Healthy Nonobese and Obese Adults a Systematic Review,” Journal of the American Dietetic Association, Vol. 105, No. 5, 2005, pp. 775-789. doi:10.1016/j.jada.2005.02.005
- G. Rodriguez, L. A. Moreno, J. Fleta and M. Buena, “Resting Energy Expenditure in Children and Adolescents: Agreement between Calorimetry and Prediction Equations,” Clinical Nutrition, Vol. 21, No. 3, 2002, pp. 255- 260. doi:10.1054/clnu.2001.0531
- D. C. Frankenfield, E. R. Muth and W. A. Rowe, “The Harris-Benedict Studies of Human Basal Metabolism: History and Limitations,” Journal of the American Dietetic Association, Vol. 98, No. 4, 1998, pp. 439-445. doi:10.1016/S0002-8223(98)00100-X
- S. Heshka, K. Feld, M. Yang, D. B. Allison and S. B. Heymsfield, “Resting Energy Expenditure in the Obese: A Cross-Validation and Comparison of Prediction Equations,” Journal of the American Dietetic Association, Vol. 93, No. 9, 1993, pp. 1031-1036. doi:10.1016/0002-8223(93)92043-W
- J. M. Daly, S. B. Heymsfield, C. A. Head, L. B. Harvey, D. W. Nixon, H. Katzeff and G. D. Grossman, “Human Energy Requirements: Overestimation by Widely Used Prediction Equation,” Journal of the American Dietetic Association, Vol. 42, No. 8, 2006, pp. 1170-1174.