Food and Nutrition Sciences
Vol. 3 No. 8 (2012) , Article ID: 21573 , 7 pages DOI:10.4236/fns.2012.38139
Nut Consumption Is Associated with a Healthy Dietary Pattern in Military Men*
![]()
1Unit of Epidemiology and Biostatistics, Queen Astrid Military Hospital, Brussels, Belgium; 2Faculty of Physical Education and Physiotherapy, Department of Human Biometrics and Biomechanics, Vrije Universiteit Brussel, Brussels, Belgium.
Email: #patrick.mullie@vub.ac.be
Received May 14th, 2012; revised June 14th, 2012; accepted June 21st, 2012
Keywords: Nuts; Dietary Pattern Analysis; Nutritional Assessment; Public Health; Nutritional Epidemiology
ABSTRACT
The objective of the research was to determine the relation between nut consumption and dietary patterns described by Healthy Eating Index, Mediterranean Diet Score and principal component analysis. In a cross-sectional study, 1852 military men were contacted by mail. Using food-frequency questionnaires, nut consumption was recorded and stratified in weekly versus less than weekly. Three dietary indices were calculated and stratified in quintiles. For principal component analysis, the healthiest dietary pattern rich in fruits and vegetables was selected as Healthy Dietary Pattern. The highest quintiles of Healthy Eating Index, Mediterranean Diet Score and Healthy Dietary Pattern were systematically associated with the highest weekly consumption of nuts. The highest quintiles were also associated with the lowest intake of saturated fat, i.e. between 10 and 12 energy-percent compared with 17 to 19 energy-percent for the lowest quintiles. The mean daily nut consumption was less than 6 g a day, which is beneath the recommended quantity for cardiovascular protection. Nut consumption was associated with the healthiest dietary pattern, independently of the used method to determine the dietary pattern. Regular nut consumption seems to be a component of a cluster of several healthy behaviors.
1. Introduction
Nut consumption has been related to a reduced risk of coronary heart disease, probably by lowering blood lipids levels. Nuts are rich in unsaturated fatty acids, dietary fibers, and phytosterols. Additionally, nuts are rich in copper, magnesium, potassium, folic acid, niacin, vitamin E and vitamin B6. As recently reviewed by Sabaté et al. [1], and based only on human intervention studies, the effects of nuts on blood lipids were dose related and the lipid-lowering effects were greatest among subjects with high baseline LDL-cholesterol. A daily nut consumption of 67 g was associated with a mean reduction of total cholesterol by 5.1%. A major problem of nut consumption is the high fat content and thus the high energy-density. The total fat content of nuts varies between 45% to 75%. Stimulating regular consumption of nuts can be in conflict with the actual obesity epidemic, where prevention and treatment is associated with more energy-restrictive and low energy-density nutritional patterns [2].
An interesting finding in the review of Sabaté et al. [1] is the nut diet by Body Mass Index (BMI) interaction: the cholesterol-lowering effect of nut consumption is less pronounced in subjects with obesity. This rather puzzling consideration about nut consumption emphasizes on one hand the fact that obesity may be associated with elevated endogenous production of cholesterol. On the other hand, an association between nuts consumption and healthy dietary pattern could partly play a role in explaining the reduction of coronary heart disease reported in observational epidemiologic research [1].
Dietary pattern analysis, based on the concept that foods eaten together are as important as a reductive methodology characterized by a single food or nutrient analysis, has emerged more than a decade ago as an alternative approach to study the relation between nutrition and disease [3]. As reviewed by Hu [4], dietary pattern analysis is a better method to examine the effect of overall diet: food and nutrients are not eaten in isolation, and the “single food or nutrient” approach will not take into account the complex interactions between food and nutrients. Two major methods are used to reduce complex dietary data: a hypothesis-oriented approach using previous information to stratify a dietary pattern and a statistical approach using study-specific data to rank individuals (principal component analysis or reduced rank regression models) [5]. The Healthy Eating Index and the Mediterranean Diet Score are two frequently used hypothesis-oriented approaches. The Healthy Eating Index represents the degree to which a dietary pattern conforms to official guidelines summarized in the United States Department of Agriculture Food Guide Pyramid [6]{Please_Select_Citation_From_Mendeley_Desktop}. The Mediterranean Diet Score, according with the Mediterranean dietary pattern, has received a lot of attention because of the associated reduction in mortality [7]. An example of commonly used exploratory approach is principal component analysis identifying foods that are consumed together. This statistical technique may be able to detect correlations between foods or food groups contained in an array of nutritional data.
The aim of this study was to describe the relation between nut consumption and general dietary patterns as described by Healthy Eating Index, Mediterranean Diet Score and principal component analysis.
2. Methods
In February 2007, air and terrestrial components of the Belgian army totaled 33,053 men. After stratification for military rank and age, 5000 men were selected representative for the total army structure. The selection consisted of 598 officers; 2103 non-commissioned officers and 2299 soldiers. A semi-quantitative food frequency questionnaire with 150 food items was mailed to the participants. The following categories of consumption frequency were used: never, one to three times a month, once a week, two to four times a week, five to six times a week, once a day, two to three times a day, four to six times a day and more than six times a day. Portion sizes were predefined using familiar measuring devices (teaspoon, glass, cup...). The validity of the questionnaire was tested on a sample of 100 men representative for the participants to the cross-sectional study [8]. A second questionnaire was used to register health-related and lifestyle characteristics. This questionnaire was self-reporting regarding smoking, marital status, main occupation, age, weight, height, number of children and knowledge of cardiovascular risk factors. This questionnaire was used in previous research [9]. Yearly gross salary was obtained from administrative services, taking into account the rank and years of active duty.
The individual characteristics of the responders were categorized in age-category (20 to 29 years, 30 to 39 years, 40 to 49 years and 50 to 59 years) and Body mass index (BMI) classified in normal weight, 18.5 ≤ BMI > 25.0 kg/m2, overweight, 25.0 ≤ BMI < 30.0 kg/m2 and obesity, BMI > 30.0 kg/m2. Participation was on a voluntary basis and without incentives. An informed consent was signed by all participants.
The nut consumption was dichotomized in one or more than one portion a week versus less than one portion a week. The family of popular nuts includes almonds, cashews, hazelnuts, pecans, pine nuts, pistachios, and walnuts. The questionnaire focused exclusively on the total nut consumption as whole, not on nuts consumed in hidden sources in recipes or on nuts consumed from spreads. Consumption of hazelnut spread was not seen as a source of nuts, because health-related effects after hazelnut spread were not recognized in the literature.
Using a χ2 test, we assessed the differences in the proportion of responding officers, non-commissioned officers and soldiers that responded. Using data from military records, that is, age and rank, the differences between responders and non-responders were tested with the same test. For descriptive statistics, mean and standard deviations were calculated for the individual characteristics, according to quintiles of dietary patterns. Differences between quintiles were tested with χ2 and analysis of variance. Daily intake of nuts, fish, red meat, processed meat, legumes, fruits and vegetables were calculated according to quintiles of dietary patterns. The distributions of foods did not follow a normal distribution, we first used non-parametrical tests as indicated. However, the results of the non-parametrical tests were similar to the parametrical tests, we choose the latest for a clear presentation of data. The Healthy Eating Index and the Mediterranean Diet Score were computed as described earlier [6,7,10]. The possible scores for Healthy Eating Index ranged from 0 to 100 and for Mediterranean Diet Score from 0 to 9, with a high score for the healthiest pattern. Principal component analysis was applied to the data of the semi-quantitative food frequency questionnaire. First, 150 food items were classified into 34 predefined food groups with similar nutrient profile, according to Hu et al. [11]. Principal components analysis was used to derive dietary patterns based on the 34 food groups. Varimax transformation was effectuated to achieve uncorrelated factors with a greater interpretability. Components with eigenvalues more than 1.5, interpretability of the factors and Scree plot were used to determine the number of selected factors. The eigenvalues of the factors dropped after the second factor (from 2.44 to 1.77) and after the third factor (from 1.77 to 1.44). The remaining factors were more similar after the fourth factor (ranging from 1.38 for the fifth factor to 1.10 for the tenth factor). Three major dietary patterns were clearly identified for further analysis. The factor scores for each pattern were constructed by summing up the observed intakes of the component food items, weighted by the individual factor loadings. Those factor scores rank individuals according to their agreement with each dietary pattern. The healthiest dietary pattern was selected, that is, the Healthy Dietary Pattern (principal components analysis), because a high factor score is associated with the healthiest pattern, which is also the case for Healthy Eating Index and Mediterranean Diet Score. This Healthy Dietary Pattern was associated with a high intake of fruits, vegetables, nuts, fish, whole grain and low-fat dairy products.
A two-sided level 0.05 level of significance was defined. SPSS 16.0 (SPSS Inc., Chicago, IL, USA) statistics software was used. The Bioethical Committee of the University of Leuven approved the complete research protocol.
3. Results
Table 1 presents the characteristics of the subjects. Out of the 5000 selected men, only 37% participated to the study. The most prevalent age-category was 40 to 49 years. About 58% had a BMI ≥ 25.0 kg/m2. Responders to the mailing tended to be older than non-responders (74.3% were older than 40 years compared to 61.4% for the non-responders) (p < 0.001). Moreover, soldiers were less incline to participate to the study than officers and non-commissioned officers (p < 0.001). Of all participants, 14% consumed one or more portion of nuts a week. The mean (SD) daily portion of nuts consumed was 5.0 gram (±0.9).
Table 2 presents the factor groupings used in the principal component analysis and the factor-loading matrix for the three major factors identified by using food consumption data from the food-frequency questionnaire. The greater the factor-loading for a specific food or food item, the greater the impact of that food or food item to a specific factor. The first factor was heavily loaded with red meats, processed meats, beer, garlic, tomatoes, wine, eggs, poultry, liquor, organ meats and vegetables. This factor explained 7.4% of the total variance. This was labelled Meat Dietary Pattern. The second factor, explaining 7.2% of the total variance, was more loaded for tomatoes, fruit, low-fat dairy products, whole grain, vegetables, cold breakfast cereals, fruit juice, fish, tea and nuts. This was labelled Healthy Dietary Pattern. The last factor, explaining 6.2% of the total variance, was heavily loaded with red meats, processed meats, sweets, desserts, snacks, high-energy drinks, high-fat dairy products, refined grains, mayonnaise and potatoes. This was labelled Sweet Dietary Pattern.
Table 3 presents the distribution of age, BMI and consumption of nuts in function of the quintiles of Healthy Eating Index, Mediterranean Diet Score and Healthy Dietary Pattern (principal components analysis). The range of the scores was for the lowest and the highest quintiles of Healthy Eating Index, Mediterranean Diet Score and Healthy Dietary Pattern respectively 22 to 45
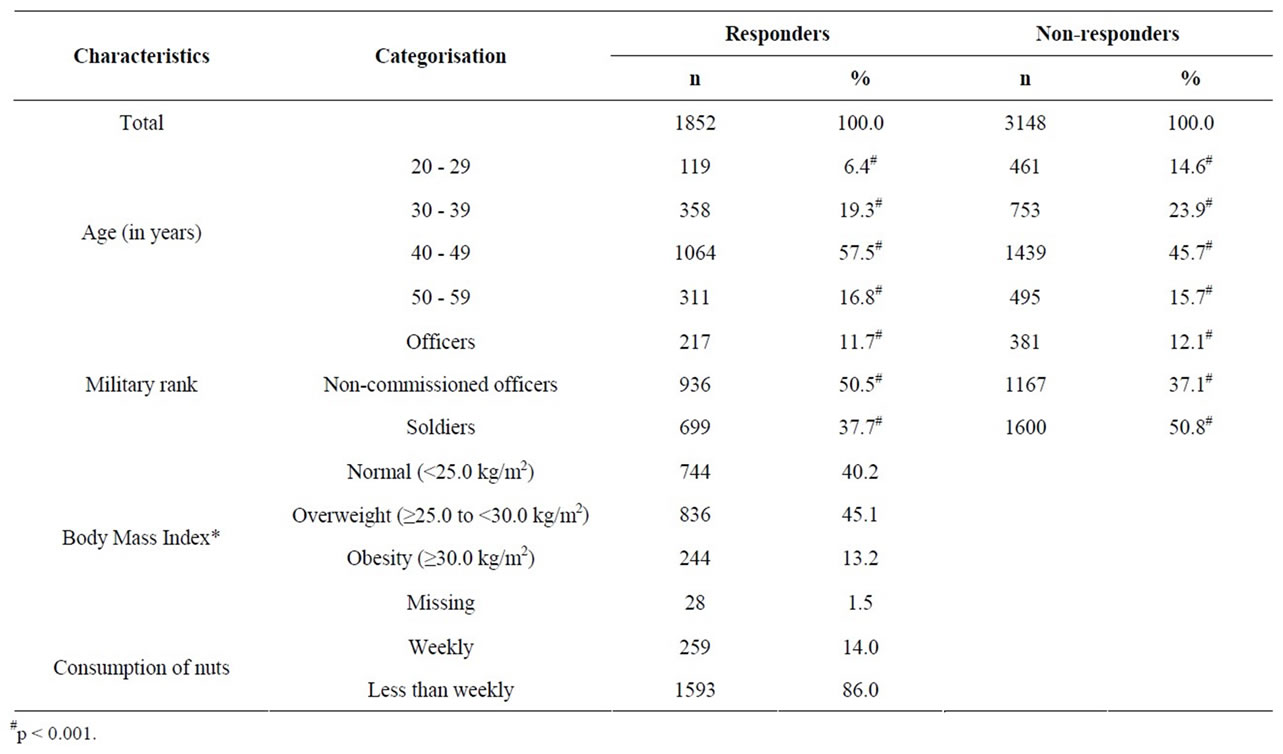
Table 1. Characteristics of the study subjects.

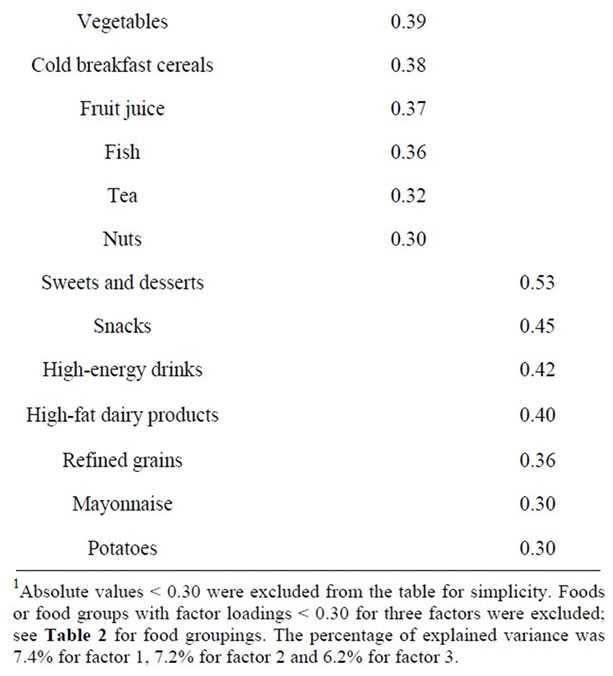
Table 2. Factor-loading matrix for the major factors identified by using food consumption data from the food-frequency questionnaire1.
and 68 to 95; 0 to 2 and 6 to 9 ; −3.6 to −0.8 and 0.7 to 4.8. Age and BMI were not statistically different across the quintiles of dietary patterns. The mean daily intake of nuts, fish, legumes, fruits and vegetables were systematically the highest in the healthiest quintile of dietary pattern, independently of the used method to characterise the dietary patterns. The daily intake of red and processed meat were low in the highest quintiles of dietary patterns.
The mean daily energy intake was not statistically significantly different between the quintiles of Healthy Eating Index. The energy intake was significantly higher in the highest quintiles of Mediterranean Diet Score and Healthy Dietary Pattern compared with the lowest quintiles. The same quintiles were also associated with the lowest intake of saturated fatty acids, i.e. between 10 and 12 energy-percent compared with 17 to 19 energy-percent for the lowest quintiles; and with the lowest intake of total fat. The intake of carbohydrates varied for the lowest scores between 35 to 40 energy-percent and 45 to 50 energy-percent for the highest scores.
As indicated in Figure 1, the highest quintiles of Healthy Eating Index, Mediterranean Diet Score and Healthy Dietary Pattern were systematically associated with the highest weekly consumption of nuts, with respectively 18%, 24% and 25% of the participants.
4. Discussion
The aim of this work was to relate the nut consumption to three commonly used methods to determine dietary patterns, namely Healthy Eating Index, Mediterranean Diet Score and Healthy Dietary Pattern. For the three methods, the highest nut consumption was related with the highest quintile. Moreover, and despite the higher fat content of nuts, a high consumption was associated with a dietary pattern with the lowest intake of total, saturated and unsaturated fat. The subjects in the healthiest quintiles for the three methods have macronutrient intake close to the official guidelines, which are respectively for proteins, fat and carbohydrates 15, 30 and 55 energypercent of total intake. Mean intake for the highest quintiles of Healthy Eating Index, Mediterranean Diet Score and Healthy Dietary Pattern ranged between 17 to 18 energy-percent for proteins, 29 to 34 energy-percent for fat and 45 to 50 energy-percent for carbohydrates. For the subjects of the lower quintiles, there was a great discrepancy between intake and official guidelines.
Prospective observational research has consistently shown that nut consumption is associated with lower risk of cardiovascular diseases [12-14]. This effect was partially explained by the favorable lipid composition of nuts. However, a possible confounding role of the general more healthy dietary pattern associated with nut consumption cannot be excluded in prospective studies. Nuts are particularly more consumed by health conscious people. Jenab et al. [15] found in the European Prospective Investigation into Cancer and Nutrition a four times higher nut consumption frequency in the health conscious cohort compared with the general population cohort, with respectively 20.5% daily consumers compared

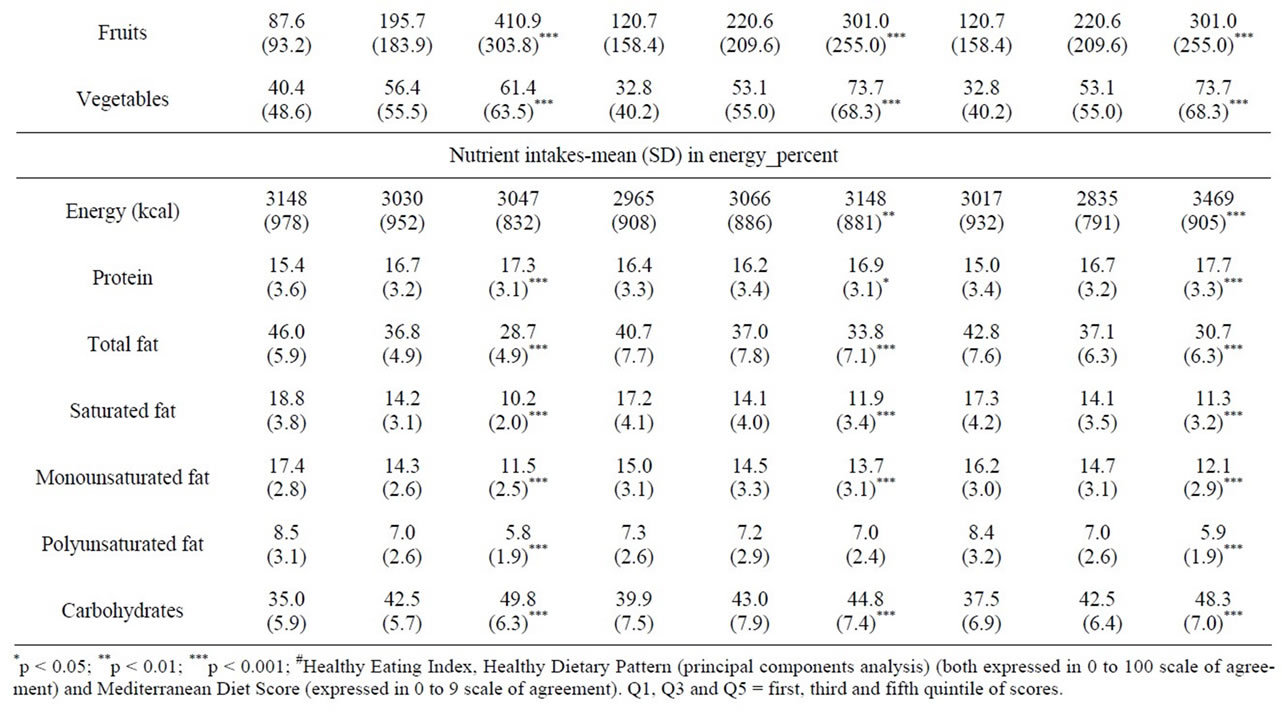
Table 3. Baseline characteristics according to Healthy Eating Index, Mediterranean Diet Score and Healthy Dietary Pattern (principal components analysis) (n = 1852)#.
with 5.6%. The association between nuts and a general more healthy dietary pattern is in line with Sabaté et al. [1] who found a less pronounced cholesterol-lowering effect of nut consumption in subjects with obesity. Both observations emphases the role of other health indicators.
However, a review of intervention studies, where the detrimental effects of confounders are limited by the design of the study, clearly indicates an independent effect of nut consumption on blood lipid levels [1]. A mean daily consumption of 67 g of nuts reduced total cholesterol and LDL concentration. Based on scientific data concerning the benefits of nut consumption, the US Food

Figure 1. Distribution of participants consuming one or more portions of nuts a week, according to quintiles of dietary patterns (in percent). HEI 1, HEI 3, HEI 5: first, third and fifth quintile of Healthy Eating Index; MDS 1, MDS 3, MDS 5: first, third and fifth quintile of Mediterranean Diet Score; PCA 1, PCA 3, HEI 5: first, third and fifth quintile of Healthy Dietary Pattern (principal components analysis).
and Drug Administration issued a qualified health claim in 2003 stating that eating 43 g/d of nuts may reduce cardiovascular disease risk [16]. These are important quantities of nuts to consume: 43 to 67 g a day represent 230 to 340 kcal a day, which is almost 10 energy-percent for an adult. Taking into account the high energy-density of nuts and the positive energy-balance in most Western countries and the uncertain health effect of nut consumption in obese individuals, a prudent approach is required in recommendation of nut consumption in general population. Such an extra energy quantity must be incorporated in the total energy envelope to obtain a steady state situation. However incorporating nuts in a general healthy pattern and lifestyle may accentuate the possible health-related beneficial effect.
Nuts are not a homogenous group concerning nutritional and health-promoting characteristics. All but chestnuts are high in fat and energy-content, whilst coconuts are rich in saturated fatty acids. The vitamin E and selenium content is variable. This complicates researches concerning the health-related effects of nuts. Most observational research do not specify the types of nuts consumed. This limits the possible extrapolation of results. Jenab et al. [15] were able to identify qualitative and quantitative differences in consumption profiles between populations. The mean (SE) daily nuts consumption was 15.8 g (2.9) a day, and only 2.2% of the participants consumed nuts during a specific day. The highest nuts consumers were found in France, the Netherlands, Germany and Greece; but the mean daily consumption was below 5 g a day. The results of this study corroborate the results of Jenab et al. [15], with a mean daily consumption of less than 6 g a day. Those quantities are by far less than those advised by Sabaté et al. [1] and the US Food and Drug Administration [16].
In conclusions, nuts consumption was associated with the highest quintiles of dietary pattern, independently of the used method to determine the dietary pattern. Those highest quintiles approached best with the official nutritional guidelines. Promoting nut consumption alone will be not enough to obtain a maximal health effect: consumption must be incorporate in a total energy-envelop.
5. Acknowledgements
We are indebted to the participants of this study.
REFERENCES
- J. Sabaté, K. Oda and E. Ros, “Nut Consumption and Blood Lipid Levels: A Pooled Analysis of 25 Intervention Trials,” Archives of Internal Medicine, Vol. 170, No. 9, 2010, pp. 821-827. doi:10.1001/archinternmed.2010.79
- J. Sabaté, “Nut Consumption and Body Weight,” American Journal of Clinical Nutrition, Vol. 78, No. 3, 2003, pp. 647S-650S.
- S. Schwerin, A. M. Riley, J. L. Stanton, E. Brett and L. Smith, “Food, Eating Habits, and Health: A Further Examination of the Relationship between Food Eating Patterns and Nutritional Health,” American Journal of Clinical Nutrition, Vol. 35, 1982, pp. 1319-1325.
- F. B. Hu, “Dietary Pattern Analysis: A New Direction in Nutritional Epidemiology,” Current Opinion in Lipidology, Vol. 13, No. 1, 2002, pp. 3-9. doi:10.1097/00041433-200202000-00002
- K. Hoffmann, “Application of a New Statistical Method to Derive Dietary Patterns in Nutritional Epidemiology,” American Journal of Epidemiology, Vol. 159, No. 10, 2004, pp. 935-944. doi:10.1093/aje/kwh134
- E. T. Kennedy, J. Ohls, S. Carlson and K. Fleming, “The Healthy Eating Index: Design and Applications,” Journal of American Dietetic Association, Vol. 95, No. 10, 1995, pp. 1103-1108. doi:10.1016/S0002-8223(95)00300-2
- F. Sofi, F. Cesari, R. Abbate, G. F. Gensini and A. Casini, “Adherence to Mediterranean Diet and Health Status: Meta-Analysis,” British Medical Journal, Vol. 337, 2008, Article No. a1344. doi:10.1136/bmj.a1344
- P. Mullie, P. Clarys, M. Hulens and G. Vansant, “Reproducibility and Validity of a Semiquantitative Food Frequency Questionnaire among Military Men,” Military Medicine, Vol. 174, No. 8, 2009, pp. 852-856.
- P. Autier, G. Vansant, N. Paquot, E. Muls, P. Mullie and A. Grivegnée, “The Impact of Reimbursement Criteria on the Appropriateness of ‘Statin’ Prescribing,” European Journal of Cardiovascular Prevention Rehabilitation, Vol. 10, No. 6, 2003, pp. 456-462. doi:10.1097/01.hjr.0000103276.02552.57
- D. Trichopoulos, “Adherence to a Mediterranean Diet and Survival in a Greek Population,” New England Journal of Medicine, Vol. 348, No. 26, 2003, pp. 2599-2608. doi:10.1056/NEJMoa025039
- F. B. Hu, M. J. Stampfer, J. E. Manson, E. B. Rimm, G. A. Colditz, B. A. Rosner, F. E. Speizer, C. H. Hennekens and W. C. Willett, “Frequent Nut Consumption and Risk of Coronary Heart Disease in Women: Prospective Cohort Study,” British Medical Journal, Vol. 317, No. 7169, 1998, pp. 1341-1345. doi:10.1136/bmj.317.7169.1341
- G. E. Fraser, J. Sabate, W. L. Beeson and T. M. Strahan, “A Possible Protective Effect of Nut Consumption on Risk of Coronary Heart Disease: The Adventist Health Study,” Archives of Internal Medicine, Vol. 152, No. 7, 1992, pp. 1416-1424. doi:10.1001/archinte.1992.00400190054010
- L. H. Kushi, A. R. Folsom, R. J. Prineas, P. J. Mink, Y. Wu and R. M. Bostick, “Dietary Antioxidant Vitamins and Death from Coronary Heart Disease in Postmenopausal Women,” New England Journal of Medicine, Vol. 334, No. 18, 1996, pp. 1156-1162. doi:10.1056/NEJM199605023341803
- C. M. Albert, J. M. Gaziano, W. C. Willett and J. E. Manson, “Nut Consumption and Decreased Risk of Sudden Cardiac Death in the Physicians’ Health Study,” Archives of Internal Medicine, Vol. 162, No. 12, 2002, pp. 1382- 1387. doi:10.1001/archinte.162.12.1382
- M. Jenab, J. Sabaté, N. Slimani, P. Ferrari, M. Mazuir, C. Casagrande, et al., “Consumption and Portion Sizes of Tree Nuts, Peanuts and Seeds in the European Prospective Investigation into Cancer and Nutrition (EPIC) Cohorts from 10 European Countries,” British Journal of Nutrition, Vol. 96, Suppl. 2, 2006, pp. 12-23. doi:10.1017/BJN20061859
- US Food and Drug Administration, “Qualified Health Claims: Letter of Enforcement Discretion: Nuts and Coronary Heart Disease,” US Food and Drug Administration, Rockville, 2003.
NOTES
*Conflict of interest: the authors declare that they have no competing interests.
Contributors: PM and PC conceived the original idea, performed the study, analyzed the data, and wrote the manuscript.
#Corresponding author.