Food and Nutrition Sciences
Vol. 3 No. 3 (2012) , Article ID: 17958 , 8 pages DOI:10.4236/fns.2012.33044
Relationship between Taste Sensitivity and Eating Style in Japanese Female University Students
![]()
1Graduate School of Human Development and Environment, Kobe University, Kobe, Japan; 2Department of Psychology, University of Graz, Graz, Austria.
Email: ykatou@crystal.kobe-u.ac.jp
Received December 1st, 2011; revised January 1st, 2012; accepted January 8th, 2012
Keywords: Taste Sensitivity; Zinc; Food Preference; Dietary Habit; Female University Students
ABSTRACT
This study investigated the relationship between taste sensitivity, the frequency and the preference for eating foods rich in zinc, dietary habits, and restrained eating among Japanese female undergraduate students. Forty-three subjects between the ages of 20 and 22 participated in this study. After a taste-sensitivity test for sweetness and saltiness the students completed a food list indicating the intake frequency and preference of foods rich in zinc and their eating habits. The students were divided into four groups: high salt-taste sensitivity (SA-HG), low salt-taste sensitivity (SA-LG), high sweet-taste sensitivity (SW-HG), and low sweet-taste sensitivity (SW-LG). Individuals in the SA-HG group ate more foods rich in zinc and were more concerned with their health than those in the SA-LG group. Further, the SW-LG group ate more convenience foods than the SW-HG group. High salt-taste sensitivity could be predicted by eating more but less preference of foods rich in zinc, less snacking, and greater regularity of meals. On the other hand there is a significant positive relationship between the frequencies of eating and preference for foods rich in zinc. This means the results were inconsistent, further research is needed to clarify this point.
1. Introduction
The physiological function of many nutrient sensors within mouth is to detect the nutritious or toxic value of foods. And recently some investigations clarified the relationship among low taste sensitivity, high food preference, high food consumption, and high BMI [1-3]. On the other side there are contradictory reports that reduced taste sensitivity might lead to weight loss [4]. From these studies taste sensitivity could play a role to regulate nutrient state, and having adequate taste sensitivity is important.
Approximately 25% of Americans are non-tasters, 50% are medium tasters, and 25% are “supertasters” [5,6]. More than 200,000 people visit a physician for chemosensory problems such as taste disorders each year in the US, and many more taste disorders go unreported [7]. Taste disorders are also prevalent in Japan, as indicated by a 2003 survey in Japan that found the number of patients presenting with taste disorders was 240,000 annually. The number of Japanese patients with taste disorders was 140,000 in 1990, indicating a 1.8-fold increase between 1990 and 2003. One cause for this marked increase is the rate that the elderly population has grown during the last decade in Japan [8]. In fact, age-related declines in taste acuity may be both a cause and an effect of depleted zinc, and they may be related to an increased zinc requirement. These declines are seen around the world [9-11]. Additionally, many young people experience weak taste sensitivity [12-14]. Especially among young women, taste disorders have increased in the past decades, which are considered a serious problem [14,15].
Diminished taste acuity is one of the features of marginal zinc deficiency, and it has been used as functional index of zinc status [16]. There would be two causes of zinc deficiency, one is low zinc intake and the other is high intake of processed and prepared foods with polyphosphoric acid sodium, which drain zinc from the body [17,18]. There are some possibilities to improve zinc deficiency by examining eating style factors considering these aspects.
Higher dietary intakes of zinc were associated with better acuity for salt taste specifically in females [17]. Pluhator, and others [16] suggested taste preference will provide to be more reproducibly related to zinc nutrients. Based on this finding it was hypothesized that preference of food rich in zinc would predict food intake rich in zinc. In this study the relationship among preference, intake of zinc nutrients, and taste sensitivity was examined.
On the other hands Japanese women have a strong desire to get slim, and they practice restrained eating to achieve this goal. As a result, they often lack micronutrients such as zinc, as seen in anorexia and other eating disorders [19,20]. Adults must have an intake of 10 - 12 mg of zinc per day, but studies suggest that young Japanese women have a daily intake of zinc that amounts to only half of their needs [21]. Further, zinc deficiencies may cause a decrease in appetite, which can eventually lead to anorexia nervosa. Alternatively, appetite disorders can cause malnutrition and, notably, inadequate zinc intake. Anorexia itself is a cause of zinc deficiency, which leads to a vicious cycle: the worsening of anorexia worsens the zinc deficiency [20]. The relationship between restrained eating and taste sensitivity should be examined.
High quantities of polyphosphoric acid sodium are used in processed and prepared foods, which interfere the metabolism of zinc [18]. In the 1980s, Japanese meals and “Japanese-style eating habits” were thought to be the healthiest in the world. However, due to the globalization of food, Japanese style eating habits have changed [22, 23]. In Japan and the rest of the world, people now commonly eat fast-food [24]. Over time, the amount of time women spend cooking at home has decreased as their level of education, involvement in professional life, and rate of employment have increased [25,26]. Specifically, the frequency of “cooking and eating at home” (called “NAISHOKU” in Japanese) has decreased, and the frequency of “eating out” (“GAISHOKU” in Japanese) has increased. Recently, the frequency of buying take-out meals and lunch boxes to eat at home (i.e., “convenience food”; “NAKASHOKU” in Japanese) has also increased. Because of the globalization of food products, Japan abounds with inexpensive imported foods, which makes NAKASHOKU reasonably priced. This is one reason why NAKASHOKU has spread so widely. Processed and Prepared foods like first-food NAKASHOKU is considered one cause of zinc deficiency and lowered taste sensitivity.
Approximately two decades ago, Egami, and others [27] reported that eating habits influence taste sensitivity. Now, two decades later, problematic eating habits have become even more frequent, such as eating an unbalanced diet and eating irregularly [28]. Due to these increases in problematic eating habits, we hypothesize that taste sensitivities have decreased. In this study the relationships between taste sensitivity and some kind of eating style are examined. If there are significant relationships the way of appropriate eating style should be showed.
Given the scarcity of studies that examine the relationship between eating style and taste sensitivity in nonclinical subjects, the aim of this study was to investigate the relationships between taste sensitivity, the frequency of eating foods rich in zinc, the preference for eating foods rich in zinc, and dietary habits in Japanese female university students. Preferences towards foods rich in zinc would predict the frequent intake of foods rich in zinc. Additionally, based on prior research, there would be a positive relationship between taste sensitivity and the intake of foods rich in zinc; thus, preferences for foods rich in zinc would be a good predictor of taste sensitivity. Additionally problematic eating style is hypothesized to effect zinc metabolism and decrease taste sensitivity (Figure 1).
2. Materials and Methods
2.1. Subjects
The subjects were 43 undergraduate female students (mean age 20.56 ± 0.50 yrs) at a women’s university in Japan. Most subjects did not smoke (95.3% non smoker), and no subjects had any diseases. The subjects gave written consent and were informed about the study procedures prior to testing. A taste sensory test for salty and sweet tastes and questionnaires to measure intake and preferences for foods rich in zinc and eating habits were administered on a voluntary basis to members of classes in September 2008. This research protocol was approved by the University Review Board for human research in accordance with the ethical standards outlined in the 1964 Declaration of Helsinki. Subjects did not receive any incentives for their participation in this study.
2.2. Material
Two taste qualities were tested: sweetness (sucrose) and saltiness (sodium chloride, NaCl). In a pilot test 9 female students decided the each taste concentration. Four dilutions of sucrose (1.50%, 2.00%, 3.00%, 4.00%) and four dilutions of NaCl (0.14%, 0.20%, 0.28%, 0.40%) were prepared the day before testing. These solutions were stored at 10˚C and brought to room temperature (20˚C ± 2˚C) prior to testing. Subjects received 10 ml of each stimulus in a disposable 3 oz white paper cup.
2.3. Procedure
Experiments were conducted in a test room for sensory measurement. The room contained eight testing booths. Tests were conducted without nose clips and under natural
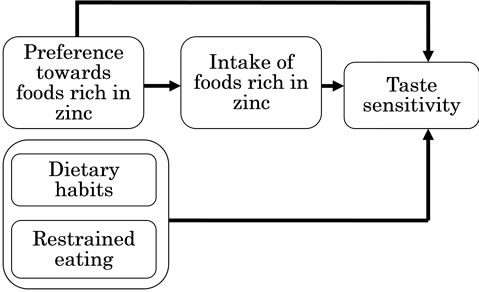
Figure 1. Conceptual mode of the relationship between taste sensitivity and eating style.
light. All stimuli were tested with a whole-mouth sipand-swallow procedure [29]. The subjects were provided with a glass of distilled water and were instructed to rinse their mouth before tasting and between each stimulus (i.e., a cup of sweet or salty solution).
Twenty-one students started with the salty solutions and continued with the sweet solutions, and 22 students were tested in reverse order to avoid sequence effects. After each tasting, they chose 1 of 5 responses: 1) It is (the same as) water; 2) It is a bit different from water; 3) I cannot confirm, but I feel that it is another taste that is different from water; 4) I know slightly what taste this is; or 5) I know clearly what taste this is. If they could recognize the kind of taste, they selected one of five the basic tastes: 1) salty taste; 2) sweet taste; 3) sour taste; 4) bitter taste; and 5) umami [30].
2.4. Questionnaire
2.4.1. Health Behavior
Participants rated the following behaviors on a 5-point scale from (1) Never to (5) Always: eating habits, intake of fast food, eating out (GAISHOKU), convenience food (NAKASHOKU), health orientation, alcohol use, smoking, and restrained eating (i.e., eating with the intention to get thin). See Table 1.
2.4.2. Frequency and Preference for Foods Rich in Zinc
We listed foods rich in zinc [31], and participants rated their intake of these foods on a 4-point Likert-type scale from (1) Never eat to (4) Eat frequently. They also indicated their preferences for eating these foods on a 3-point Likert-type scale from (1) Dislike to (3) Like. See Table 2.
2.5. Statistical Analyses
A factor analysis (unweighted least squares extraction, promax rotation) was conducted with the items that captured eating habits. Three factors were extracted: 1) Snacking (items 15 and 16); Regularity of eating (items 1, 10, and 13); and Balanced diet (items 8 and 14). One item (item 12) was removed because of low factor loading (<0.40). See Table 1.
The data were analyzed using analysis of variance (ANOVA) to determine group differences in eating habits and food intake frequencies and preferences among subjects high and low in taste sensitivity. Regression analysis was conducted to confirm preference towards foods rich in zinc would predict intake of food rich in zinc. To predict taste sensitivity, a stepwise regression analysis was conducted. The predictor variables were age, intake of particular foods rich in zinc, preference of particular food rich in zinc, regulation of eating habits (i.e., Snacking, Regularity of meals, Balanced diet), fast food, eating out (GAISHOKU), convenience food (NAKASHOKU), health orientation, alcohol use, smoking, restrained eating.
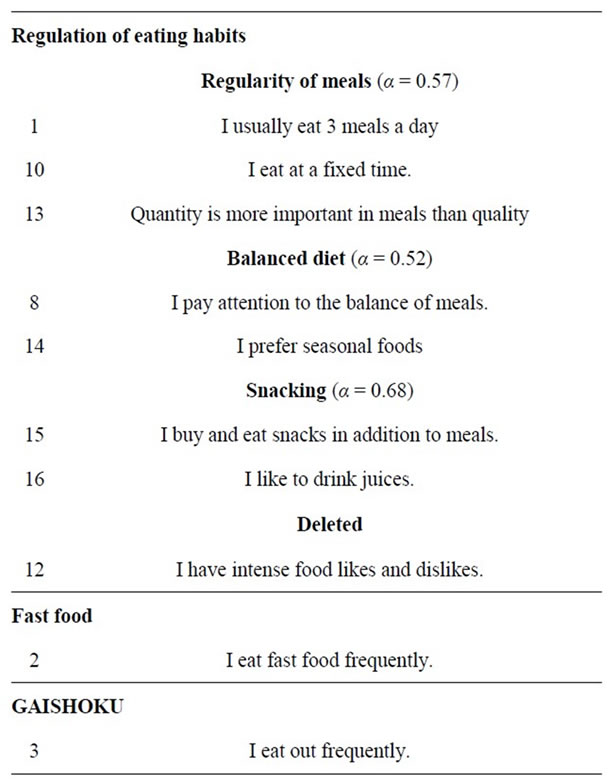

Table 1. Items of health behavior questionnaire.
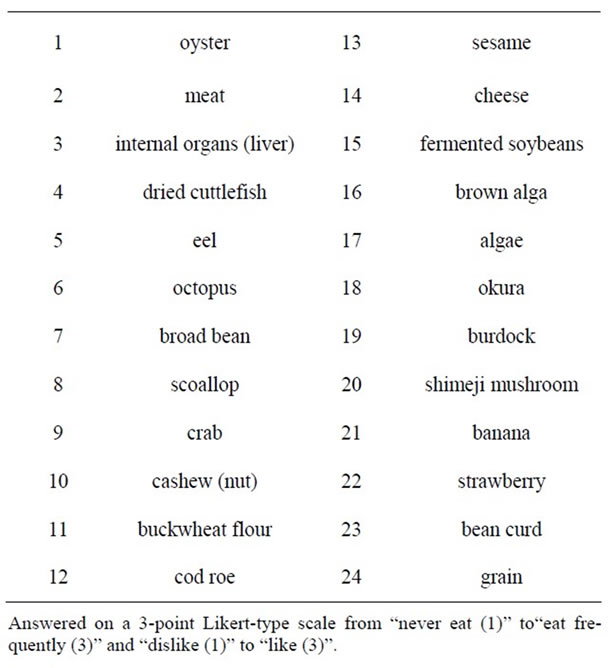
Table 2. Foods rich in zinc.
A logistic regression analysis was calculated to predict high versus low salt sensitivity. We were not able to predict sweet sensitivity due to the small number of subjects who were unable to recognize the sweet taste.
All data were analyzed using SPSS (version 16.0 Japanese Ink).
3. Results
3.1. Taste Sensitivity of Subjects: Group Assignment
Participants who recognized the salty or sweet tastes were assigned to the respective high sensitivity group (salthigh: SA-HG or sweet-high: SW-HG). The remaining participants were assigned to the low sensitivity group (saltlow: SA-LG or sweet-low: SW-LG). About half of subjects (53.49%; n = 23) could identify salty tastes, indicating that salt sensitivity is nearly equally distributed among SA-HG and SA-LG (46.51%, n = 20) groups. However, 86.0% of subjects (n = 37) could recognize sweet tastes, indicating that six times more individuals were in the SW-HG than the SW-LG group (14%, n = 6).
A McNemar Chi² test for dependent groups was significant, indicating a difference between taste sensitivity in salty and in sweet taste (p < 0.001). Twenty-one individuals (48.8%) were high in sensitivity to both salty and sweet tastes, and four individuals (9.3%) were low in sensitivity to both tastes. In the mixed groups, only two individuals (4.7%) were high in salty and low in sweet tastes, but 16 individuals (37.3%) were low in salty and high in sweet tastes.
3.2. Intake of Zinc-Rich Foods and Eating Habits
3.2.1. Foods Rich in Zinc: Intake and Preference
Two univariate ANOVAs were calculated to examine if the intake and preference for foods rich in zinc varied by taste sensitivity groups. A significant difference (F1,41 = 4.26, p < 0.05) in intake between the SA-HG (M = 2.76) and SA-LG (M = 2.52) was observed, indicating that the high salt sensitivity group ate more foods rich in zinc. However, no group differences were found in food preferences (F1,41 = 0.02, p > 0.10, SA-HG M = 2.52; SA-LG M = 2.51). Further, the sweetness groups showed no differences in intake (F1,41 = 0.00, p > 0.10, SW-HG M = 2.65, SW-LG M = 2.65) or preference (F1,41 = 2.44, p > 0.10, SW-HG M = 2.49, SW-LG M = 2.70).
3.2.2. Eating Habits
Two multivariate ANOVAs were calculated to determine differences in the scale responses (Snacking, Regularity of meals, Balanced diet, fast food, GAISHOKU, NAKASHOKU, health orientation, alcohol use, smoking, and restrained eating) in relation to taste sensitivity for saltiness (SA-HG, SA-LG) and sweetness (SW-HG, SW-LG). Only two differences were found. Specifically, the SAHG (M = 3.57) reported higher health orientation scores than the SA-LG (M = 3.10; F1,41 = 3.46, p < 0.10). Further, the SW-LG (M = 3.83) indicated more NAKASHOKU than the SW-HG (M = 2.76; F1,41 = 5.89, p < 0.05).
3.2.3. Prediction of Taste Sensitivity
First simple linear regression analysis was conducted to confirm the relationship between preference for foods rich in zinc and the intake of food rich in zinc. As the result preference predicted intake of food rich in zinc (β = 0.66, R2 = 0.42, p < 0.001). Next, a combined taste sensitivity score were created. Specifically, the following weights were allocated: high taste sensitivity in both saltiness and sweetness (4); high in saltiness, low in sweetness (3); high in sweetness, low in saltiness (2); and low in both (1). A stepwise multiple regression were calculated to predict the combined taste sensitivity score utilizing the following independent variables: age, eating habits (Snacking, Regularity of meals, and Balanced diet), fast food, GAISHYOKU, NAKASHYOKU, health orientation, alcohol use, and smoking, total intake of foods rich in zinc, and total preference for foods rich in zinc. The results showed that combined taste sensitivity increased as the intake of foods rich in zinc increased, the preference for foods rich in zinc decreased, and snacking behavior decreased (see Table 3).
Considering the fact that sweet sensitivity did not differentiate between students, but salt sensitivity did differentiate, we calculated a stepwise logistic regression analysis (backward elimination method) predicting high versus
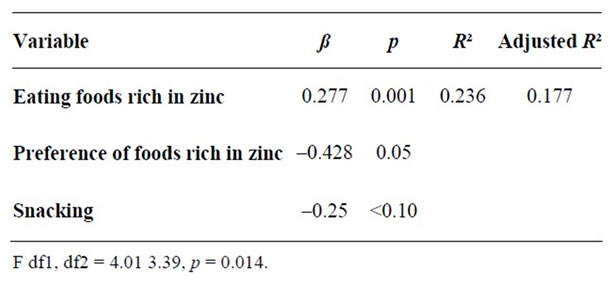
Table 3. Stepwise multiple regression to predict taste sensitivity.
low salt sensitivity including all of the above mentioned predictors. Again higher intake of foods rich in zinc (p = 0.015), less snacking (p = 0.078), and greater regularity of meals (p = 0.069) discriminated between the two groups (see Table 4). We could not conduct analyses on sweet sensitivity as the number of people who could not identify the sweet taste was too low (n = 6).
4. Discussion
The current study considered the relationship between the preference for and intake of foods rich in zinc, eating habits, and sweet and salty taste sensitivity in Japanese university women.
The SA-HG reported a greater intake of foods rich in zinc. In a sample of rats, Hasegawa and Tomita [32] demonstrated that many rats that lacked zinc (i.e., rats bred with food lacking in zinc) developed taste obstacles: 70% of the older rats and 30% of the younger rats. Further, in a sample of elderly European people, Stewart-Knox and others [9,10] demonstrated that the intake of zinc increased the acuity of salty taste in a double-blind, randomized controlled intervention trial of taste acuity in response to zinc supplementation (placebo and 15 or 30 mg zinc/d), Similarly, indications of a relationship between the intake of foods rich in zinc and salt-taste sensitivity were found in young female students.
Preference for foods rich in zinc could be hypothesized to predict food intake and based on above finding food intake predict taste sensitivity positively. Consistent with the assumption preference affected food intake positively, but contrary to our expectations, the preference influenced taste sensitivity negatively. We should consider, that preference was not a good predictor for taste sensitivity in this sample or other variables which were not taken into account were responsible for the negative relationship. Further research is needed to clarify this point.
Some studies on the relationship between food preferences and taste sensitivity have demonstrated that individuals with low salt-taste sensitivity experience the saltiness of high-salt foods, such as fish guts picked in salt and pickles, to be highly palatable; because of low salt
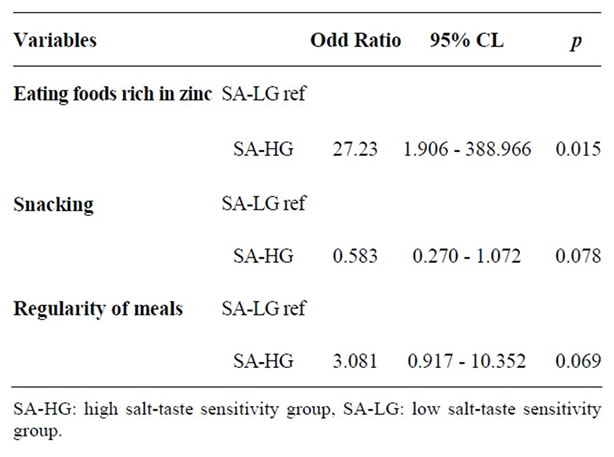
Table 4. Logistic regression to predict salt sensitivity (SAHG vs. SA-LG).
sensitivity, they actually prefer very salty food [33]. In contrast, if people have a taste sensitivity that is too high (i.e., supertaster), it is possible that they might not like many kinds of foods because the food taste is too intense. Thus, super tasting could be a cause of picky eating and lead to eating an unbalanced diet [1,34]. Children are signifycantly more sensitive to taste than their parents, which may explain why one may like some foods as an adult that one would have refused to eat as a child [35].
To avoid an unbalanced diet, we should be able to experience many kinds of tastes and have the ability to accept them. A healthy, balanced diet tends to be related to medium to high taste sensitivity in adults [36] and children [37].
The SA-HG group also indicated a higher health orientation than the SA-LG group. People eat too much salt in Japan, so it is considered one of nutrient problems. Because of this a health service should be provided to give information that recommend not eating too much salt to keep health. Being aware of the salty taste of foods might increase a person’s awareness of the relationship between salt and cardiovascular disease [38,39].
We found only a very small number of students could not detect sweet tastes, which is not surprising given that the sensory appeal of sweetness is both innate and universal [40]. Further, we found the frequent use of convenience foods (NAKASHOKU) was related to low taste sensitivity in sweetness, but not related to taste sensitivity for saltiness in the present study. Most convenience foods on the market today are laden with saturated fats, sodium, and sugar [41]. Our results are consistent with those found by Esumi [42] who showed the degree to which the usage of food additives were related to low taste sensitivity (both sweetness and bitterness).
Although taste is regarded as an important deciding factor in consumption, food consumption is also influenced by other factors. For example, some potential reasons for disconnecting between taste preferences and actual food intake include weight-related attitudes and behaviors and general concerns with nutrition and health [43]. Food preferences and food choices are further linked to attitudinal, social, and economic variables, such as income [40,44]. For example, in children, even brand names can influence taste and snack preferences [45].
The participants in this study were young females; thus, the low amounts of zinc in their diets and their frequent intake of convenience foods (NAKASHOKU) might not have the effect on their health that it would have in older people. In young females, eating disorders or highly restrained eating might also lead to zinc deficits [20]. Our subjects did not differ in restrained eating (all groups were high in these aspects), nor did they differ in other aspects of consumption, such as alcohol use and smoking (all groups were low in these aspects). Despite the fact that our sample was very similar in eating habits, the SA-HG showed more zinc intake, more healthy eating behaviors, and higher health awareness.
Zinc deficits are related to various psychological and psychiatric conditions, such as eating disorders [20], depression [46-48], and attention deficit disorder (ADHD) [49]. In Japan, the rate of depression has increased in recent years [28]. Considering these changes, it may be wise to consider zinc intake in the psychological and psychiatric context of Japanese individuals.
This study has several limitations. First, the taste sensory test for sweetness was not sensitive enough to building groups with high versus low sweet sensitivity; most of the students could recognize the sweet taste in the sucrose solution. In addition, we did not consider all variables that could relate to food preferences. For example, other missing links between taste preferences and food consumption could include complex socio-cultural factors underlying the development of food preferences, family variables, demographic, economic and health variables, and attitudes toward diet and body image.
5. Conclusion
Though food preference with rich in zinc predicted taste sensitivity negatively, food preference with rich in zinc effected taste sensitivity positively mediated by food intake rich in zinc. Restrained eating did not affect taste sensitivity. There were some possibilities that processed and prepared food (fast food and NAKASHOKU) intake influenced taste sensitivities, and regularity of meals and snacking would be important factor to keep taste sensitivity.
6. Acknowledgements
The authors thank Emi Nakaso for help conducting this study. We also thank the students who participated. This work was supported by Grant-in-Aid for Scientific Research (C) (23500945).
REFERENCES
- V. B. Duffy, K. Fast, Z. Cohen, E. Chodos and L. M. Bartoshuk, “Genetic Taste Status Associates with Fat Food Acceptance and Body Mass Index in Adults,” Chemical Senses, Vol. 24, 1999, pp. 545-546.
- J. E. Stewart, C. Feinel-Bissert, M. Golding, C. Delahunty, P. M. Clifton and R. S. J. Keast, “Oral Sensitivity to Fatty Acids, Food Consumption and BMI in Human Subjects,” British Journal of Nutrition, Vol. 104, No. 1, 2010, pp. 145-152. doi:10.1017/S0007114510000267
- M. Y. Pepino, S. Finkbeiner, G. K. Beauchamp and J. A. Mennella, “Obese Women Have Lower Monosodium Glutamate Taste Sensitivity and Prefer High Concentrations than Normal Women,” Obesity, Vol. 18, No. 5, 2010, pp. 959-965. doi:10.1038/oby.2009.493
- H. Woschnagg, C. Stollberger and J. Finsterer, “Loss of Taste Is Loss of Weight,” Lancet, Vol. 359, No. 9321, 2002, pp. 891-900. doi:10.1016/S0140-6736(02)07933-3
- L. M. Bartoshuk, V. B. Duffy and I. Miller, “PTC/PROP Tasting: Anatomy, Psychophysics, and Sex Effects,” Physiology & Behavior, Vol. 56, 1994, pp. 1165-1167. doi:10.1016/0031-9384(94)90361-1
- L. M. Bartoshuk, “Psychophysical Advances Aid the Study of Genetic Variation in Taste,” Appetite, Vol. 34, No. 1, 2000, p. 105. doi:10.1006/appe.1999.0287
- NIDCD, “Statistics on Taste,” 2010, Accessed on 16 August 2010. http://www.nidcd.nih.gov/nidcdinternet/Templates/InternetContentPage.aspx?NRMODE=Published&NRNODE GUID=%7B59580287-9D6F-4C5A-920C5EDA60503CA2%7D&NRORIGINALURL=%2Fhealth%2Fstatistics %2Ftaste.asp&NRCACHEHINT=NoModifyGuest
- M. Ikeda, M. Aiba, A. Ikui, A. Inokuchi, Y. Kurono, M. Sakagami, M. Takeda and H. Tomita, “Taste Disorders: A Survey of the Examination Methods and Treatments Used in Japan,” Acta Oto-Laryngologica (Stockh), Vol. 125, No. 11, 2005, pp. 1203-1210. doi:10.1080/00016480510040173
- B. J. Stewart-Knox, E. E. A. Simpson, H. Parr, G. Rae, A. Polito, F. Intorre, N. Meunier, M. Andriollo-Sanchez, J. M. O’Connor, C. Coudray and J. J. Strain, “Zinc Status and Taste Acuity in Older Europeans: The ZENITH Study,” European Journal of Clinical Nutrition, Vol. 59, 2005, pp. 31-36. doi:10.1038/sj.ejcn.1602295
- B. J. Stewart-Knox, E. E. A. Simpson, H. Parr, G. Rae, A. Polito, F. Intorre, M. Andriollo-Sanchez, N. Meunier, J. M. O’Connor, G. Maiani, C. Coudray and J. J. Strain, “Taste Acuity in Response to Zinc Supplementation in Older Europeans,” British Journal of Nutrition, Vol. 99, 2008, pp. 129-136. doi:10.1017/S0007114507781485
- C. Murphy, “Nutrition and Chemosensory Perception in the Elderly,” Critical Reviews in Food Science and Nutrition, Vol. 33, No. 1, 1993, pp. 3-15. doi:10.1080/10408399309527607
- P. Pavlidis, V. Nikolaidis, A. Anogeianaki, D. Koutsonikolas, G. Kekes and G. Anogianakis, “Evaluation of Young Smokers and Non-Smokers with Electrogustometry and Contact Endoscopy,” BMC Ear, Nose and Throat Disorders, Vol. 9, 2009, p. 9. doi:10.1186/1472-6815-9-9
- J. M. Boyce and G. R. Shone, “Effects of Ageing on Smell and Taste,” Postgraduate Medical Journal, Vol. 82, No. 966, 2006, pp. 239-241. doi:10.1136/pgmj.2005.039453
- C. Martin and F. Bellisle, “Eating Attitudes and Taste Responses in Young Ballerinas,” Physiology & Behavior, Vol. 46, 1989, pp. 223-227. doi:10.1016/0031-9384(89)90260-6
- H. Tomita, “The Reasons Why Taste Disturbances Increase,” Pharmaceutical Society of Japan, Vol. 28, 1992, pp. 1224-1229 (in Japanese).
- M. M. Pluhator, A. B. R. Thomson and R. N. Fedorak, “Clinical Aspects of Trace Elements: Zinc in Human Nutrition-Assessment of Zinc Status,” Canadian Journal of Gastroenterology, Vol. 10, 1996, pp. 37-42.
- O. McDaid, B. Stewart-Knox, H. Parr and E. Simpson, “Dietary Zinc Intake and Sex Differences in Taste Acuity in Healthy Young Adults,” Journal of Human Nutrition and Dietetics, Vol. 20, No. 2, 2007, pp. 103-110. doi:10.1111/j.1365-277X.2007.00756.x
- J. Shigihara, “Effect of Food Additives on the Zinc Concentration of Organs of Aged and Juvenile Rats,” Journal of Nihon University Medical Association, Vol. 49, 1990, pp. 607-618 (in Japanese).
- R. L. Katz, C. L. Keen, I. F. Litt, L. S. Hurley, K. M. Kellams-Harrison and L. J. Glader, “Zinc Deficiency in Anorexia Nervosa,” Journal of Adolescent Health Care, Vol. 8, No. 5, 1987, pp. 400-406. doi:10.1016/0197-0070(87)90227-0
- N. F. Shay and H. F. Mangian, “Neurobiology of ZincInfluenced Eating Behavior,” Journal of Nutrition, Vol. 130, No. 5, 2000, pp. 1493S-1499S.
- T. Kurosawa and Y. Ito, “Present Condition of Young Women’s Intake of Nutrients: Intake of n-3/n-6 Ca/Mg, Zn and so on,” Seirei Women’s Junior Collage Bulletin, Vol. 27, 1999, pp. 112-120.
- N. Ishige, “The History and Culture of Japanese Food,” Columbia University Press, New York, 2001.
- K. F. Kiple and K. Ornelas, Eds., “The Cambridge World History of Food,” Vol. 2, Cambridge University Press, Cambridge, 2000.
- E. Schlosser, “Fast Food Nation: The Dark Side of the All-American Meal,” Houghton Mifflin Company, Boston, 2001.
- P. L. Klumb, C. A. Hoppmann and M. Staats, “Division of Labor in German Dual-Earner Families: Testing Equity-Theoretical Hypotheses,” Journal of Marriage and the Family, Vol. 68, No. 4, 2006, pp. 870-882. doi:10.1111/j.1741-3737.2006.00301.x
- K. M. T. Quek and K. Knudson-Martin, “A Push toward Equality: Processes among Dual-Career Newlywed Couples in Collectivist Culture,” Journal of Marriage and Family, Vol. 68, No. 1, 2006, pp. 56-69. doi:10.1111/j.1741-3737.2006.00233.x
- I. Egami, H. Kato and M. Nagano, “Taste Sensibility of Girl Students (Part 1)—Relation to Food Preference and Habit,” College of Nagoya Bunri University, Vol. 15, 1990, pp. 47-56 (in Japanese).
- Ministry of Health, Labour and Welfare, “Interim Report of Healthy Japan,” 2007. http://www.kenkounippon21.gr.jp/kenkounippon21/ugoki/kaigi/pdf/0704hyouka_tyukan.pdf#search='健康日本21 中間報告'
- Y. Yamauchi, S. Endo, F. Sakai and I. Yoshimura, “A New Whole-Mouth Gustatory Test Procedure: I. Thresholds and Principal Components Analysis in Healthy Men and Women,” Acta Oto-Laryngologica, Vol. 122, Suppl. 546, 2002, pp. 39-48. doi:10.1080/00016480260046409
- J. G. Brand, “Within Reach of an End to Unnecessary Bitterness,” Lancet, Vol. 356, No. 9239, 2000, pp. 1371- 1372. doi:10.1016/S0140-6736(00)02836-1
- Nipuro Company, “I Cannot Identify Good Taste! Taste Disturbance,” 2008, (in Japanese). http://www.nipro.co.jp/health/014_2.html
- H. Hasegawa and H. Tomita, “Assessment of Taste Disorders in Rat by Simultaneous Study of the Two-Bottle Preference Test and Abnormal Ingestive Behavior,” Auris-Nasus-Larynx (Tokyo), Vol. 15, 1988, pp. 117-127.
- T. Mituhashi, S. Toda and K. Hatae, “Taste Sensitivity and Food Preference of Elderly,” The Japan Society of Cookery Science, Vol. 41, 2008, pp. 241-247 (in Japanese).
- R. B. Martha and J. P. Gary, “Association of Thermal Taste and PROP Responsiveness with Food Liking, Neophobia, Body Mass Index, and Waist Circumference,” Food Quality and Preference, Vol. 21, No. 6, 2010, pp. 589-601. doi:10.1016/j.foodqual.2010.03.007
- D. Bauer, A. Santi and V. Utermohlen, “How Individual Differences in Taste Input Impact Smell and Flavor Perception—An Example of a Complex Process,” InterJournal Complex Systems, 2003, Article #364.
- A. Drewnowski, S. Ahlstrom and A. Barratt-Fornell, “Genetic Taste Markers and Food Preferences,” Drug, Metabolism & Disposition, Vol. 29, No. 4, 2001, pp. 535- 538.
- K. L. Keller, L. Steinmann, R. J. Nurse and B. J. Tepper, “Genetic Taste Sensitivity to 6-N-propylthiouracil Influences Food Preference and Reported Intake in Preschool Children,” Appetite, Vol. 38, No. 1, 2002, pp. 3-12. doi:10.1006/appe.2001.0441
- S. A. Isezuo, Y. Saidu, S. Anas, B. U. Tambuwal and L. S. Bilbis, “Salt Taste Perception and Relationship with Blood Pressure in Type 2 Diabetics,” Journal of Human Hypertension, Vol. 22, 2008, pp. 432-434. doi:10.1038/jhh.2008.1
- L. Hooper, C. Bartlett, G. D. Smith and S. Ebrahim, “Advice to Reduce Dietary Salt for Prevention of Cardiovascular disease,” Cochrane Database of Systematic Reviews, The Cochrane Collaboration, John Wiley & Sons, Ltd., New York, 2009.
- A. Drewnowski, “Taste Preferences and Food Intake,” Annual Review and Nutrition, Vol. 17, 1997, pp. 237-253. doi:10.1146/annurev.nutr.17.1.237
- M. Stevens, “Convenience Foods: A Quick And Healthy Guide For Those On The Go,” 2009, Accessed on 16 August 2010. http://my.clevelandclinic.org/heart/prevention/nutrition/conveniencefoods.aspx
- Y. Esumi, “Relationship between Taste Perception, Dietary Habits and Food Preferences,” Shimane Prefectural Shimane Women’s College, Vol. 38, 2000, pp. 63-71 (in Japanese).
- H. Tuorila and R. M. Pangborn, “Prediction of Reported Consumption of Selected Fat-Containing Foods,” Appetite, Vol. 11, 1988, pp. 81-95. doi:10.1016/S0195-6663(88)80008-4
- J. B. Block, R. A. Scribner and K. B. DeSalvo, “Fast Food, Race/Ethnicity, and Income, A Geographic Analysis,” American Journal of Preventive Medicine, Vol. 27, No. 3, 2004, pp. 211-217. doi:10.1016/j.amepre.2004.06.007
- C. A. Roberto, J. Baik, J. L. Harris and K. D. Brownell, “Influence of Licensed Characters on Children’s Taste and Snack Preferences,” Pediatrics, Vol. 126, No. 1, 2010, pp. 88-93. doi:10.1542/peds.2009-3433
- M. Maes, P. C. Haese, S. Scharpe, P. D. D’Hondt, P. Cosyns and M. E. De Broe, “Hipozincemia in Depression,” Journal of Affective Disorders, Vol. 31, No. 2, 1994, pp. 135-140. doi:10.1016/0165-0327(94)90117-1
- G. Nowak, M. Siwek, D. Dudek, A. Zieba and A. Pilc, “Effect of Zinc Supplementation on Antidepressant Therapy in Unipolar Depression: A Preliminary PlaceboControlled Study,” Polish Journal of Pharmacology, Vol. 55, No. 6, 2003, pp. 1143-1147.
- H. Tsunoda, K. Kamijima, H. Miyaoka and T. Nagai, “Threshold Levels of Taste Perception and Severity of Depression,” Japanese Society of Psychosomatic Medicine, Vol. 42, 2002, pp. 217-224 (in Japanese).
- M. Bilici, F. Yildirim, S. Kandil, M. Bekaroglu, S. Yildirmis, O. Deger, M. Ülgen, A. Yildiran and H. Aksu, “Double-Blind, Placebo-Controlled Study of Zinc Sulphate in the Treatment of Attention Deficit Hyperactivity Disorder,” Progress in Neuro-Pharmacology & Biological Psychiatry, Vol. 28, No. 1, 2004, pp. 181-190.