Social Networking
Vol.2 No.2(2013), Article ID:30811,10 pages DOI:10.4236/sn.2013.22009
Real-Time Twitter Sentiment toward Thanksgiving and Christmas Holidays
Department of Computer Science, Houghton College, New York, USA Email: wei.hu@houghton.edu
Copyright © 2013 Wei Hu. This is an open access article distributed under the Creative Commons Attribution License, which permits unrestricted use, distribution, and reproduction in any medium, provided the original work is properly cited.
Received February 26, 2013; revised March 25, 2013; accepted April 17, 2013
Keywords: Twitter; Thanksgiving; Christmas; Sentiment Analysis; Streaming API
ABSTRACT
Thanksgiving and Christmas are two major holidays in the United States. Many people use social media to stay connected with their families and friends, including sharing their holiday experiences. This study utilized a stream of millions of tweets on Twitter to explore how people feel about these two holidays through real-time sentiment analysis. With help of Twitter Streaming API, we discovered the patterns of sentiment changes by hour before and after the two holidays in 2011, thus providing a unique peek into the celebration of these holidays that could not be accomplished with traditional methods. Our analysis suggested that in 2011 people had higher sentiment toward Christmas than Thanksgiving on average. The sentiment reached its maximum on the Thanksgiving Day and on The Christmas Eve and Christmas Day, highlighting stronger zeal for Christmas than Thanksgiving, while remained a stable and lower sentiment before and after the holidays. Typically there was a peak of sentiment toward Thanksgiving and Christmas in the morning of each day around 9:00 am (EST). On the Thanksgiving Day the number of tweets on shopping increased rapidly and monotonically to its maximum as time approaching the midnight when people thinking of shopping on the Black Friday, but unexpectedly the sentiment toward shopping dropped quickly and monotonically, displaying the exact opposite trend. We also investigated the shopping distraction on the theme of these two holidays. It was found that there were more people talking about thankfulness than shopping during the Thanksgiving season, but more people talking about shopping than Jesus during the Christmas season.
1. Introduction
Thanksgiving and Christmas are two traditional holidays. Although Christmas is celebrated worldwide, Thanksgiving is mainly a holiday in America and Canada. President George Washington described Thanksgiving in his proclamation on October 3, 1789 as “a day of public thanksgiving and prayer to be observed by acknowledging with grateful hearts the many signal favors of Almighty God especially by affording them an opportunity peaceably to establish a form of government for their safety and happiness” [1]. On October 3, 1863, President Abraham Lincoln proclaimed a national holiday day of “Thanksgiving and Praise to our beneficent Father who dwelleth in the Heavens” [2]. Celebrated on the fourth Thursday of November, Thanksgiving promotes thankfulness and gratitude, which is a day for families to gather around the table for a big dinner and to count their blessings and give thanks.
Among many traditions in the US, Thanksgiving holiday bears a clear American marker that is so unique and special. As a Chinese student family in the US during the 1990s, we were regularly invited to spend the Thanksgiving Day with an American family, from which we had our first impression on the Americans and were deeply touched by this experience. Away from our parents and relatives in China, celebrating the Thanksgiving holiday at an American home made us feel right at home and reduced our homesickness. We were beginning to ask the question “What makes this nation great?” To many people, the answer might be the military power or the sciences and technologies of the United States, but as we realized later this is not the correct answer.
The original Christmas is a special church service, or mass, to celebrate the birth of Christ as a fulfillment of the Messianic prophecy in the Old Testament of the Bible. The birth of Jesus marks the beginning of the New Testament of the Bible and is the greatest gift ever God gave to mankind. Christmas promotes sharing and giving, a day of spreading joy, exchanging gifts, and family reunion. December 25 was declared a federal holiday in the United States in 1870 (en.wikipedia.org/wiki/Christmas). The two holiday seasons have been commercialized by retailers, as people purchase gifts, decorations, and supplies to celebrate.
Twitter is a popular social networking website that provides micro-blogging service to its users. The short text messages on Twitter are 140 characters or less, termed tweets, allowing people to convey opinions and thoughts efficiently. With the Twitter Streaming API users can download a stream of tweets in real time. The unprecedented enormous user generated data on Twitter provide rich data for development of new techniques to gain insights into public opinions about a wide range of topics, which is useful for political, business, and many other entities. The sentiment analysis, also known as opinion mining, has been conducted on Twitter data, as to determine whether a tweet is subjective or objective, and whether any opinion expressed is positive or negative [3,4].
The purpose of this study was to examine this stream of text messages on Twitter to gather real-time sentiment toward Thanksgiving and Christmas in 2011. Our task was to identify the changing pattern of sentiment on the two holidays by hour, offering new insights into the celebration of these two most important holidays in the United States. Additionally, we sought to understand the sentiment correlation between Thanksgiving and shopping and the shopping distraction on the theme of these two holidays.
2. Materials and Methods
2.1. Tweets Collected for This Study
We made use of the Twitter Streaming API to collect a stream of tweets containing the relevant keywords needed for this study during the Thanksgiving and Christmas holiday seasons in 2011, which fell into three categories: Thanksgiving, Christmas, and shopping. To explore the sentiment correlation between Thanksgiving and shopping, we also collected the tweets containing keyword “shopping”. The Thanksgiving and shopping tweets were collected from Nov 14, 2011 to Dec 1, 2012, and the Christmas tweets from Dec 8, 2011 to Jan 8, 2012. To render the whole picture of these tweets, we generated some Meta data about them, which included the length and the number of tweets collected by hour or day.
2.1.1. Tweet Counts by Day
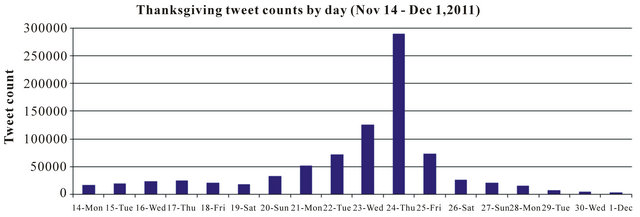
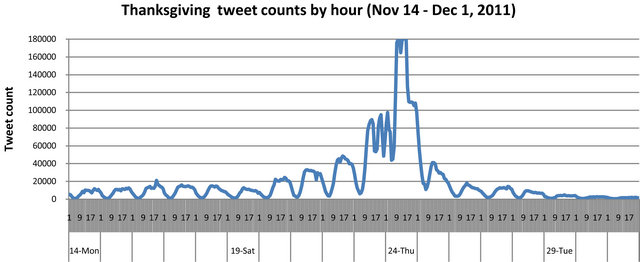
All tweets in the three categories increased gradually before the holidays, but only Thanksgiving and Christmas tweets decreased rapidly after, showing a sustained interest of shopping even after the two holidays (Figure 1). The highest and second highest peaks occurred on Nov 24 and Nov 23 respectively for Thanksgiving tweets, but occurred on Nov 25 and Nov 24 respectively for shopping tweets due to the Black Friday. In contrast, the Christmas tweets had the highest peak on Dec 24 (Christmas Eve), but the second highest peak seemed to occur on both days right before or after Dec 24, a pattern different than the other two classes of tweets. For Thanksgiving tweets, the highest peak appeared on the Thanksgiving Day, but for Christmas tweets the highest peak occurred on Christmas Eve. Our calculation confirmed the common sense that overall shopping is a perpetual interest, whereas the interests in two holidays are understandably temporal.
2.1.2. Tweet Counts by Hour
The Streaming API of Twitter enabled downloading of tweets in sequence. As a result, the tweet counts by hour could be tallied (Figure 2). There were relative low numbers of Thanksgiving tweets on Nov 23 from 4:00 pm to 6:00 pm, and relative low numbers of tweets on Nov 24 from 5:00 pm to 00:00 am, suggesting a longer dinner time on Nov 24 than that on Nov 23. On Nov 24, at 12:00 pm there were a relative low numbers of tweets, implying a lunch time, a pattern not observed on the other days. On the Thanksgiving Day, the number of shopping tweets rapidly increased to its maximum monotonically as time approaching the midnight when people getting ready for their shopping on the Black Friday.
During the whole day of Christmas Eve, there were sustained high numbers of Christmas tweets even up to the midnight, which was not seen on the other days. On the Christmas day, there were two low points on the curve, one at 10:00 am and one at 5:00-6:00 pm. We could speculate that the first low point was for church services and the second for dinner time. Within each day the curve of Christmas tweet counts oscillated more than those of Thanksgiving and shopping.
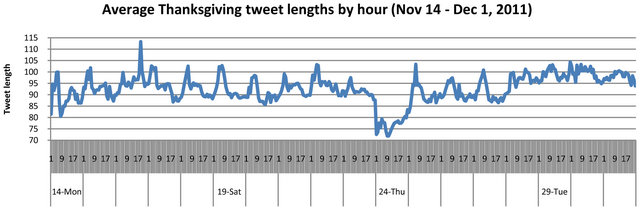
2.1.3. Tweet Lengths by Hour
We measured the average lengths of the tweets collected by hour (Figure 3). The shortest length occurred on Nov 24 (Thanksgiving Day) for Thanksgiving tweets, on Nov 25 (Black Friday) for shopping tweets, and on Dec 25 (Christmas Day) for Christmas tweets, implying people were busy on these special days with little time on writing their tweets. It was noteworthy that the tweet counts in Figure 2 did not show such consistency. The shopping tweet length curve within each day had a similar structure, which did not appear in the other two classes of tweets.
2.2. Sentiment Predictior
The sentiment predictor used in this study was built with an opinion lexicon [5]. Several opinion lexicons exist, but a webderived lexicon like the one from [5] could
 (a)
(a)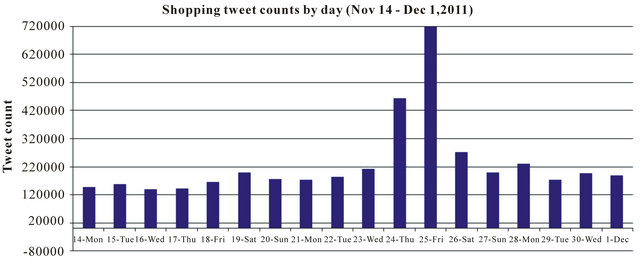 (b)
(b)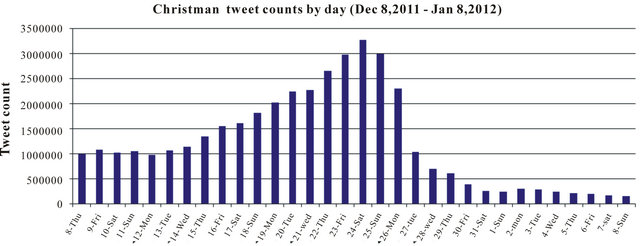 (c)
(c)
Figure 1. Tweet counts by day.
improve lexicon-based sentiment evaluation [6].
We adopted the approch in [7] to count instances of positive and negative words and emoticons, when evaluating the sentiment of a tweet using an opinion lexicon. Considering the characteristics of tweets, a weight +1 was assgined to a positive word, −1 to a negative word, +5 to a positive emoticon, and −5 to a negative emoticon, since emoticons are key non-verbal sentiment indicators in tweets. An opinion word combined with a negation word, such as “no” or “not”, was assgined to its opposite weight. Each tweet was decomposed into n unique tokens (words and emoticons) and its sentiment score or value was defined as follows:
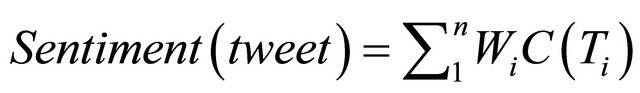
where Wi was the weight and C(Ti) was the count of token Ti in the tweet. According to this formula, positive sentiment values represent positive sentiment of a tweet, whereas negative sentiment values mean negative sentiment. Obviously, a zero value represents neutral sentiment
 (a)
(a)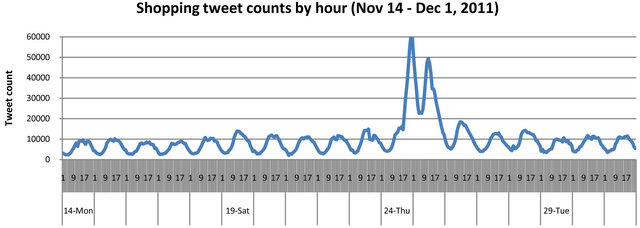 (b)
(b)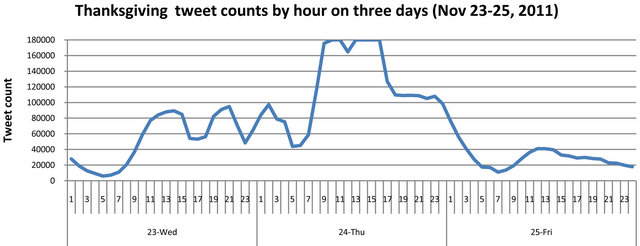 (c)
(c)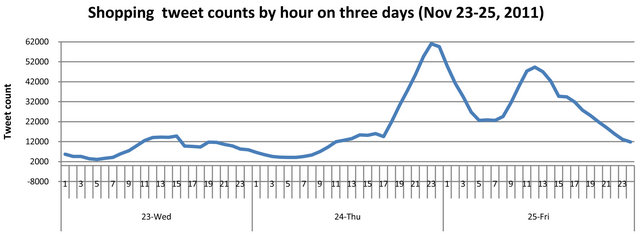 (d)
(d)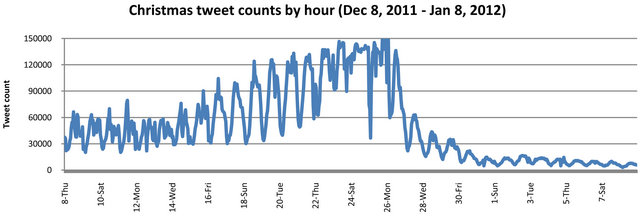 (e)
(e) (f)
(f)
Figure 2. Tweet counts by hour.
In [8] we showed that our sentiment predictor performed better than other predictors on tweets.
The purpose of this study was to gauge the average Twitter sentiment toward Thanksgiving and Christmas holidays. Therefore, it was natural to use a scoring system rather than a clssifier that predicts the sentiment as either positive, neutral, or negative. Since the scores are additive, three tweets with sentiment values −3, 0, and 9 have their average as 2, whereas this average is difficult to calculate if these three tweets are classified as negative, neutral, and positive.
3. Results
In the current study, we assessed the Twitter sentiment toward Thanksgiving and Christmas holidays in 2011. With the Stream Twitter API, sentiment was calculated in real time by hour during these two holiday seasons. Obviously the theme of Thanksgiving holiday is thankgiving and that of Christmas is Jesus. But beacude of the commercialization of these two holidays, the purposeses of these two holidays somewhat have been lost. To numerically determine this lose, we computed the percetage of the Thanksgiving tweets that conained word “thankful” or “grateful” or “shopping”, and the percetage of the Christmas tweets that conained word “Jesus” and “shooping”. The time used in this study was Eastern Standard Time.
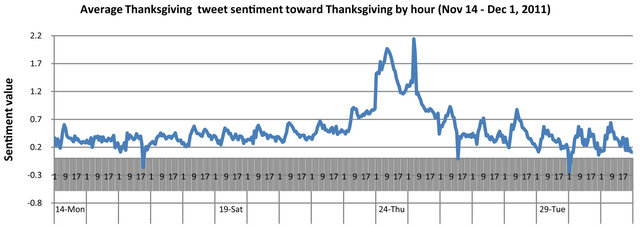
3.1. Sentiment toward Thanksgiving
There was a slow and gradual increase of the sentiment toward Thanksgiving prior to the Thanksgiving Day, Nov 24, and then a gradual decrease after,with its maximum value occurred on the Thanksgiving Day. On each day, the highest sentiment seemed to appear in the morning around 9:00 am, when the local maximum arose. The sentiment toward shopping remained a stable trend over the period observed with only one suddent decrease to its minimum at the midnight of the Thanksgiving Day (Figure 4). But on the same day, the number of tweets on shopping swiftly reached its maximum as time nearing the midnight (Figure 2), showing an opposite pattern when people preparing their shopping on the Black Friday.
To measure the impact of shopping on thankfulness during the Thanksgiving season, we counted the percent of the Thanksgiving tweets containing word “thankful” or “grateful” or “shopping” (Figure 5). There was a peak of thankfulness around the Thanksgiving Day, and the shopping concept dropped to its minimum on the Thanksgiving Day, which was encouraging.
 (a)
(a)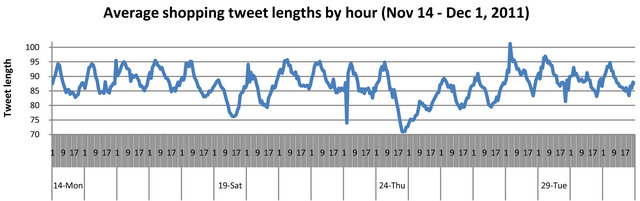 (b)
(b)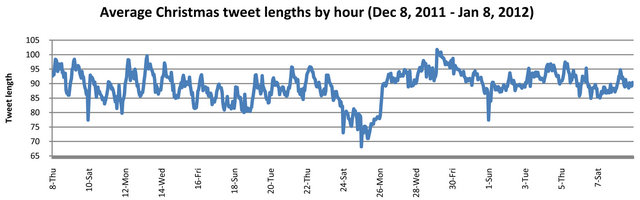 (c)
(c)
Figure 3. Tweet lengths by day.
3.2. Sentiment toward Christmas
There were two highest peaks for the Christmas tweets on Christmas Eve and Christmas Day, exhibiting strong sentiment and resembling the tweet counts for this class of tweets, in contrast to one highest peak for the Thanksgiving tweets on the Thanksgiving Day, one lowest sentiment for the shopping tweets on the Black Friday. There was a decrease of sentiment in the afternoon on Christmas Eve, while the number of tweets on Christmas remained steadily high during the whole day of Christmas Eve (Figure 6).
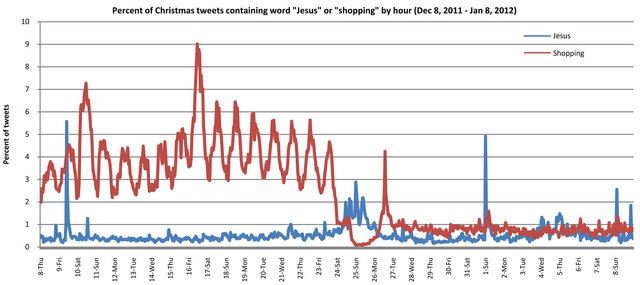
To find out the effect of shopping on Christmas, we selected the Christmas tweets that contained word “shopping” or “Jesus”. The number of the tweets containing “shopping” was more than that containing “Jesus” before Christmas Day, which was true even on Sundays, and then suddenly this pattern reversed on Christmas Day, also a Sunday in this particular year. After Christmas Day, the number of tweets containing word “shopping” gradually approached to that containing “Jesus” (Figure 7). It could be speculated that even when people talking about Christmas on Twitter, their main focus was still on shopping rather than on Jesus, the real meaning of Christmas. This phenomenon was in contrast to what was observed in the Thanksgiving tweets (Figure 5). The Thanksgiving tweets had an average sentiment 0.50 from Nov 14 to Dec 1, while Christmas tweets had 0.73 from Dec 8, 2011 to Jan 8, 2012, implying stronger sentiment toward Christmas than Thanksgiving. There were more
 (a)
(a)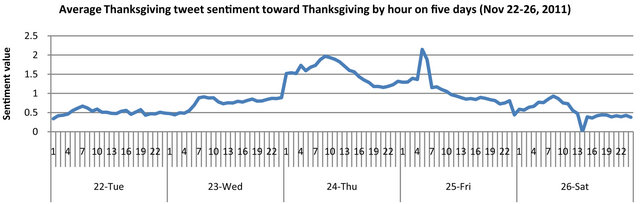 (b)
(b) (c)
(c) (d)
(d)
Figure 4. Sentiment toward Thanksgiving and shopping by hour.
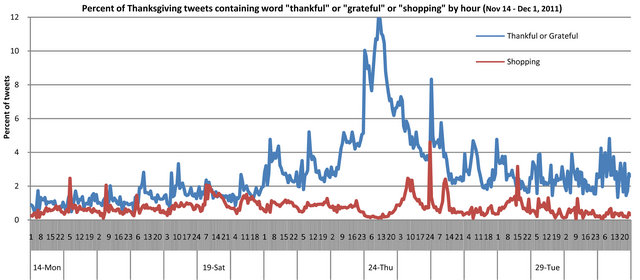
Figure 5. Comparison of Thanksgiving tweets containing “thankful” or “grateful” and “shopping”.
 (a)
(a) (b)
(b)
Figure 6. Sentiment toward Christmas by hour.
tweets talking about thankfulness than shopping during the Thanksgiving season, but there were more tweets talking about shopping than Jesus during the Christmas season.
4. Conclusions
We conducted a computational analysis on a stream of millions of tweets that were related to the Thanksgiving and Christmas holidays in 2011. Using the Twitter Streaming API, these tweets were downloaded in sequence that enabled us to carry out the calculation by hour. With the enormous user generated contents on Twitter, our survey of the Twitter sentiment provided new insights into the celebration of these two holidays, impossible with traditional methods.
Using Twitter data our investigation found that people had higher sentiment toward Christmas than Thanksgiving on average. The highest sentiment occurred on the Thanksgiving Day and on the Christmas Eve and Christmas Day while remained the same lower sentiment before and after the two holidays. The existence of two highest peaks of sentiment on Christmas implied a stronger fervor for this holiday than Thanksgiving. There was a peak of sentiment toward Thanksgiving and Christmas in the morning of each day around 9:00 am
 (a)
(a)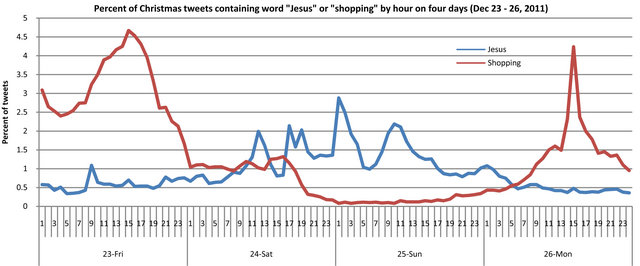 (b)
(b)
Figure 7. Comparison of Christmas tweets containing “Jesus” and “shopping”.
and such a peak occurred around 5:00-6:00 am for shopping tweets. On the Thanksgiving Day the number of shopping tweets increased quickly and monotonically to its maximum as time nearing the midnight when people thinking of shopping on the Black Friday, but surprisingly the sentiment toward shopping declined swiftly and monotonically.
The origins and themes of Thanksgiving and Christmas are well known. However they could be easily obscured by many activities in daily life. We tried to quantify the shopping distraction on the purpose of these two holidays. Our calculation revealed that in 2011 there were more people talking about thankfulness than shopping during the Thanksgiving season, encouraging news. However, there were more people talking about shopping than Jesus during the Christmas season, not encouraging at all.
5. Acknowledgements
We thank Houghton College for its financial support.
REFERENCES
- http://gwpapers.virginia.edu/documents/thanksgiving/transcript.html
- http://www.pilgrimhall.org/ThanxProc1862.htm
- B. Pang and L. Lee, “Opinion Mining and Sentiment Analysis, Foundations and Trends in Information Retrieval,” Vol. 2, No. 1-2, 2008, pp. 1-135. doi:10.1561/1500000011
- A. Pak and P. Paroubek, “Twitter as a Corpus for Sentiment Analysis and Opinion Mining,” Proceedings of LREC, Valletta, 19-21 May 2010.
- M. Q. Hu and B. Liu, “Mining and Summarizing Customer Reviews,” Proceedings of the ACM SIGKDD International Conference on Knowledge Discovery & Data Mining (KDD-2004), Seattle, 22-25 August 2004, pp. 168-177.
- L. Velikovich, S. Blair-Goldensohn, K. Hannan and R. McDonald, “The Viability of Web-Derived Polarity Lexicons, Human Language Technologies,” The 2010 Annual Conference of the North American Chapter of the Association for Computational Linguistics, Los Angeles, 2-4 June 2010.
- B. O’Connor, R. Balasubramanyan, B. R. Routledge and N. A. Smith, “From Tweets to Polls: Linking Text Sentiment to Public Opinion Time Series,” Proceedings of the International AAAI Conference on Weblogs and Social Media, 23-26 May 2010, Washington DC, pp. 122-129.
- W. Hu, “Real-Time Twitter Sentiment toward Midterm Exams,” Sociology Mind, Vol. 2, No. 2, 2012, pp. 177- 184. doi:10.4236/sm.2012.22023