Open Journal of Accounting
Vol.07 No.01(2018), Article ID:81795,31 pages
10.4236/ojacct.2018.71004
Big N and Non-Big N Audit Pricing Competitiveness in Japan during Transition from Big 4 to Big 3 Period
Frendy
Graduate School of Economics, Nagoya University, Nagoya, Japan

Copyright © 2018 by author and Scientific Research Publishing Inc.
This work is licensed under the Creative Commons Attribution-NonCommercial International License (CC BY-NC 4.0).
http://creativecommons.org/licenses/by-nc/4.0/


Received: November 29, 2017; Accepted: January 14, 2018; Published: January 17, 2018
ABSTRACT
The 2006 dissolution of PwC ChuoAoyama significantly changed market share composition of Japanese audit firms which marked the transition from Big 4 period to Big 3 period. This study aims to investigate audit market pricing competitiveness between Big N and non-Big N auditors using a sample of Japanese firms listed in the First Section of Tokyo Stock Exchange during the transition from Big 4 period (2004-2005) to Big 3 period (2006-2011). This paper analyzes audit market pricing competitiveness between Big N and non-Big N auditors by employing panel fixed effects multivariate regression with audit fee as the dependent variable and interaction between audit fee premium and client segment size as variable of interest while controlling for other variables affecting audit fee. The empirical results indicate a non-competitive audit pricing market between Big N and non-Big N auditors where Big N auditors earn increasingly higher audit fee as client segment size becomes larger.
Keywords:
Client Segment Size, Audit Market Competition, Audit Fee, Big N, Japan

1. Introduction
In April 2005, one client of ChuoAoyama―the PwC affiliated audit firm in Japan―committed the then largest accounting fraud in Japan [1] . In an effort to restore its reputation, PwC splits ChuoAoyama into two firms in May 2006: Misuzu and Aarata. Misuzu was later dissolved in 2007 because one of its clients was involved in an accounting fraud. Aarata continues to operate as a smaller and high-quality PwC affiliate in Japan. The market exit of both PwC Misuzu and PwC ChuoAoyama reduced auditor choice for Japanese clients which have significant implications for auditor competition. Although Big 4 audit firms still hold the largest audit share in Japanese market as a group, the 2007 total audit fee income data revealed that PwC Aarata (PwC ChuoAoyama successor firm)’s market share is less than one-third of the third largest Japanese Big 4 affiliated firms [2] . This event significantly changed the structure of the Japanese large audit market from the Big 4 period (2004-2005) to the Big 3 period (2006 onwards). There is a significant concern that Japanese audit market is becoming less competitive following such a significant market disruption, which is commonly caused by a merger or exit of one of Big N1 auditors. When one of the Big N auditors leaves the market, the issue of auditor concentration becomes more important as large listed companies have more limited choices for audit service.
A number of influential regulators and organizations have expressed concern over the adverse effect on audit market competition in an event of a hypothetical scenario if one of the Big 4 auditors experienced an unexpected market exit [3] [4] [5] [6] . A highly concentrated audit market has a high systemic risk and the collapse of a dominant firm could disrupt the whole audit market [7] . OECD warns regulators that there is a risk that another significant event could dismantle another Big N firms and raise concentration in the audit market [8] . The loss of another large firm would further reduce large companies’ auditor choice and negatively affect audit fee competitiveness [9] .
Adverse effects of a highly concentrated audit market where a few large auditors have large market power include: limited incentives for auditors to innovate and provide superior audit quality, large audit firms become too-big-to-fail rendering audit regulations to be ineffective and higher audit prices without corresponding increase in audit quality [10] [11] [12] . U.S., U.K. & European regulators expressed their concern that the market dominance of Big 4 firms might adversely affect audit quality due to lack of competition [13] . The lack of market competition might also motivate audit regulators to overregulate audit market as a justification to artificially promote competition [14] .
Following the market exit of both PwC Misuzu and ChuoAoyama, Japanese Big N audit market has a much higher market share concentration (over 90% market share) for the large public firms’ market segment compared to other developed economies, as illustrated in Figure 1. Thus, the question of whether audit market pricing competitiveness is affected during the audit market transition from the Big 4 period (2004-2005) to Big 3 period (2006 onwards) is an important research question to pursue, especially in the context of the highly concentrated Japanese audit market.
This study is interested in investigating audit pricing competitiveness between Big N and non-Big N auditors in Japan. Although market share of Japanese Big N
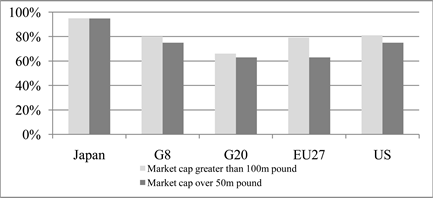 Notes: G8, G20, EU27, and U.S. data is cited from European Commission (2011) and Japanese Big N market share represents the cumulative market share (based on audit fee) of Deloitte Touche Tohmatsu, E & Y Shin Nihon, KPMG AZSA, and PwC Aarata. The number of Japanese listed firms in fiscal year 2010 was 1969 firms.
Figure 1. International Big N Audit Firms’ Market Share in 2010.
firms (based on average client numbers per fiscal year) in the Big 3 period (2006-2011) declined by 4.45% compared to the prior Big 4 period (2004-2005); non-Big N firms’ market share (based on average client numbers per fiscal year) increased by 21.42% in the same period (based on author’s calculation). In addition, prior empirical research investigating predictors of audit quality in Japan find that auditor size is not associated with audit quality [15] [16] [17] . The lack of association between audit quality and auditor size reduces the capacity for Japanese large auditors to differentiate their audit service using high quality audit. Prior study on the Japanese investors’ market reaction shows that the reputations of large auditors affiliated with Olympus were not affected by the publication of negative news surrounding the revelation of the Olympus fraud [18] ; indicating that Japanese investors have a low audit quality expectation for large auditors. The combination of the declining Big N firms market share, the rising non-Big N auditors’ market share, weaker audit service differentiation of large auditors, and low audit quality expectation for large auditors contribute to greater likelihood for Japanese Big N and non-Big N auditors to compete for clients. Those factors motivate this study to examine audit pricing competitiveness between Big N and non-Big N auditors in Japan.
Audit market pricing competitiveness between large (Big N) and small (non-Big N) audit firms is inferred as a function of Big N fee premium and audit clients’ segment size on audit fee. Big N audit fee premium is defined as additional audit fee paid by clients of one of the Big N firms that the clients otherwise would not pay to non-Big N auditors [19] . The audit market for small size clients represents a yardstick for a price-competitive audit market because the demands for audit service from a large number of small clients has low barrier to entry that can be provided by a large number of auditors. Audit market pricing between Big N and non-Big N auditors is competitive when Big N auditors differentiate their service to justify the Big N fee premium in both large and small client segments [19] [20] . Thus, audit market competitiveness between Big N and non-Big N auditors can be inferred from the differential Big N audit fee premium between large and small client market segments [19] [20] [21] .
The estimation results of the multivariate panel fixed effect regression models indicate a non-competitively priced audit market between Big N and non-Big N auditors as Big N firms receive a disproportionally higher audit fee premium as the client size increases. In addition, this study investigates whether the Big N audit fee premium is differentially affected by the transition from Big 4 period (2004-2006) to Big 3 period (2007-2011) following the demise of PwC ChuoAoyama that significantly changed the Japanese audit market structure (refer to Figure 2). Chen et al. (2007) argue that the audit fee premium could provide a measure of market power or competition in a market where the dynamics of audit supply and demand have not reached equilibrium in a short run [22] , like during the transition from Big 4 to Big 3 period. The difference-in-difference analysis results show that the transition from Big 4 to Big 3 period contributes to a less competitive audit pricing between Big N and non-Big N auditors. Prior empirical study in Japan has shown that Japanese listed firms are concerned with the good reputation of their auditors [1] . Thus, the higher reputation and brand recognition of Japanese Big N firms can be leveraged to negotiate higher audit fees with their clients, which contribute to the non-competitive audit pricing between Big N and non-Big N auditors.
A number of sensitivity analyses (auditor self-selection control, year-by-year analysis and reduced sample analysis) are performed to ensure the robustness of the audit fee regression models. To the best of my knowledge, there has been no empirical research investigating audit pricing competitiveness between Big N and non-Big N firms during the transition from Big 4 period to Big 3 period in Japan. This paper presents important empirical evidence for the Japanese and international accounting standard setters and regulators to consider when discussing the potential implication future policies regarding regulation or deregulation of competition in the audit market. Although market competition regulators have passed mergers proposal of large auditors in the past; regulators should carefully consider the adverse effects of future merger proposals or potential demise of existing Big N auditors on audit market competition.
The remainder of the paper is organized as follows. In Section 2, prior literatures on international and Japanese audit market structure, market competition, and audit fee premium are discussed. Section 3 develops hypotheses related to audit pricing competition between Big N and Non-Big N Auditors and audit pricing competition among individual firms at the industry level. Section 4 discusses audit fee regression models related to the hypotheses, control variables, industry level audit market concentration measures, and sample selection process. In Section 5, descriptive statistics and estimation results of the multivariate panel fixed effect regressions models related to the hypotheses are evaluated. Section 6 presents the results of the sensitivity analyses and Section 7 concludes the paper.
2. Literature Review
2.1. Audit Market Pricing Competitiveness: Big N Audit Fee Premium and Audit Fee
Audit service market for public companies has three characteristics that differentiate it from other professional services market: capital market transparency, mandated demand, and concentrated supply [3] . Unlike other professional service industries, audit services are artificially mandated by government regulations which are subsequently subjected to the supply and demand forces of the market [23] . Audit services is considered as differentiated service market due to the following factors: publicly listed firms can choose among several providers of audit services, audit service is not perfect substitutes and audit firms differentiate each other in terms such as technology, training, culture, management structure, and international networks. Audit clients are informed buyers of the professional service market and they consider how the attributes of each audit firm can provide them with the best net value for a given audit fee [3] . Thus, auditors in differentiated audit service market can earn fee premium if their clients are willing to pay higher fee that the clients otherwise would not pay to other auditors.
Auditors that have established brands and large scale of operation such as Big N firms are more likely to charge higher audit fee and enjoy positive audit fee premium over non-Big N auditors. Big N audit fee premium is defined as additional audit fee paid by clients of one of the Big N firms that the clients otherwise would not pay to non-Big N auditors [19] . In a competitive audit market, auditors with superior service differentiation systematically charge higher fee for all their clients irrespective of their clients’ size [24] . Audit market is competitive when Big N auditors differentiate their service to justify their fee premium in both large and small client segments [20] . On the other hand, audit market is not competitive when Big N firms charge higher fees in the large client market relative to smaller market segment [19] . In a seminal paper on audit market competition, Simunic (1980) examines audit fee premium for small and large clients segments and finds no overall premium for either group, consistent with the price competitive market and product differentiation hypothesis [21] . Simunic finds evidence of competitive Big N audit market when audit fee of Big N auditors is lower than audit fee charged by non-Big N firms. Overall, prior empirical and theoretical research investigating audit market competition in the wake of prior Big N mergers and market exit has produced mixed results.
2.2. Japanese Audit Market Transition from Big 4 to Big 3 Period
Japanese audit market changed dramatically in 2006 following the dissolution of PwC ChuoAoyama. The figure tracks the market share trend among the Japanese large audit firms from 2004 to 2011. Figure 2 shows that the aggregate market share of PwC affiliated firms in Japan decreased significantly from 21.68% in 2005 to 11.96% in the following year. Around a quarter of former ChuoAoyama’s clients switched to new auditors [1] . As a result, PwC Aarata’s (PwC ChuoAoyama successor firm) market share in 2007 is less than one-third of the third largest Japanese Big 4 affiliated firms [2] and Figure 2 supports Fukukawa’s result. Thus, this research set the cutoff period between the Big 4 and Big 3 period between 2005 and 2006, where Big 4 period consists of fiscal year 2004 and 2005 and Big 3 period begins from fiscal year 2006 onwards. The cut-off period from the Big 4 to Big 3 period illustrated in Figure 2 is consistent with prior research that investigated Japanese audit market using the Big 3 period [2] [25] .
PwC ChuoAoyama’s audit failure in the Kanebo fraud in 2006 forced the Japanese Financial Services Agency (FSA) to suspend ChuoAoyama’s operation for two months in May 2006. Following the suspension, PwC International divided the firm into two separate entities to salvage the reputation of its Japanese affiliate following the scandal. The first firm, Misuzu, is a rebranded ChuoAoyama. Eventually, PwC Misuzu is disbanded in July 2007 due to another accounting fraud committed by one of its major client, Nikko Cordial [26] . The demise Misuzu further reduced the market share PwC affiliated Japanese firm (PwC Aarata) to only 4.39% in fiscal year 2007. The second higher quality PwC affiliate is named Aarata where it continues to retain former multinational clients of ChuoAoyama.
Skinner and Srinivasan (2012) examine the effect of the scandal on Japanese auditor reputation by examining client switching following the uncovering of the fraud [1] . Skinner and Srinivasan show that around a quarter of ChuoAoyama’s clients switch auditor, where firms with greater demand for audit quality such as larger size firms with greater growth potential were firms who were more likely
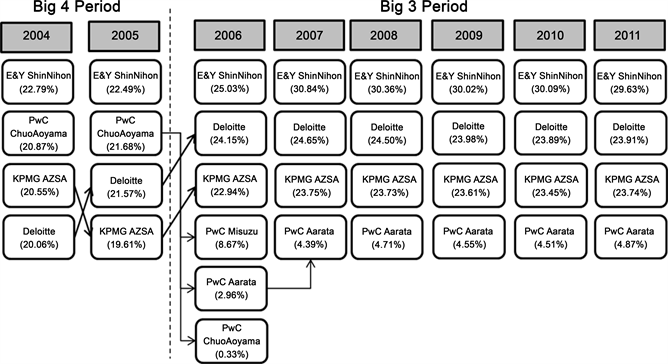
Figure 2. Market Share (Client Number) Development of the Largest Japanese Auditors (2004-2011).
to make the transition. Approximately 75 percent of the former CPAs, staffs and clients of PwC ChuoAoyama transferred to the other Big 3 firms [2] .
3. Hypotheses Development
3.1. Audit Market Pricing Competition between Big N and Non-Big N Auditors
The size and industry diversity of audit clients requires auditors to tailor their audit services to meet the varied demand of their clients. Audit market pricing competitiveness between large (Big N) and small (non-Big N) audit firms is a function of the audit clients’ segment size. Audit market serves two different market segments with specific market characteristics: audit services for listed and large companies and audit services for small and medium-sized companies [27] . Large audit firms have more incentives to attract large clients segment due to the higher fixed costs and audit planning costs compared to smaller audit firms [28] . Big N auditors also invest more in technology, staff training and support facilities [29] ; which allow them to perform more efficient audit for larger and more complex clients. Large clients market segment, such as multinational companies with many international subsidiaries, demand audit service which can only be provided by large auditors with experience auditing large clients and extensive international network of affiliated firms. In the small clients market segment, auditees can select and purchase services from a large number of auditors (large, mid-size, and small auditors) where auditors are not constrained by the high requirement of resource or expertise needed to service larger auditees [21] .
Although market share of Japanese Big N firms (based on average client numbers per fiscal year) in the Big 3 period (2006-2011) declined by 4.45% compared to the prior Big 4 period (2004-2005); non-Big N firms’ market share (based on average client numbers per fiscal year) increased by 21.42% in the same period (based on author’s calculation). Yoshida (2008) argues that audit quality measured by discretionary accruals is not strongly associated with auditors’ size in Japan due to low litigation risk and inadequate internal control of the Big N auditors [17] . Yamaguchi (2013) employ propensity score matching method and conclude that audit firm size is not associated with the accuracy of analyst forecasts [16] . A more comprehensive study on audit quality predictors in Japan also concludes that auditor size is not associated with audit quality [15] . The lack of association between audit quality and auditor size reduces the capacity for Japanese large auditors to differentiate their audit service using high quality audit. Prior study on the Japanese investors’ market reaction shows that the reputations of large auditors affiliated with Olympus were not affected by the publication of negative news surrounding the revelation of the Olympus fraud [18] ; suggesting that Japanese investors have a low audit quality expectation for large auditors. The combination of the declining Big N firms market share, the rising non-Big N auditors’ market share, weaker audit service differentiation of large auditors, and low audit quality expectation for large auditors contribute to greater likelihood for Japanese Big N and non-Big N auditors to compete for clients.
Empirical evidence on the state of competition in the audit market can be further inferred from the difference in the “average cost residuals” or audit fee premium between Big N and non-Big N for both small and large client market segment [21] . Big N audit fee premium is defined as additional audit fee paid by clients of one of the Big N firms that the clients otherwise would not pay to non-Big N auditors [19] . Simunic’s audit pricing model assumes that all auditors ―irrespective of their size―engage in competitive pricing in the small client market segment. The audit market for small size clients represents a yardstick for a price-competitive audit market because the demands for audit service from a large number of small clients has low barrier to entry that can be provided by a large number of auditors. Consequently, audit market competitiveness between Big N and non-Big N auditors can be inferred from the differential Big N audit fee premium between large and small clients’ market segments [19] [20] [21] .
When client segment size is taken into consideration, pricing between Big N and non-Big N auditors is regarded to be competitive if Big N firms earn consistent fee premium through audit service differentiation that does not vary with the size of clients [19] . However, audit pricing between Big N and non-Big N auditors is considered to be not competitive if Big N auditors earn higher fee premium in the large clients segment compared to the fee premium earned in the small clients segment. In other words, an increasing audit pricing gap between Big N and non-Big N auditors (Big N fee premium) as the client size increases indicates a non-competitive audit pricing between Big N and non-Big N auditors.
Thus, the argument for a non-competitive audit market between Big N and non-Big N auditors can be expressed in the following alternative H1:
H1: Audit fee is positively associated with the interaction variable between Big N fee premium and client segment size, other things being equal.
3.2. Audit Market Pricing Competition between Big N and Non Big N Auditors Following the Transition from Big 4 to Big 3 Period
The transition from Big 4 to the Big 3 period in the Japanese market is indicated with the dissolution of PwC ChuoAoyama into a smaller PwC Aarata. Around a quarter of former ChuoAoyama’s clients switched to new auditors [1] . As a result, PwC Aarata’s (PwC ChuoAoyama successor firm) market share in 2007 is less than one-third of the third largest Japanese Big 4 affiliated firms [2] . This event marks the transition from Big 4 to Big 3 period in Japan that is demonstrated with the simultaneous decline of Big N market share and the surge of non-Big N firms’ market share (based on author’s calculation).
Large clients market segment, such as multinational companies with many international subsidiaries, demand audit service which can only be provided by large auditors with experience auditing large clients and extensive international network of affiliated firms. Thus, the unexpected market exit of PwC ChuoAoyama is more likely to disproportionately affect the large audit clients segment due to the short term disruption of Big N market supply. Chen et al. (2007) argue that the audit fee premium provides a measure of market power or competition in a market where the dynamics of audit supply and demand have not reached equilibrium, such as during the transition from Big 4 to Big 3 period [22] . Carson et al. (2012) investigate the transition from the Big 6 to the Big 4 auditors in Australia and find a reduced level of competition in the audit market which is inferred by the disproportionate increase in audit fee premium [30] . Thus, we argue that audit market becomes less competitively priced if audit fee is positively associated with Big N audit fee premium following the transition from Big 4 to Big 3 period in the following alternative H2:
H2: Audit fee is positively associated with the interaction variable between Big N fee premium and audit market transition from Big 4 period (2004-2005) to Big 3 period (2006-2011), other things being equal.
4. Research Method
4.1. Audit Market Pricing Competition between Big N & Non-Big N Auditors: Audit Fee Premium Model
Audit fee premium is defined as the difference between what a client with an incumbent Big N auditor would pay for an equivalent non-Big N audit [30] . This study employs audit fee premium, instead of nominal audit fee, as a measure of as a measure of Big N audit pricing competitiveness and market power. Studies employing audit fee premium provides evidence about the competitiveness of the market for audit services by measuring market domination for audit services provided by Big N auditors and whether higher audit fees can be justified with higher quality audits [22] . By controlling audit fee quality in the audit fee regression model, audit fee premium provides a measure of auditor’s market power.
Audit fee is a function of audit unit price multiplied by the quantity of audit services, thus an audit fee model that explain audit competition should control for the determinants of audit quantity and price [21] . The modified Simunic’s (1980) audit pricing log-level regression model is employed where large auditors’ fee premium is proxied by the FeePrem dummy variable2 [21] . The FeePrem variable of interest is then regressed on the natural log of audit fees (AF variable) while controlling for other audit fee determinants [19] . The Big3Per dummy variable takes the value of one if the firm-year sample took place between fiscal year 2006 to 2011 (Big 3 period), and zero if the audit firm-year sample took place between fiscal year 2004 to 2005 (Big 4 period). This paper employ various variables (client’s, auditor’s and audit engagement’s attributes) that control for the audit quality and risk premium explanations on audit fee so that the fee premium variable measures Big N audit pricing competitiveness.
This study measures audit market pricing competitiveness across markets segmented by client size and industry groups. Following Hamilton et al. (2008), clients market segment is measured by the ClientSeg dummy variable, where it takes the value of one if the client’s median total assets belong to the upper half (>50th percentile) of the industry-year sample, and zero otherwise [19] . Thus, large and small audit client segments are represented by the ClientSeg value of one and zero, respectively.
Audit fee regression model in Equation (1) is a function of audit fee premium (FeePrem) while controlling for clients’, auditors’ and audit engagements’ attributes. Panel data regression estimate that considers both cross sectional (companies) and time series (fiscal year) dimensions of the data is employed. Panel data estimated model can better cope with the problem of unobserved time-invariant heterogeneity in cross-sectional models [31] . In order to determine which type of panel data estimators (ordinary least square/OLS, random, fixed, or time-fixed effect) that are appropriate for the sample; Lagrange Multiplier test, F test, and Hausman test are performed on the audit fee regression model [32] . The results of those tests support the use of fixed effect panel regression model to control for time-invariant omitted firm-specific variables that are correlated with variables in the regression model.
Hypothesis 1 described in Section 3.1 argues that pricing between Big N and non-Big N auditors is regarded to be competitive if Big N firms earn consistent fee premium through audit service differentiation that does not vary with the size of clients [19] . However, audit pricing between Big N and non-Big N auditors is considered to be not competitive if Big N auditors earn higher fee premium in the large clients segment compared to the fee premium earned in the small clients segment. Thus, a positive association between audit fee (dependent variable) and the interaction variable between Big N fee premium and client segment size (variable of interest) indicates an increasing audit pricing gap between Big N and non-Big N auditors (Big N fee premium) as the client size increases. Thus, a statistically significant and positive estimate of the FeePrem and ClientSeg interaction variable (α4 coefficient) in the following Equation 1 indicates a non-competitive audit pricing market between Big N and non-Big N auditors.
Year and industry dummy variables are employed so that the regression estimates results are less likely to be affected by contemporaneous changes in regulatory measures and other omitted time and industry level variables that affect audit pricing [33] . The following panel fixed-effect ordinary least squares (OLS) regression model is estimated after correcting for heteroscedastic standard errors (regression control variables are defined in Table 1):
(1)
where:
= natural log of total audit fee paid by client i at time t, which consists of fee paid to the client’s external auditor for financial statement audit of parent company and consolidated subsidiaries.
= dummy variable equals to 1 if client i at time t is audited by one of the Japanese auditors affiliated with the global Big 4 audit firms networks (Deloitte Touche Tohmatsu, E&Y Shin Nihon, KPMG AZSA, PwC Aarata, PwC Chuo Aoyama, and PwC Misuzu), and 0 otherwise.
= dummy variable equals to 1 if the audit client i at time t took place during the Big 3 period (2006-2011), and 0 otherwise.
= dummy variable equals to 1 if the median total assets of client i at time t belong to the upper half (>50th percentile) of the industry-year sample, and 0 otherwise.
= audit fee control variable j for client i at time t as listed in Table 1.
4.2. Audit Market Pricing Competition between Big N & Non-Big N Auditors Following the Transition from Big 4 to Big 3 Period: Difference-in-Difference Analysis
The pre and post treatment approach is a subset of difference-in-difference (DiD) analysis commonly used in empirical research to estimate the effects of certain policy interventions and policy changes that affect the population groups in a different way [34] . Thus, we identify the treatment and control group for both the post and pre-treatment period to estimate whether the transition from Big 4 to Big 3 period affects Big N and non-Big N audit pricing competitiveness that is inferred by the association between Big N audit fee premium and audit fee.
The treatment and control group is denoted by the auditor size dummy variable (FeePrem). The control group is represented by client of non-Big N auditors that is assigned with dummy value of 0 for the FeePrem variable. Accordingly, the treatment group consists of client of Big N auditors whose audit market is directly affected by the transition from Big 4 to Big 3 period where its FeePrem variable is assigned with the value of 1.
The pre and post treatment variable is defined as the Big N period dummy variable (Big3Per). Pre-treatment period is represented by the Big3Per value of 0 where it represents fiscal year 2004 and 2005 during which the audit market is dominated by Big 4 firms before the audit market transition. Post-treatment period represents time period after Big 3 audit firms dominate the audit market from fiscal year 2006 to 2011 where it is denoted with the Big3Per value of 1. The interaction between FeePrem and Big3Per measures the differences between audit fee paid by clients of non-Big N firms (control group) and clients of Big N firms (treatment group) following the audit market transition from Big 4 period (pre-treatment) to Big 3 period (post-treatment).
The regression estimate of the difference-in-difference interaction variable between FeePrem and Big3Per (α4 coefficient) in the following Equation (2) captures how the association between audit fee and Big N fee premium is differentially affected by the audit market transition from Big 4 to Big 3 period. Hypothesis 2 described in Section 3.2 argues that audit market becomes less competitively priced if audit fee is positively associated with Big N audit fee premium following the transition from Big 4 to Big 3 period. Thus, a statistically significant positive difference-in-difference α4 coefficient indicates a less competitive audit pricing market following Big 4 to Big 3 transition where Big N fee premium is increasing as Big N audit market becomes more concentrated in the Big 3 period.
We modify prior Equation (1) by replacing the ClientSeg interaction variable with the treatment period dummy variable (Big3Per) to estimate the difference-in-difference coefficient (α4 coefficient), as shown in the following Equation 2 (variables are defined in Table 1):
(2)
where:
= natural log of total audit fee paid by client i at time t, which consists of fee paid to the client’s external auditor for financial statement audit of parent company and consolidated subsidiaries.
= dummy variable equals to 1 if client i at time t is audited by one of the Japanese auditors affiliated with the global Big 4 audit firms networks (Deloitte Touche Tohmatsu, E&Y Shin Nihon, KPMG AZSA, PwC Aarata, PwC Chuo Aoyama, and PwC Misuzu), and 0 otherwise.
= dummy variable equals to 1 if the audit client i at time t took place during the Big 3 period (2006-2011), and 0 otherwise.
= dummy variable equals to 1 if the median total assets of client i at time t belong to the upper half (>50th percentile) of the industry-year sample, and 0 otherwise.
= audit fee control variable j for client i at time t as listed in Table 1.
4.3. Audit Fee Determinants and Control Variables
Consistent with prior audit fee studies; client’s attributes (client size, business complexity, risk, and accounting standards), auditor’s attributes (audit staff number, audit tenure period, non-audit fee and industry specialization), and audit engagement’s attributes (audit opinion, audit quality, client’s bargaining power, auditor industry dominance, competitor distance, and exogenous events) are controlled in the audit fee regression models [2] [20] [21] .
The following client’s attributes variables are controlled: client size, business complexity, risk, and accounting standards. Client size effect explains most of the variation in audit fees between clients [20] [21] . This paper calculates the client size effect using natural log of the client’s total assets (TA variable). Relative audit market size can also moderate the relationship between market concentration and audit pricing. Thus, the client’s relative size to its industry is measured using the ratio of the client’s total assets to total assets of companies within the industry-year (IndPTA variable). Complexity of the client’s operation is controlled by including the natural log of number of consolidated subsidiaries (SUBS variable) and foreign sales calculated by the ratio of the auditee’s overseas sales to net sales at year-end (FORN variable). In addition, a number of client’s business and financial risk determinants are controlled: accounting rate of return in the current year that is measured by the ratio of net income to total assets at year-end (ROI variable), assets liquidity that is calculated by the ratio of current assets (less inventories) to current liabilities (LIQ variable), debt leverage that is measured by the ratio of total liabilities to total equity (LEV variable), and loss dummy variable where it has a value of one if an auditee had incurred a net loss in prior fiscal year, and zero otherwise (LOSS variable). Companies that employ non-Japanese GAAP accounting standards (US GAAP and IFRS) are more likely to pay audit fee premium for the auditors’ expertise in auditing U.S. GAAP or IFRS-based financial statements. Thus, the GAAP dummy variable is employed, where it has a value of one if an auditee is a SEC registrant or an IFRS adopter, and zero otherwise.
The following auditor’s attributes determinants on audit fee are controlled: audit staff number, audit tenure period, non-audit fee and industry specialization. The number of audit staff working on the audit engagement is employed to control for one of the major determinants of audit fee and audit effort. Carson et al. (2014) argue that the observed increase of audit fees in Australian from 2000-2011 might be driven by higher audit effort that is driven by the global financial crisis and more stringent regulations [20] . Following Kim and Fukukawa (2013), the unique dataset of Japanese firms disclosure information is employed and natural log of number of CPAs, junior accountants and other staffs employed in the audit engagement (excluding engagement partners) is calculated (TEAM variable) [25] . Auditors are expected to experience a learning effect when provide audit service to the same clients for a number of years that reduces cumulative average audit costs [21] . The audit learning effect is captured in the audit fee model by measuring the number of years an auditee has hired its current auditor (TENR variable). The non-audit fee (NAF variable) is measured by the natural log of total non-audit fee paid by the client to its current year auditor.
AISpec variable is included as a continuous measure of audit industry specialization that is calculated as the auditor market share within the industry-year (based on client number). Following Cahan et al. (2008), the auditor market dominance (DOMN variable) measures auditors’ dispersion in each of the industries classification of the Tokyo Stock Exchange (TSE) New Industry Code [35] . DOMN represents the market dominance of an auditor as it obtained more clients in the industry. DOMN equals zero if all auditors have the same amount of clients within an industry.
Audit engagement’s attributes are controlled by including audit opinion (AOP variable), audit quality (ACC variable), the client’s bargaining power (POW variable) and competitor distance (DIST variable) variables in the audit fee model. AOP represents the audit opinion dummy variable where a value of one if an auditee receives a modified audit opinion or worse, and zero if the auditee receives an unqualified audit opinion with additional notes or better. To complement AOP, discretionary accruals (ACC) are employed as a continuous measure of audit quality. ACC represents absolute value of total discretionary accruals estimated using the following modified Jones (1991) model that is also adopted by Skinner and Srinivasan (2012) [1] .
POW variable is associated with the relative client’s bargaining power by measuring the relative size of the client’s audit fee relative to the sum of the auditor’s total audit fee received from all its clients in the industry [36] . Audit clients that have larger reputational capital at risk are willing to pay higher audit fee. POW is calculated as the audit fee paid divided by the sum of total audit fee earned by that particular company’s auditor within an industry.
Numan and Willekens (2012) find that audit fee is higher when the industry market share distance to its next closest competitor increases [37] . The competitor distance (DIST) variable measures the leading auditor’s relative industry market share distance to closest competitor. DIST is calculated as the smallest absolute audit market share (based on client number) difference between audit leader and its closest competitor within an industry.
Lastly, the effect of exogenous global financial crisis and major change in regulations that might affect audit fee are controlled. A dummy variable GFC takes the value of 1 to denote fiscal year 2008 as the period of the global financial crisis. Major regulation changes during the observation periods that might increase audit fee in Japan. The amendment of the Financial Instruments and Exchange Act (FIEA) introduced two major changes to financial reporting that have the potential to increase audit fee [38] . First, management is responsible to assess its internal control over financial reporting and external auditors are responsible to audit the management’s assessment of its internal control. Second, listed firms are required to report auditor reviewed quarterly financial statements. The amendment of the Japanese Financial Instruments and Exchange Act emulates the Sarbanes-Oxley Act of 2002 in US that requires external auditors to evaluate the adequacy of management’s internal control on financial reporting. Thus, Japanese auditors are expected to increase their audit fee to account for higher audit efforts required to comply with the more stringent regulations following the amendment of the FIEA and stricter JICPA self-regulations. REG dummy variable takes the value of 1 to denote fiscal year 2007 as the fiscal year prior to the effective date of FIEA.
The variables used in audit fee premium (Equation (1) and Equation (2)) regression models are summarized in Table 1. Definition, measurement and expected sign of control variables and industry level audit market concentration variables are discussed in more details in the prior sections.
4.4. Sample Selection
Japanese companies publicly listed in the First Section of the Tokyo Stock Exchange

Table 1. Variables included in the audit fee premium and the audit market concentration regression models.
(TSE) from fiscal year 2004 to 2011 are employed as the sample of this study. The observation period for the Big 3 period is limited to fiscal year 2011 as additional sample years might aggravate the imbalanced sample between Big 4 period (two fiscal years: 2004-2005) and Big 3 period (six fiscal years: 2006-2011). All of the audit fee and control variables data are obtained from the Nikkei Economic Electronic Database Systems (NEEDS) FinancialQUEST and Japanese securities filings information (yukashoken hokokusho) extracted from the eol database. Most Japanese companies end their fiscal year on March 31. Thus the fiscal year ended March 31, 2004 is considered as fiscal year 2003 or FY2003, consistent with prior literature [1] . Prior to the 2004 CPA Law amendment, the Japanese Institute of Certified Public Accountants (JICPA) issued a standard audit fees table that put substantive upper limits on audit fees payable to auditors. After the amendment, audit fees are expected to increase to market equilibrium [39] . The observation period of this study begins from fiscal year 2004 due to audit fee data availability and controlling for the effect of revised regulations on audit fee.
Japanese auditors are allowed to perform joint audit engagement with a single client where each firm formulates policies and procedures with regard to joint audits in its audit manuals, pursuant to Auditing Standards Board Report No. 12 of The Japanese Institute of Certified Public Accountants (JICPA) [40] . Joint audit is excluded from the sample because each firm has different fee structure and audit engagement process that can confound the audit fee analyses. Observations that have less than ten listed companies within an industry-year group are excluded to control for small sample bias so that the sample size within an industry- year is sufficiently large [41] . The disproportionate market power of Big N firms on smaller industries is controlled by excluding those small sample observations [33] . Firms from banking, insurance, finance, and security industries are excluded to control for the distinct financial reporting and regulatory frameworks of financial firms.
The sample selection process is shown in Table 2. The initial sample of eight years fiscal period consists of 22,824 firm-year observations, which are then reduced to 16,563 firm-year observations after firms with missing audit fee and regression control variables are excluded. 184 and 164 observations are excluded to control for joint audit and small sample effect, respectively. Lastly, 905 firm-year observations from financial firms are also excluded. The final sample
Table 2. Selection and Distribution of Sample Firms.
consists of 15,310 firm-year observations which represent 2157 unique companies.
5. Regression Models Descriptive Statistics and Estimation Results
Table 3 shows sample size and audit fee statistics for the sample. The final sample (15,310 firm-years observation) selection process is described in details in Table 2. Mean (median) audit fee from 2004-2011 is 77.03 (42) million yen. Mean audit fee after the transition to the Big 3 period (2006-2011) is higher than the Big 4 period (2004-2005) (79.52 million yen compared to 68.09 million yen) which is statistically significant at 5% level (p value = 0.012).
The highest peak of audit fee in 2007 can be attributed to more stringent accounting and auditing regulations following the amendment of Financial Instruments and Exchange Law and stricter JICPA self-regulations [39] . Audit fee returns to a lower equilibrium as a response from clients’ pressure to decrease audit fee after the 2007 audit fee hike [42] .
Table 4 shows the descriptive statistics of control variables employed in the
Table 3. Sample Size, Number of Audit Firms and Audit Fee Descriptive Statistics.
Table 4. Descriptive Statistics of Control Variables (2004-2011).
The table provides the mean and standard deviation of the independent variables included in the regression models categorized by all observation period, auditor size and client size. Notes: aBig N firms include Deloitte Touche Tohmatsu, E&Y Shin Nihon, KPMG AZSA, PwC Aarata, PwC Chuo Aoyama, and PwC Misuzu. bMid-tier firms include unaffiliated and mid-tier local audit firms affiliated with BDO International, Grant Thornton International, Kreston International, NEXIA International, Baker Tilly International, Crowe Horwath, PKF International, Plante & Moran, RSM International, and TIAG (The International Accounting Group). cA client is categorized as large client if the median total assets belong to the upper half (>50th percentile) of the industry- year sample. dA client is categorized as small client if the median total assets belong to the lower half (<50th percentile) of the industry-year sample. Definitions of the independent variables are described in Table 4.1.a. Sample of a Table footnote (Table footnote is dispensable).
regression analyses over the observation period. The untabulated average mean (median) non-audit fee (NAF) is 2.52 (0) million yen. This figures shows that it is uncommon for auditors of Japanese listed firms to perform non-audit services. The non-audit services are commonly provided by Big N firms to their large size audit clients. The ratio of non-audit fee to audit fee paid by Japanese listed firms are extremely small (3.17%) when compared to other developed country that has similar audit and legal environment to Japan. In German audit market, the non-audit fee amount to 41.9% of the total fee paid to auditors and is considered to be as important as audit fee [43] .
Only 250 firm-years (1.63% of total sample which consists of 39 unique companies) employ non-Japanese accounting standards (SEC registrants or IFRS). The mean (median) audit fee paid by clients who adopt non-Japanese accounting standards (SEC registrants or IFRS) is 1040.63 million yen (530 million yen). These figures are significantly higher than audit fee paid by clients who follow Japanese GAAP (J-GAAP) with a mean (median) fee of 61.03 million yen (41.8 million yen). The higher audit fee paid by adopters of non-Japanese accounting standards is consistent with prior study [39] . These results can be attributed to company and auditor size, as results from Table 4 show that non-Japanese GAAP adopters are more likely to be large size clients that employ Big N auditors.
To ensure that the multicollinearity problem does not introduce bias the regression results, the variance inflation factor (VIF) for the audit fee regression models is calculated. The VIF value of ten is generally considered as rules of thumb to indicate excessive or serious multi-collinearity [44] . Untabulated results show that the VIF of all the independent variables included in Equation (1) are lower than three. These results show that the regression estimates do not have a serious multicollinearity problem.
5.1. Audit Market Pricing Competition between Big N and Non-Big N Auditors
Table 5 presents the estimation results of the Big N audit fee premium regression model (Equation (1)) to test hypothesis 1 of whether there is a non-competitive pricing between Big N and non-Big N auditors. The coefficient of the FeePrem variable is positive and statistically significant, indicating that clients (regardless of client segment size) pay higher audit fee to large auditors during both the Big 4 and Big 3 periods after controlling for audit fees determinants. Using the economic significance measurement approach of Ferguson (2003) [45] 3, Big N auditors earn in average 26.46% higher audit fee (α1 coefficient in Equation (1)). The statistically significant negative estimate of ClientSeg variable (α2 coefficient in Equation (1)) indicate that large clients segment pays in average 8.48% lower audit fee.
The FeePrem interaction variable examine whether the higher audit fee paid to Big N auditors is differentially affected by client market segment (H1). The estimate of interaction variable between FeePrem and ClientSeg (α4 coefficient in Equation (1)) is positive and statistically significant, suggesting that Big N auditors receive higher fee as client size becomes larger. Hypothesis 1 argues that pricing between Big N and non-Big N auditors is regarded to be competitive if Big N firms earn consistent fee premium through audit service differentiation that does not vary with the size of clients [19] . However, audit pricing between Big N and non-Big N auditors is considered to be not competitive if Big N auditors earn
Table 5. Panel Fixed Effect Multivariate Regression Estimates for Equation 1 with Audit Fee (AF) as Dependent Variable.
*, ** and *** represent statistical significance at the 10%, 5%, and 1% level, respectively. The dependent variable is AF (natural log of total audit fee). Definitions of the independent variables are described in Table 1. Variable of interest relevant for the hypothesis is printed in bold.
higher fee premium in the large clients segment compared to the fee premium earned in the small clients segment.
The results of the regression estimate suggests a non-competitive audit pricing market between Big N and non-Big N auditors in which Big N auditors are paid 7.91% higher fee from their large clients pay compared to fee that small clients’ paid to their Big N or non-Big N auditors. The results from Table 5 support H1 alternative hypothesis which indicate a non-competitive audit pricing market between Big N and non-Big N auditors where Big N auditors are paid higher audit fee as client size increases, other things equal.
To complement the results of Table 5, Table 6 presents the estimation results
Table 6. Panel Fixed Effect Multivariate Regression Estimates for Equation (1) with Audit Fee (AF) as Dependent Variable: Client Segment Size Subsample.
*, ** and *** represent statistical significance at the 10%, 5%, and 1% level, respectively. The dependent variable is AF (natural log of total audit fee). Definitions of the independent variables are described in Table 1. Variable of interest relevant for the hypothesis is printed in bold.
of the audit market concentration regression model (Equation 1) using the client segment size subsample of large client segment (sample size = 7597 firm-years) and small client segment (sample size = 7713 firm-years) following [19] Using the economic significance measurement approach of Ferguson (2003) [45] , Big N auditors in large client segment earn in average 59.2% higher audit fee premium compared to non-Big N while Big N firms earn only 16.88% higher audit fee premium in small client segment. These results provide evidence of an increasing audit pricing gap between Big N and non-Big N auditors (Big N fee premium) as the client size increases. Hypothesis 1 argues that audit pricing between Big N and non-Big N auditors is considered to be not competitive if Big N auditors earn higher fee premium in the large clients segment compared to the fee premium earned in the small clients segment. Results of Table 6 support the conclusion of Table 5 that there is a non-competitive audit pricing market between Big N and non-Big N auditors.
5.2. Audit Market Pricing Competition between Big N and Non Big N Auditors Following the Transition from Big 4 to Big 3 Period
The difference-in-difference (DiD) interaction variable between FeePrem and Big3Per (α4 coefficient in Equation (2)) is positive and significant at 5%; providing empirical support of a non-competitive audit pricing market between Big N and non-Big N after the audit market transition. Hypothesis 2 argues that audit market becomes less competitively priced if audit fee is positively associated with Big N audit fee premium following the transition from Big 4 to Big 3 period. Using the economic significance measurement approach of [45] , the regression estimate indicates that Big N audit fee premium becomes slightly higher (3.56% higher) in the Big 3 period compared to prior Big 4 period. The results from Table 7 support H2 alternative hypothesis which indicate that the transition from Big 4 to Big 3 period contributes to a less competitively priced audit market between Big N and non-Big N auditors.
To complement the results of Table 7, Table 8 presents the estimation results of the audit market concentration regression model (Equation (1)) using the Big 4 and Big 3 period subsample of Big 4 period (sample size = 3335 firm-years) and Big 3 period (sample size = 11,975 firm-years) following [19] . Results from the Big 4 period (2004-2005) subsample shows a non-significant estimate of the FeePrem and ClientSeg interaction variable, suggesting that Big N audit fee does not vary with client segment size. Results from the Big 3 period (2006-2011) subsample shows a positive and significant estimate of the FeePrem and ClientSeg interaction variable, suggesting that a non-competitive audit pricing market between Big N and non-Big N auditors in which Big N auditors are paid 9.97% higher fee from their large clients pay compared to fee that small clients’ paid to their Big N or non-Big N auditors. Results of Table 8 support the conclusion of Table 7 that support H2 alternative hypothesis that the transition from Big 4 to Big 3 period contributes to a less competitively priced audit market between Big N and non-Big N auditors.
6. Sensitivity Analyses
6.1. Controlling for Auditor Self Selection
To control for auditor selectivity bias inherent in prior audit fee studies, the two-stage Heckman (1979) procedure is employed [46] . The Heckman (1979)
Table 7. Panel Fixed Effect Multivariate Regression Estimates for Equation (2) with Audit Fee (AF) as Dependent Variable.
*, ** and *** represent statistical significance at the 10%, 5%, and 1% level, respectively. The dependent variable is AF (natural log of total audit fee). Definitions of the independent variables are described in Table 1. Variable of interest relevant for the hypothesis is printed in bold.
Table 8. Panel Fixed Effect Multivariate Regression Estimates for Equation (1) with Audit Fee (AF) as Dependent Variable: Big 4 to Big 3 Period Transition Subsample.
*, ** and *** represent statistical significance at the 10%, 5%, and 1% level, respectively. The dependent variable is AF (natural log of total audit fee). Definitions of the independent variables are described in Table 1. Variable of interest relevant for the hypothesis is printed in bold.
procedure assumes that auditor size variable (BigN) is endogenous in the audit fee model where companies are not randomly assigned to audit firms and clients has the choice whether to hire large or small audit firms [47] . The two-stage Heckman method is conducted in the following two steps [22] . First, the following Big N auditor selection probit regression model based on [29] is estimated to generate inverse Mills ratios (λ0i and λ1i which represents inverse Mills ratio for non-Big N and Big N auditors for firm i, respectively):
(3)
where:
= dummy variable equals to 1 if the client is audited by one of the Japanese Big N auditors (Deloitte Touche Tohmatsu, E&Y Shin Nihon, KPMG AZSA, PwC Aarata, PwC Chuo Aoyama, and PwC Misuzu), and 0 otherwise.
= natural log of clients’ total assets.
= ratio of the client’s total liabilities to total equity.
= dummy variable equal to 1 if the client is a SEC registrant or an IFRS adopter, and 0 otherwise.
= ratio of the client’ current assets (less inventories) to current liabilities.
= ratio of the client’s overseas sales to net sales.
= ratio of the client’s net income to total assets.
= dummy variable equal to 1 if the client incurred a net loss in the previous fiscal year, and 0 otherwise.
The untabulated results from the probit model show that the likelihood ratios for Big N and non-Big N auditors are significant (p-value of chi-squared test is less than 0.01), which suggest that the probit model of Equation 3 can effectively differentiate between Big N and non-Big N auditors [22] . Next, the inverse Mills ratio (λ0i and λ1i) is included as an additional control variable in the audit fee premium regression model (Equations ((1) and (2))) correct for the auditor self- selection bias. The coefficient estimates of λ0i and λ1i allow the intercept and slope coefficients in the audit fee regression models to vary across Big N and non-Big N auditors [29] . The untabulated re-estimated results of the auditor self-selection regression models are qualitatively similar with the main findings, suggesting that the findings are not biased by auditor self-selection effect.
6.2. Other Sensitivity Analyses
Year-by-year analysis of the cross-sectional regression models (Equation (1)) is conducted to rule out the possibility that repeated observations in the cross-sectional regressions have inflated the significance of the coefficients [22] . The untabulated results are qualitatively consistent with prior results shown in Table 5.
The main regression models (Equation (1)) are re-estimated on a balanced set of sample which include four fiscal years period (Big 4 period sample from 2004 to 2005 and Big 3 period sample from 2006 to 2007). The 4-years balanced sample is comprised of 7172 firm-years. The findings on the audit pricing competitiveness among individual firms at the industry level are also mixed. However, these findings are conditional to the low value of the adjusted R-squared for Equation (1) using the balanced sample that is significantly lower (24%) compared to the full sample in Table 5 (adjusted R-squared = 64.02%), which indicate that the regression estimates show less predictive power when the balanced 4-years period sample is used.
The main empirical tests are re-estimated again on another set of sample which exclude fiscal year 2006 from the sample (observation number = 13,437 firm-years). The empirical findings of the 2006 fiscal year excluded sample are consistent with the results of the balanced 4-years period sample. Untabulated regression estimation results for Equation (1) for the 2006 fiscal year excluded sample show a significantly lower degree of adjusted R-squared (12%) compared to the full sample in Table 5 (adjusted R-squared = 64.02%), which indicate that the predictive power of the empirical models is significantly less reliable than the full sample when the 2006 fiscal year excluded sample is used. These results indicate that conclusions of the main findings provide the highest explanatory power and the best-fit for audit fee models compared to the reduced sample models.
7. Discussion of Results and Conclusions
The 2010 European Commission report predicts that the collapse of one of the Big 4 large audit firms could potentially impair the stability of the financial system [28] . The investigation on the structure of the public audit service market can provide evidence to the audit market regulators whether the market need further market regulation to promote competitiveness. Accordingly, the sudden demise of PwC ChuoAoyama in 2006 provided a real empirical setting to investigate the effect of increased audit market concentration on non-competitive audit pricing. This paper presents evidence on audit pricing competitiveness in the Japanese market in the crucial period of a significant audit market structural change following the demise PwC ChuoAoyama in 2006.
The descriptive statistics results of audit fee show that the average audit fee during the Big 3 period (2006-2011) is 16.8% higher than that of the Big 4 period (2004-2005). In addition, the ratio of non-audit fee to audit fee paid by Japanese listed firms is extremely small (3.17%). Japanese audit market is highly concentrated, with the three largest Big N auditors controlling more than 70% of the audit market share. Results of the industry-level audit market concentration analysis show that the industry level audit market concentration in the Big 3 period (2006-2011) is consistently higher compared to the Big 4 period (2004- 2005). Although market share of Japanese Big N firms (based on average client numbers per fiscal year) in the Big 3 period (2006-2011) declined by 4.45% compared to the prior Big 4 period (2004-2005); non-Big N firms’ market share (based on average client numbers per fiscal year) increased by 21.42% in the same period (based on author’s calculation).
The combination of the declining Big N firms market share, the rising non- Big N auditors’ market share, weaker audit service differentiation of large auditors, and low audit quality expectation for large auditors contribute to greater likelihood for Japanese Big N and non-Big N auditors to compete for clients. Those factors motivate this study to further examine audit pricing competitiveness between Big N and non-Big N auditors in Japan. This research investigates audit pricing competitiveness between Big N and non-Big N auditors using the Big N audit fee premium differential between large and small clients. The empirical results show that a non-competitive audit pricing market exists between large and smaller size auditors where Big N auditors earn increasingly higher audit fee as their audit clients become bigger. In addition, the difference-in-difference analysis results show that the transition from Big 4 to Big 3 period contributes to a less competitive audit pricing between Big N and non-Big N auditors. Thus, the concerns regarding the lack of a competition between Big N and non-Big N auditors in the Japanese audit market following the transition from Big 4 to Big 3 audit market is warranted.
This study provides evidence of a non-competitive audit pricing between Big N and non-Big N auditors that can be explained for the following reasons. First, prior empirical study has shown that Japanese listed firms are concerned with the good reputation of their auditors [1] . The higher reputation and brand recognition of Japanese Big N firms provide large audit firms with leverage to negotiate higher audit fees with their clients. Second, there is a significant barrier to entry for smaller non Big N auditors to audit large publicly traded companies listed in the First Section of Tokyo Stock Exchange. The minimum market capitalization required for companies to be listed in the First Section of Tokyo Stock Exchange is 25 billion yen [48] . Thus, most smaller non-Big N auditors lack the necessary human resources and technology required to compete with Big N auditors in providing audit service to large companies. The combination of these factors contributes to the non-competitive audit pricing between Big N and non-Big N auditors.
The adverse effect of Big 4 to Big 3 transition on audit pricing competition provides urgency for audit market reform as another reduction in the number of large auditors could seriously impair the stability of financial markets. Although higher market concentration may reduce audit costs by economies of scale, audit services may become overpriced in the long run [43] . Gerakos and Syverson (2015) model predicts that audit fee could increase indefinitely if current audit market structure persists [3] . However, academics and other stakeholders caution regulators that they should not artificially increase audit market competition through costly regulatory interventions [49] . Instead, regulators and policy makers should increase incentives for non-Big N firms to compete in the audit market, such as: incentive for mid-tier firms to make investments necessary to audit large firms, encourage audit committees to consider larger pool of auditors that match the scope and depth of audit engagement, and prohibit contractual restriction and debt covenant clause that mandate companies to exclusively appoint Big N firms [50] . The EU Commission recommends several measures to increase competition between Big N and non-Big N auditors: joint audit/audit consortia, mandatory rotation of auditors and re-tendering, addressing contractual constraint that limit auditor choice, and issue policies that minimize audit market disruption following a demise of a large audit firm [7] .
This study has a number of limitations. The observation period for the Big 3 period is limited to fiscal year 2011 as additional sample years might aggravate the imbalanced sample between Big 4 period (two fiscal years: 2004-2005) and Big 3 period (six fiscal years: 2006-2011). Audit firms do not disclose necessary information to calculate marginal costs and marginal revenues of audit services [23] . In addition, this study is not able to obtain information on audit hours spent on individual audit engagement as an additional predictor variable on audit fee. To correctly infer audit market pricing competition, it is also necessary to measure the extent of effective internal audit effort that could effectively replace some external audit procedures and audit pricing calculation [21] . Firms with robust internal control system are valued by auditors and are expected to reduce external auditors’ audit hours which lead to lower fees [51] . However, Japanese firms do not publicly disclose internal audit costs in the financial statements. The absence of accurate audit firms’ cost structure, audit hours spent per audit engagement, and internal control efforts limit the explanatory power of audit fee regression models used in this study. Lastly, the external validity of this study might be debatable because the unique characteristics of the Japanese audit market setting makes it difficult to draw strong policy implication that is applicable for other developing countries [52] . A number of potential determinants of less competitive audit pricing between Big N and non-Big N auditors such as client switching, audit partner migration and audit fee lowballing are outside the scope of this study and are subject to future research.
Cite this paper
Frendy (2018) Big N and Non-Big N Audit Pricing Competitiveness in Japan during Transition from Big 4 to Big 3 Period. Open Journal of Accounting, 7, 42-72. https://doi.org/10.4236/ojacct.2018.71004
References
- 1. Skinner, D.J. and Srinivasan, S. (2012) Audit Quality and Auditor Reputation: Evidence from Japan. The Accounting Review, 87, 1737-1765. https://doi.org/10.2308/accr-50198
- 2. Fukukawa, H. (2011) Audit Pricing and Cost Strategies of Japanese Big 3 Firms: Audit Pricing and Cost Strategies of Japanese Big 3 Firms. International Journal of Auditing, 15, 109-126. https://doi.org/10.1111/j.1099-1123.2010.00425.x
- 3. Gerakos, J. and Syverson, C. (2015) Competition in the Audit Market: Policy Implications. Journal of Accounting Research, 53, 725-775. https://doi.org/10.1111/1475-679X.12087
- 4. Oxera Consulting (2006) Competition and Choice in the UK Audit Market. Department of Trade and Industry and Financial Reporting Council.
- 5. PwC (2012) PwC Response to the Nature and Strength of Competition Working Paper.
- 6. UK House of Lords (2011) Auditors: Market Concentration and Their Role, 2nd Report of Session 2010-11, Volume I: Report. The Stationery Office Limited, London.
- 7. European Commission (2010) Audit Policy: Lessons from the Crisis. Brussels.
- 8. OECD Competition Committee (2009) Competition Policy Roundtables—Competition and Regulation in Auditing and Related Professions. OECD Competition Committee.
- 9. United States General Accounting Office (2008) Audits of Public Companies: Continued Concentration in Audit Market for Large Public Companies Does Not Call for Immediate Action. United States Government Accountability Office, Washington DC.
- 10. Beattie, V. and Fearnley, S. (1994) The Changing Structure of the Market for Audit Services in the UK—A Descriptive Study. The British Accounting Review, 26, 301-322. https://doi.org/10.1006/bare.1994.1021
- 11. Competition Commission UK (2011) Audit Market Investigation—Issues Statement.
- 12. Simons, D. and Zein, N. (2014) Audit Market Segmentation—The Impact of Mid-tier Firms on Competition. European Accounting Review, 25, 1-24. https://doi.org/10.2139/ssrn.2507889
- 13. Francis, J. (2011) A Framework for Understanding and Researching Audit Quality. Auditing: A Journal of Practice & Theory, 30, 125-152. https://doi.org/10.2308/ajpt-50006
- 14. Donovan, J., Frankel, R., Lee, J., Martin, X. and Seo, H. (2014) Issues Raised by Studying DeFond and Zhang: What Should Audit Researchers Do? Journal of Accounting and Economics, 58, 327-338. https://doi.org/10.1016/j.jacceco.2014.09.001
- 15. Semba, H.D. (2016) Research in Audit Quality in the Global Era. Chikura Publishing, Tokyo. (In Japanese)
- 16. Yamaguchi, Y. (2013) Impact of Audit Firm Size on the Accuracy of Analyst Forecasts. Modern Auditing, 23, 155-165, (In Japanese)
- 17. Yoshida, K. (2008) Analysis of Audit Quality and Earnings Management Reporting in Japan. Financial Information Reliability, 5, 224-235. (In Japanese)
- 18. Frendy and Hu, D. (2014) Japanese Stock Market Reaction to Announcements of News Affecting Auditors’ Reputation: The Case of the Olympus Fraud. Journal of Contemporary Accounting & Economics, 10, 206-224. https://doi.org/10.1016/j.jcae.2014.08.004
- 19. Hamilton, J., Li, Y. and Stokes, D. (2008) Is the Audit Services Market Competitive Following Arthur Andersen’s Collapse? Accounting & Finance, 48, 233-258. https://doi.org/10.1111/j.1467-629X.2007.00242.x
- 20. Carson, E., Redmayne, N. and Liao, L. (2014) Audit Market Structure and Competition in Australia. Australian Accounting Review, 24, 298-312. https://doi.org/10.1111/auar.12041
- 21. Simunic, D. (1980) The Pricing of Audit Services: Theory and Evidence. Journal of Accounting Research, 18, 161-190. https://doi.org/10.2307/2490397
- 22. Chen, C., Su, X. and Wu, X. (2007) Market Competitiveness and Big 5 Pricing: Evidence from China’s Binary Market. The International Journal of Accounting, 42, 1-24. https://doi.org/10.1016/j.intacc.2006.12.001
- 23. Huber, W. (2015) The Structure of the Public Accounting Industry—Why Existing Market Models Fail. Journal of Theoretical Accounting Research, 10, 43-67.
- 24. Francis, J.R. and Stokes, D.J. (1986) Audit Prices, Product Differentiation, and Scale Economies: Further Evidence from the Australian Market. Journal of Accounting Research, 24, 383-393. https://doi.org/10.2307/2491141
- 25. Kim, H. and Fukukawa, H. (2013) Japan’s Big 3 Firms’ Response to Clients’ Business Risk: Greater Audit Effort or Higher Audit Fees?: Japan’s Big 3 Firms’ Response to Clients’ Business Risk. International Journal of Auditing, 17, 190-212. https://doi.org/10.1111/j.1099-1123.2012.00464.x
- 26. Karube, M. and Fukukawa, H. (2013) Integrating Personal Expertise: A History of Japanese Audit Firms, 1965-2010. Institute of Innovation Research Hitotsubashi University Working Paper WP#13-07.
- 27. Le Vourc’h, J. and Morand, P. (2011) Executive Summary—Study on the Effects of the Implementation of the Acquis on Statutory Audits of Annual and Consolidated Accounts Including the Consequences on the Audit Market. ESCP Europe, Paris.
- 28. Bleibtreu, C. and Stefani, U. (2012) Auditing, Consulting, and Audit Market Concentration. Zeitschrift Für Betriebswirtschaft, 82, 41-70. https://doi.org/10.1007/s11573-012-0597-5
- 29. Chaney, P., Jeter, D. and Shivakumar, L. (2004) Self-Selection of Auditors and Audit Pricing in Private Firms. The Accounting Review, 79, 51-72. https://doi.org/10.2308/accr.2004.79.1.51
- 30. Carson, E., Simnett, R., Soo, B.S. and Wright, A.M. (2012) Changes in Audit Market Competition and the Big N Premium. Auditing: A Journal of Practice & Theory, 31, 47-73. https://doi.org/10.2308/ajpt-10295
- 31. Arellano, M. (2003) Panel Data Econometrics. Oxford University Press, New York. https://doi.org/10.1093/0199245282.001.0001
- 32. Schmidheiny, K. and Basel, U. (2011) Panel Data: Fixed and Random Effects. Short Guides to Microeconometrics, 2-7.
- 33. Francis, J., Michas, P. and Seavey, S. (2013) Does Audit Market Concentration Harm the Quality of Audited Earnings? Evidence from Audit Markets in 42 Countries. Contemporary Accounting Research, 30, 325-355. https://doi.org/10.1111/j.1911-3846.2012.01156.x
- 34. Lechner, M. (2010) The Estimation of Causal Effects by Difference-in-Difference Methods Estimation of Spatial Panels. Foundations and Trends in Econometrics, 4, 165-224. https://doi.org/10.1561/0800000014
- 35. Cahan, S., Godfrey, J., Hamilton, J. and Jeter, D. (2008) Auditor Specialization, Auditor Dominance, and Audit Fees: The Role of Investment Opportunities. The Accounting Review, 83, 1393-1423. https://doi.org/10.2308/accr.2008.83.6.1393
- 36. Casterella, J., Francis, J., Lewis, B. and Walker, P. (2004) Auditor Industry Specialization, Client Bargaining Power, and Audit Pricing. Auditing: A Journal of Practice & Theory, 23, 123-140. https://doi.org/10.2308/aud.2004.23.1.123
- 37. Numan, W. and Willekens, M. (2012) An Empirical Test of Spatial Competition in the Audit Market. Journal of Accounting and Economics, 53, 450-465. https://doi.org/10.1016/j.jacceco.2011.10.002
- 38. The Japanese Institute of Certified Public Accountants (2013) Corporate Disclosure in Japan.
- 39. Kasai, N. and Takada, T. (2012) How Do Regulation and Deregulation on Audit Fees Influence Audit Quality? Empirical Evidence from Japan. Shiga University, Faculty of Economics Working Paper No. 179. https://doi.org/10.2139/ssrn.2179908
- 40. Certified Public Accountants and Auditing Oversight Board (2006) Quality Control of Audits of the Four Largest Japanese Audit Firms. Financial Services Agency, Tokyo.
- 41. Pong, C. and Burnett, S. (2006) The Implications of Merger for Market Share, Audit Pricing and Non-Audit Fee Income: The Case of PricewaterhouseCoopers. Managerial Auditing Journal, 21, 7-22. https://doi.org/10.1108/02686900610634720
- 42. Nihon Keizai Shinbun (2010) Audit Fees Decrease by 2% Compared to Previous Period. Nihon Keizai Shinbun Morning Edition, August 18, 13. (In Japanese)
- 43. Bigus, J. and Zimmermann, R. (2008) Non-Audit Fees, Market Leaders and Concentration in the German Audit Market: A Descriptive Analysis. International Journal of Auditing, 12, 159-179. https://doi.org/10.1111/j.1099-1123.2008.00378.x
- 44. O’brien, R. (2007) A Caution Regarding Rules of Thumb for Variance Inflation Factors. Quality & Quantity, 41, 673-690. https://doi.org/10.1007/s11135-006-9018-6
- 45. Ferguson, A. (2003) The Effects of Firm-Wide and Office-Level Industry Expertise on Audit Pricing. The Accounting Review, 78, 123-140. https://doi.org/10.2308/accr.2003.78.2.429
- 46. Heckman, J.J. (1979) Sample Selection Bias as a Specification Error. Econometrica, 47, 153-161. https://doi.org/10.2307/1912352
- 47. Ireland, J. and Lennox, C. (2002) The Large Audit Firm Fee Premium: A Case of Selectivity Bias? Journal of Accounting, Auditing & Finance, 17, 73-91. https://doi.org/10.1177/0148558X0201700104
- 48. Tokyo Stock Exchange (2016) 2016 New Listing Guidebook for Foreign Companies.
- 49. Association of Chartered Certified Accountants (2010) Response to European Commission’s Green Paper, Audit Policy: Lessons from the Crisis. ACCA, London.
- 50. Ernst & Young (2010) European Commission Green Paper, Audit Policy: Lessons from the Crisis. Ernst & Young Global Limited, UK.
- 51. Hay, D. (2013) Further Evidence from Meta-Analysis of Audit Fee Research: Further Evidence from Meta-Analysis of Audit Fee Research. International Journal of Auditing, 17, 162-176. https://doi.org/10.1111/j.1099-1123.2012.00462.x
- 52. Skinner, D. (2011) Accounting Research in the Japanese Setting. The Japanese Accounting Review, 1, 135-140. https://doi.org/10.11640/tjar.1.2011_135
NOTES
1Big N refers to Japanese audit firms affiliated with the international Big 4 audit firms networks (Deloitte Tohmatsu, Ernst & Young ShinNihon, KPMG AZSA, and PwC affiliated firms: ChuoAoyama, Misuzu, and Aarata).
2FeePrem takes the value of one if the client is audited by one of the Japanese auditors affiliated with the global Big 4 audit firms networks (Deloitte Touche Tohmatsu, E&Y Shin Nihon, KPMG AZSA, PwC Aarata, PwC Chuo Aoyama, and PwC Misuzu), and zero otherwise.
3The procedure calculates the percentage effect of the intercept shift on the dependent variable (natural log of audit fees), and is defined as ez − 1, where z is the coefficient estimate of the regression variable (Ferguson, 2003).