Advances in Remote Sensing
Vol.05 No.04(2016), Article ID:72479,15 pages
10.4236/ars.2016.54021
Analysis of Land-Cover Changes and Anthropogenic Activities in Itigi Thicket, Tanzania
Joseph S. Makero1, Japhet J. Kashaigili2*
1Forestry Training Institute, Arusha, Tanzania
2Department of Forest Resources Assessment and Management, Sokoine University of Agriculture, Morogoro, Tanzania

Copyright © 2016 by authors and Scientific Research Publishing Inc.
This work is licensed under the Creative Commons Attribution International License (CC BY 4.0).
http://creativecommons.org/licenses/by/4.0/


Received: September 26, 2016; Accepted: November 28, 2016; Published: December 1, 2016
ABSTRACT
Assessing land cover changes from the 1991 to 2011 for Itigi thicket is imperative for determining changes between land cover types and understanding anthropogenic impact during this period. Remote sensing (RS) data, Geographic Information System (GIS) techniques and forest inventory data were used. ILWIS 3.3 Academic soft- ware was used to analyze the satellite imageries to determine the land use, land cover change; while data on anthropogenic activities were analysed in MS Excel software. The results showed that between 1991/2000 and 2000/2011, the areas of thicket declined by 6.23% while non-thicket areas increased by 3.92%. The decline in thicket areas was attributed to increase in anthropogenic activities such as wood extraction, clearing for agriculture, livestock grazing and fires. The study highlights the importance of integrating remote sensing and forest inventory in understanding the thicket resources dynamics and generating information that could be used to overcome the Itigi thicket problems for the sustainability of this unique vegetation.
Keywords:
Itigi Thicket, Land Cover Change, Remote Sensing, GIS

1. Introduction
Thicket is a dense formation of evergreen and weakly deciduous shrubs and low trees (2 - 5 m), often spiny and festooned with vines [1] . According to [2] , thicket is generally influenced by soil type and structure, and is mainly found in Africa (e.g. Madagascar, Tanzania, Zambia), west Asia (e.g. Sound Arabia, India), eastern and northern Australia and America (e.g. Mexico, central America, north western Argentina, central Bolivia, north eastern Argentina, Paraguay, eastern Brazil). In East Africa, thickets rise from central Tanzania to the lowlands of the Somalia-Masai region to Eritrea [3] [4] . The climate of thicket’s core area is semi-arid to sub-humid (250 - 800 mm・yr?1) and subtropical to warm-temperate (largely frost-free). Thicket has a rich flora estimated to 1600 species, 20% of which are endemic to the Subtropical areas [4] . Thicket is dominated by trees and shrubs that are very long-lived and are capable of sprouting after defoliation from herbivores, frost and fire [4] .
In Tanzania, thicket falls in the semi-arid areas of central parts of the country. This thicket is endemic to Itigi in Manyoni District and thus named Itigi thicket. Itigi thicket constitutes one fifth of the total area of Manyoni District and it represents a globally unique biodiversity resource both for national and international importance. The vast and relatively dense vegetation are also reported to be among the last strongholds for large mammals species such as African elephant (Loxodonta africana), black rhinoceros (Diceros bicornis) and African buffalo (Syncer us caffer) [5] .
Although Itigi thicket vegetation is essential for the survival of humankind and wild animals, it has been threatened by an array of anthropogenic activities, because of its complex and fragile ecosystems. [6] [7] pointed out that, anthropogenic activities have transformed the earth’s surface by converting natural forests, savannas and steppes into agricultural lands and substantially modifying others with significant consequences for land cover, biodiversity, soil condition, water and sediment flows. Land cover changes have accelerated in the 20th Century, both in pace and intensity, because of increased intensity of anthropogenic activities [8] . According to [9] , land cover describes the physical states of the land surface including cropland, forest, wetlands, pastures roads and urban areas. Understanding the nature and extent of land cover changes as well as assessing the driving forces behind the change is essential for explaining the past and forecasting future patterns and in designing appropriate interventions.
The mid-resolution, multi-temporal satellite images such as Landsat, has been the most reliable source of data for monitoring forest change. These images provide encoded radiance data in the visible near-and middle-infrared spectra, in which most mature tropical forest can be spectrally distinguished from farm, fallow land and other non-forest vegetation [10] [11] [12] [13] .
According to [14] , land cover change analysis is an important tool to assess global change at various spatial temporal scales. [15] affirmed that it reflects the dimension of human activities on a given environment. According to [16] land cover change often reflects the most significant impact on the environment due to human activities or natural forces and that remote sensing can be an appropriate tool for getting wide impression on land cover change. It is now widely accepted that information generated from remotely sensed data is useful for planning, and decision making. For example, according to [17] , for the resource manager, a particular attraction of satellite remote sensing technology is the ability to provide consistent measurements of landscape condition, allowing detection of both abrupt changes and slow trends over time. Detection and characterization of change in key resource attributes allows resource managers to monitor landscape dynamics over large areas, and with less costs [18] . Furthermore, long-term change detection results can provide insight into the stressors and drivers of change, potentially allowing for management strategies targeted toward cause rather than simply the symptoms of the cause [17] . The assessment of spatial patterns of land cover changes over a long period using images of multi-temporal coverage is now possible considering the accumulation of remotely sensed images over the past decades; as such making it possible to generate an understanding of the drivers for the changes.
Like other forest types, Itigi thicket has been affected by shifting cultivation, pasture, charcoaling and mining [5] . Since, it is adjacent to the rural population who depends directly on the land for their livelihoods. This rural population is causing resource degradation brought about by the decrease in the area under thicket vegetation and its conversion into other types of land use and land cover that are human-managed systems. Previous studies for example [19] reported on biodiversity features of Itigi thicket and the [5] reported on the monitoring of the Itigi thicket using Landsat. Since no study reported on anthropogenic activities and land cover changes in Itigi thicket, it was worthy to detailed assessment of anthropogenic activities and land cover changes in Itigi thicket.
Therefore this paper presents an assessment of land cover changes of Itigi thicket in Tanzania using Landsat data sets acquired in 1991, 2000 and 2011 to address three questions: 1) How much thicket is remaining and how much has been lost during the last two decades? 2) What is the rate of change of Itigi thicket? 3) What are the major causes of land cover changes? The information generated from this study is central for planning sustainable development and management of Itigi thicket.
2. Materials and Methods
2.1. Site Description
Data for this study were collected in Itigi thicket located in the northern part of Manyoni district, Singida Region (5˚31' - 5˚50'S and 34˚31' - 34˚49'E) (Figure 1). The altitude of the study area ranges between 1244 and 1300 m.a.s.l [20] . The area has unimodal rainfall with annual mean rainfall of 624 mm. The minimum temperature is in July (19˚C) while the maximum temperature is in November (24.4˚C). The area has granite soil which is not stony and therefore favours the root systems of thicket species to easily penetrate [3] [21] .
Itigi thicket is floristically rich and dominated by Pseudo prosopsis fischeri (Taub.) Harms and Combretum celastroides Laws. Other thicket species includes: Craibia abbreviata subsp. burtii, Combretum paniculatum Vent., Dichrostachys cinerea (L.) Wight & Arn, Croton scheffleri Pax, Excoecaria bussei (Pax) Pax, Grewia forbesii Harv. ex Mast, Grewia similis K. Schum, Ochna ovate F. Hoffm, Rinorea angustifolia Grey-Wilson, Tennantia sennii (Chiov.) Verdc. & Bridson, and Zanthoxylum chalebium Engl. Within Itigi thicket there are also low trees (associate trees) such as Acacia tortilis (Forsk.) Hayne, Arzeyk., Baphia massaiensis Taub., Cassipourea mollis (R. E. Fr.) Alston, Haplocoelum foliolosum, Lannea fulva (Engl.) Engl, Senna singueana (Delile) Lock, Maerua triphylla A. Rich., Vangueriama dagascariens is J. F. Gmelin. In addition, there are small patches of miombo woodland composed of miombo dominants such as Brachystegia

Figure 1. Location of the study area.
boehimii Benth., Brachystegia spiciformis Benth., Julbernadia globiflora (Benth.) and Burkea africana [5] [22] .
2.2. Methods
Data of this study were collected by using RS and GIS techniques. In addition, field survey and key informant interviews were used to get information of the causes of land cover changes at the present and past years.
2.2.1. Imageries Data Collection and Analysis
Image selection and acquisition: In consideration of cloud cover, the seasonality and phonological effects [23] , image listed in Table 1 were selected for image processing

Table 1. Landsat images used in the analysis of thicket cover changes.
and change analysis. The image selected was from dry season in order to acquire images with minimum cloud cover and also to avoid differences due to season effects. In this study land sat images of 1991, 2000 and 2011 were used for land use land cover change classifications.
Image processing: Image processing involved three stages, these were: Image preprocessing, rectification or georeferencing and image enhancement. 1) Image preprocessing, the methods for image analysis required the use of both visual and digital image processing. Both visual and digital image processing was done. Prior to image processing images were extracted from the full scenes using ILWIS 3.3 Academic software to subset scenes into area of interest (AOI) followed by rectification. 2) Image rectification, Image rectification were performed in order to correct data for distortion or degredation which may result from the image acquisition process. To ensure accurate identification of temporal changes and geometric compatibility with other sources of information, the images were geo-coorded to the coordinate and mapping system of the national topographic maps, i.e. UTM coordinate zone 36 south, Spheroid clarke 1880, Datum Arc 1960, based on a previous georeferenced Landsat TM images of July 2011. Since the images had already been corrected for radiometric distortions and available as geo-cover datasets with no apparent noise, the created sub-scene were only subjected to geometric correction. 3) Image enhancement, In order to reinforce the visual interpretability of images, a colour composite (Landsat TM bands 4, 5, and 3) was prepared and its contrast was stretched using a Gaussian distribution, a 3 × 3 high pass filter was applied to the colour composite to further enhance visual interpretability of linear features e.g. Rivers, and land use features like agricultural land, forests etc. All image processing were carried out using ILWIS 3.3 Academic software.
Preliminary Image classification and ground truthing: Preliminary Image classification: Within the scope of this study, image classification is defined as the extraction of differentiated land use and land cover categories from remote sensing data. Supervised image classification using Maximum Likelihood Classifier (MLC) was used to create base map which was then used for ground truthing. The maximum likelihood classifier was selected since unlike other classifiers it considers the spectral variation within each category and the overlap covering the different classes [23] . Before going to field, to implement ground truthing, preliminary image classification was performed to roughly identify vegetation types and other land use and land cover classes. Sets of hardcopy of colour composite images with overlays of roads and UTM coordinates were produced using image acquired on July 2011 and used as a base-map during the ground truthing. Ground truthing was done in order to verify and modify land use land covers obtained during preliminary image interpretation. A hand-held GPS GPS was used to locate sampled land cover observations. During the ground truthing, the following major land cover classes were identified: thickets, grassland, bareland, settlement and cultivated woodland.
Final image classification: Supervised image classification using maximum likelihood classifier (MLC) was utilized in this study. The advantage of digital image classification is that it can provide efficient, consistent and repeatable routines for mapping large areas [23] . Supervised classification process involved selection of training sites on the image. Training sites are sites of pixels that represent specific land classes to be mapped [24] . They are pixels that represent what is recognized as discernible pattern or potential cover classes. Training sites were generated by on-screen digitizing of selected areas for each land cover class identified on the colour composite. Training was iterative process, whereby the selected pixels were evaluated by performing an estimated classification. Based on the inspection, training samples were refined until a satisfactory result was obtained. The objective was to produce thematic classes that resemble or can be related to the actual land cover types on the earth’s surface.
Classification of Accuracy Assessment: Land cover maps derived from classification of images usually contain some sort of errors due to several factors that range from classification techniques to methods of satellite data capture. Hence, evaluation of classification results is an important process in the classification procedure [25] . Among the common measures used for measuring the accuracy of thematic maps derived from multispectral imagery, error/confusion matrix was used. An error matrix is a square assortment of numbers defined in rows and columns that represent the number of sample units assigned to a particular category relative to the actual category as confirmed on the ground.
Preparation of land use land cover maps: Classified images were recorded to respective classes (i.e.: thickets, grassland, bareland, settlement and cultivated woodland). Following the recoding, images were filtered using a 3 × 3 majority-neighbourhood filter. The classified images were filtered in order to eliminate patches smaller than a specified value and replace them with the value that is most common among the neighbouring pixels. A mosaic operation was not performed because images acquired cover the entire study area.
Land use land covers change detection analysis: Change detection is a very common and powerful application of satellite based remote sensing. Change detection entails findings the type, amount and location of land use changes that are taking place [23] .
In this study, post classification comparison was used to quantify the extent of land cover changes over the 20 years period (1991, 2000, and 2011). The advantage of post classification comparison is that it bypasses the difficulties associated with the analysis of the images that are acquired at different times of the year, or by different sensors and results in high change detection accuracy [26] .
Assessment of the rate of cover change: Estimation for the rate of change for different land covers was computed based on the following formulae [27] .
 (1)
(1)
 (2)
(2)
 (3)
(3)
where, Areai year x is area of cover i at the first date, Areai year x + 1 is area of cover i at the second,  is the total cover area at the first date and tyears is period in years between the first and second scene acquisition dates.
2.2.2. Anthropogenic Activities Data Collection and Analysis
The field survey was carried out in two stages: 1) reconnaissance survey to acquaint with study area, delineate thicket boundaries and stratify thicket area using RS techniques, 2) detailed field survey for assessment of anthropogenic activities using visual observation. At random, 86 plots with an area of 0.0154 ha were established and their coordinates were taken using a hand held Global positioning system (GPS). In each plot assessment of anthropogenic activities was done (Table 2).
Both descriptive and inferential statistical methods were used to analyze the quantitative data. Descriptive statistics such as frequency and percentages were used to explain and illustrate primary causes of anthropogenic activities in Itigi thicket. Inferential data analysis was done to determine the extent of anthropogenic activities per ha and to test the significance between frequency and extent of anthropogenic activities within thicket area. The Microsoft Excel software package was used for the qualitative and quantitative data analysis. The frequency and extent per ha were computed in the following ways;
 (4)
(4)
whereby  is frequency per ha of individual anthropogenic activity (count/ha),
  is frequency (count),
  is plot size and
  is number of plots inventoried.
 (5)
(5)
whereby  is extent per ha of individual anthropogenic activity (abundance per ha),
  is abundance of anthropogenic activity (number of count in a plot),
  is plot size and
  is number of plots inventoried.
 (6)
(6)
whereby  is relative abundance of individual anthropogenic activity,
  is abundance of anthropogenic activity (number of count in a plot),
  is total number of individual anthropogenic activities recorded in an area.
Table 2. Categories of anthropogenic activities variables recorded in the Itigi thicket.
In addition, guided questions were administered to key informants (i.e. forest officers, village leaders and elders who lived in the area for more than 15 years) to capture an in-depth understanding of historical resources use pattern in the area.
3. Results
3.1. Itigi Thicket Land Covers Maps and Their Changes
The results from classification accuracy assessment revealed that the overall accuracy of classification for Itigi thicket was 81%. According to [24] the overall accuracy is acceptable if it is greater than 80%.
The land cover maps for the period 1991, 2000 and 2011 are presented in Figure 2(a), Figure 2(b) and Figure 2(c), while Table 3 presents the cover areas for respective periods and the area changes between 1991/2000, and between 2000/2011 periods. The results showed that thicket occupies large area in Itigi thicket. For example in 1991, the area occupied by thicket was 345,150.5 ha (67.85 %), in 2000 was 313,451 ha (61.62%) and in 2011 was 293, 444.8 ha (57.7 %). Apparently, this large area occupied by thicket declined during 1991/2000 and 2000/2011. In 1991/2000, the area occupied by thicket declined by 31,699.5 ha (6.23%) while in 2000/2011 the area declined by 20,006.2 ha (3.93%). However, in 1991/2000 and 2000/2011 other land covers for example bare land increased by 3.64 % in both epochs, cultivated woodland increased by 0.89 % in 1991/ 2000 and 0.1% in 2000/2011. While settlement increased by 0.03% in 1991/2000 and 0.14% in 2000/2011. In 1991/2000; the area of grass land increased by 1.63%, and 0.13% in 2000/2011. Summary statistics for land cover changes are presented in Table 3.
 (a)
(a) (b)
(b)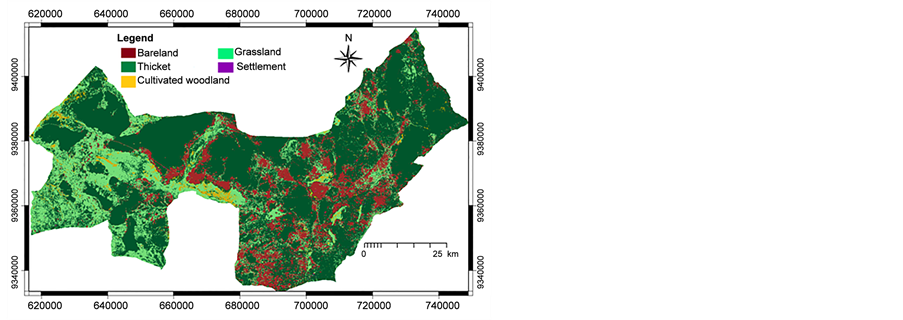 (c)
(c)
Figure 2. (a) Land cover map of Itigi thicket for 1991; (b) Land cover map of Itigi thicket for 2000; (c) Land cover map of Itigi thicket for 2011.
Table 3. Cover area, change area and annual rate of change between 1991 and 2011 for Itigi thicket.
3.2. Anthropogenic Activities Influencing Land Cover Changes in Itigi Thicket
Despite existence of many laws and by-laws enforced by Manyoni District Council (MDC), Tanzania Forest Services (TFS) and other stakeholders aiming at managing the Itigi thicket, anthropogenic activities still takes place. Table 4 shows the major causes of anthropogenic activities in the Itigi thicket. The causes differ considerably between the anthropogenic activities, for example the wood extract has a large number of causes as compared to other. The number of occurrence per ha of the causes for woody extract (Table 4) entails (28) for poles that are mainly being used as material for construction and firewood, (8) for charcoal kiln, (8) for logging and (5) for beekeeping. The wood clearing is attributable to farming (11) and sand stone mining (3), while presence of fodder and water (19) attracted animal grazing. The farm preparations, beekeeping activities and hunting (19) are largely causing wildfires in thicket while unplanned and planned activities such as woody tree clearing and livestock grazing are the major causes of trespassing (28) in Itigi thicket.
Poles extraction and firewood collection showed sign of highest moderate and severe anthropogenic activities compared to other anthropogenic activities (Figure 3). Results of analyses show significance difference (t-test, d. f = 20, p < 0.05) between frequency and the extent of anthropogenic activities within thicket area.
4. Discussion
Considering the five land-cover classes that were discriminated, i.e. thicket, grassland, bare land, cultivated woodland and settlement, the average overall accuracy of over 80%indicates the reliability of the classifications [25] thus giving confidence on the detected changes [28] [29] using a post-classification change detection of classified images (pixel-by-pixel comparison) providing change detection matrices [29] from which “from to” change class information was extracted. The change analysis has revealed that thicket cover declined from 345,150.5 ha in 1991 to 313,451 ha in 2000 and 293,444.3 ha in 2011. This reduction was also demonstrated by the increase of bare land from
Table 4. Anthropogenic activities, their causes and the number of occurrences in Itigi thicket.

Figure 3. Extent of anthropogenic activities in Itigi thicket.
54,282.4 ha in 1991 to 73,034.6 ha in 2000 and 91,603.6 ha in 2011, cultivated woodland from 5,654 ha in 1991 to 10,153 ha 2000 and 10,600.2 ha in 2011 and settlement from 161.6 ha in 1991 to 294.3 ha in 2000 and 862.9 ha in 2011. Furthermore, thicket covers loss was also reflected in the mapped thicket area. These results are in agreement with [5] and [19] reports which showed the loss of Itigi thicket cover between 1990 and 2000.
The annual rate of change for thicket land cover between 1991 and 2000 was higher compared to that of 2000 to 2011. This estimate is in line with that reported by FAO FRA 2001 and 2010 which indicate considerable deforestation in the world during 1990-2010 [25] . For example in the Eastern and Southern Africa, deforestation rate per year was 1,841,000 ha in 1990-2000 and 1,839,000 ha in 2000-2010. Therefore there was considerable deforestation in the world during 1990-2010 but this was almost entirely confined to tropical regions [30] . The countries with the largest annual net loss for
1990-2000 were Nigeria (−3.67%), Indonesia (−1.75 %), Zimbabwe (−1.58%), Myanmar (−1.17%), Tanzania (−1.02%), Argentina (−0.88%), Sudan (−0.80%), Mexico (−0.52%), Brazil (−0.51%) and Congo (−0.20 %). The major causes of this loss in tropical forests include agriculture settlement, fires, overgrazing, logging and fuel wood [29] .
Similarly, this study showed multi anthropogenic activities in Itigi thicket which associated with conversion of thicket to non-thicket areas. The major anthropogenic activities reported in this study include wood extract being caused by extraction of pole for construction and firewood collection, livestock grazing, charcoal burning and fires. Comparable results was reported by [31] , that fires, cutting trees for fuel wood and poles, overgrazing and charcoaling are the major anthropogenic activities in Makurunge woodland. According to [32] , clearing of forests in developing countries is mainly caused by agricultural expansion and inappropriate agricultural practices, overgrazing, charcoaling, fires, firewood gathering, commercial logging and industrial development. [33] showed that the forest ecosystem is increasingly threatened by anthropogenic activities such as agriculture and settlements, selective logging and fires. And the effects anthropogenic activities on forest structure and composition hinder forest regeneration [34] .
Despite the few incidences of fire in Itigi thicket, the few occurrences are largely attributable to livestock grazing. According to [35] , fire is an environmental factor affecting tropical savanna dynamics. Pattern of forests cover changes in Tanzania, suggests that fire has been the primary determinant of the vegetation dynamics [36] . Thus, the combined effects of both fire and livestock grazing probably pioneered other forms of activities such farming, firewood collection, charcoaling and logging. In addition, dependence by resource-poor households on cash income from the sale of thicket products appears to be the cause decline in thicket areas. Commercial production of firewood and charcoal as an alternative source of income to meet urban energy demands and curing tobacco contributes significantly to clearance of thicket. Since the available wood resources from Itigi thicket is almost constant, appropriate measures should be taken to overcome social interaction between people and available wood resources which bring about decline of thicket area for the sustainability of the wood resources.
Since the 1980s, sustainable forest management remains a challenge in Tanzania as manifested by the continued decline in forest cover. Results of Itigi land cover showed gradual change of thicket cover. It is therefore important to understand why thicket cover is declining. This understanding could go a long way in design of interventions for promotion of sustainable management. Furthermore, the need for accurate and reliable information about thicket cover change to inform debates, discussions and decision making on thicket management and conservation in Tanzania still exists [22] .
And since this study reveals the potential of the widely reported national forest cover statistics either under-or over-estimating sub-national (local) forest cover changes, it is important that focus be extended to acquisition and reporting of sub-national (local) forest cover statistics. Making decisions with knowledge of local forest cover dynamics could potentially enhance sustainable forest management.
5. Conclusion and Recommendation
The study has revealed land cover changes in the Itigi thicket between 1991 and 2000 and between 2000 and 2011. This was an integrated assessment combining remote sensing and forest inventory approaches in understanding the land resources dynamics. The findings showed a decrease of thicket and increase of non-thicket area such as bareland, grassland, settlement and cultivated woodland due to anthropogenic activities including wood extract for fuel wood and construction, wood clearing for agriculture, livestock grazing, fires and trespassing. The study concludes that, there have been significant changes in land covers in the Itigi thicket. The study highlights the importance of integrating remote sensing and forest inventory in understanding the thicket resources dynamics and generating information that could be used to overcome the Itigi thicket problems for the sustainability of this unique vegetation.
Acknowledgements
The authors acknowledge the financial support from the Sokoine University of Agriculture through the Climate Change Impacts, Adaptation and Mitigation (CCIAM) programme, without which this study would not have been possible. Authors are also thankful to Dr. Celina Mongo, Mr. Richard Giliba and Mr. Simon Kitereja for their comments before and after field work. The key informants and the Government officials in Manyoni District are acknowledged for their valuable comments and cooperation during the study.
Cite this paper
Makero, J.S. and Kashaigili, J.J. (2016) Analysis of Land- Cover Changes and Anthropogenic Activities in Itigi Thicket, Tanzania. Advances in Remote Sensing, 5, 269-283. http://dx.doi.org/10.4236/ars.2016.54021
References
- 1. Vlok, J.H.J., Euston-Brown, D.I.W. and Cowling, R.M. (2003) Acocks’ Valley Bushveld 50 Years on: New Perspectives on the Delimitation, Characterisation and Origin of Subtropical Thicket Vegetation. South African Journal of Botany, 69, 27-51.
http://dx.doi.org/10.1016/S0254-6299(15)30358-6 - 2. FAO (2003) State of Forest and Tree Genetic Resources in Dry Zone Southern Africa Development Community Countries. Document Prepared by B.I. Nyoka. Forest Genetic Resources Working Papers, Working Paper FGR/41E, Forest Resources Development Service, Forest Resources Division. FAO, Rome (Unpublished).
http://www.fao.org/docrep/005/ac850e/ac850e00.htm#Contents - 3. Kindt, R., Van Breugel, P., Lilleso, J.P.B., Bingham, M., De missew, S., Dudley, C., Friis, I., Gachathi, F., Kalema, J., Mbago, F., Minani, V., Moshi, H.N., Mulumba, J., Namaganda, M., Ndangalasi, H.J., Ruffo, C.K., Jamnadass, R. and Graudal, L. (2011) Potential Natural Vegetation of Eastern Africa. Volume 4: Description and Tree Species Composition for Bushland and Thicket Potential Natural Vegetation Types. Forest and Landscape Working Paper 64-2011.
- 4. Cowling, R.M., Proche and Vlok, J.H.J. (2005) On the Origin of Southern African Subtropical Thicket Vegetation. South African Journal of Botany, 7, 1-23.
http://dx.doi.org/10.1016/S0254-6299(15)30144-7 - 5. WWF (2014) Itigi-Sumbu Thicket.
http://www.worldwildlife.org/ecoregions/at0708 - 6. Lambin, E.F., Geist, H. and Lepers, E. (2003) Dynamics of Land Use and Land Cover Change in Tropical Regions. Environment and Resources, 28, 205-241.
http://dx.doi.org/10.1146/annurev.energy.28.050302.105459 - 7. Turner II, B.L., Meyer, W.B. and Skole, D.L. (1994) Global Land-Use/Land Cover Change: Towards an Integrated Program of Study. Ambio, 23, 91-95.
- 8. Ramankutty, N., Graumlich, L., Achard, F., Alves, D., Chhabra, A., DeFries, R.S., Foley, J.A., Geist, H., Houghton, R.A., Goldewijk, K.K., Lambin, E.F., Millington, A., Rasmussen, K., Reid, R.S. and Turner II, B.L. (2006) Global Land-Cover Change: Recent Progress, Remaining Challenges. In: Lambin, E.F. and Geist, H., Eds., Land-Use and Land-Cover Change, Springer-Verlag, Berlin, 9-39.
http://dx.doi.org/10.1007/3-540-32202-7_2 - 9. Di Gregorio, A. and Jansen, L.J.M. (2005) Land Cover Classification System (LCCS): Classification Concepts and User Manual.
http://www.fao.org/docrep/003/x0596e/x0596e00.HTM - 10. Sader, S.A., Powell, G.V.N. and Rappole, J.H. (1991) Migratory Bird Habitat Monitoring through Remote Sensing. International Journal of Remote Sensing, 12, 363-372.
http://dx.doi.org/10.1080/01431169108929658 - 11. Moran, E., Brondizio, E. and Mausel, P. (1994) Integrating Amazonian Vegetation, Land-Use, and Satellite Data. Bioscience, 44, 1-18.
http://dx.doi.org/10.2307/1312383 - 12. Steininger, M.K. (1996) Tropical Secondary Forest Regrowth in the Amazon: Age, Area and Change Estimation with Thematic Mapper Data. International Journal of Remote Sensing, 17, 9-27.
http://dx.doi.org/10.1080/01431169608948984 - 13. Steininger, M.K. (2000) Satellite Estimation of Tropical Secondary Forest Above-Ground Biomass: Data from Brazil and Bolivia. International Journal of Remote Sensing, 21, 1139-1158.
http://dx.doi.org/10.1080/014311600210119 - 14. Lambin, E.F. (1997) Modeling and Monitoring Land-Cover Change Processes in Tropical Regions. Progress in Physical Geography, 21, 375-393.
http://dx.doi.org/10.1177/030913339702100303 - 15. Lopez, E., Bocco, G., Mendoza, M. and Duhau, E. (2001) Predicting Land Cover and Land Use Change in the Urban Fringe. A Case in Morelia City, Mexico. Landscape and Urban Planning, 55, 271-285.
http://dx.doi.org/10.1016/S0169-2046(01)00160-8 - 16. Zhou, Q., Li, B. and Sun, B. (2008) Modelling Spatio-Temporal Pattern of Landuse Change Using Multitemporal Remotely Sensed Imagery. The International Archives of the Photogrammetry, Remote Sensing and Spatial Information Sciences, 38, 729-734.
- 17. Kennedy, R.E., Townsend, P.A., Gross, J.E., Cohen, W.B., Bolstad, P., Wang, Y.Q. and Adams, P. (2009) Remote Sensing Change Detection Tools for Natural Resource Managers: Understanding Concepts and Tradeoffs in the Design of Landscape Monitoring Projects. Remote Sensing of Environment, 113, 1382-1396.
http://dx.doi.org/10.1016/j.rse.2008.07.018 - 18. Li, Y., Liao, Q.F., Li, X., Liao, S.D., Chi, G.B. and Peng, S.L., (2003) Towards an Operational System for Regional-Scale Rice Yield Estimation Using a Time-Series of Radarsat ScanSAR Images. International Journal of Remote Sensing, 24, 4207-4220.
http://dx.doi.org/10.1080/0143116031000095970 - 19. Almond, S. (2000) Itigi Thicket Monitoring Using Landsat TM Imagery. MSc Remote sensing Dissertation, University College, London.
- 20. Manyoni District Profile (2014) Data of Rainfall and Temperature from 1970 to 2013.
- 21. White, F. (1983) The Vegetation of Africa. UNESCO, Paris, 356 p.
- 22. URT (2008) Aghondi National Bee Reserve, Manyoni, District, Singida Region. Management Plan for the Period of Five Years 2008/2009-2012/2013, FBD, MNRT, 27 p.
- 23. Kashaigili, J.J., Mbilinyi, B.P., McCartney, M. and Mwanuzi, F.L. (2006) Dynamics of Usangu Plains Wetlands: Use of Remote Sensing and GIS as Management Decision Tools. Physics and Chemistry of the Earth, 31, 969-975.
http://dx.doi.org/10.1016/j.pce.2006.08.007 - 24. Kashaigili, J.J., Mdemu, M.V., Nduganda, A.R. and Mbilinyi, B.P. (2013) Integrated Assessment of Forest Cover Change and Above-Ground Carbon Stock in Pugu and Kazimzumbwi Forest Reserves, Tanzania. Advances in Remote Sensing, 2, 1-9.
http://dx.doi.org/10.4236/ars.2013.21001 - 25. Yesserie, A.G. (2009) Spatio-Temporal Land Use/Land Cover Changes Analysis and Monitoring in the Valencia Municipality, Spain. Dissertation for Award of MSc Degree at Universitat Jaume I, Castellón, Spain, 69 p.
- 26. Li, L., Zhang, L., Wang, H., Wang, J., Yang, J., Jiang, D., Li, J. and Qin, A.D. (2007) Assessing the Impact of Climate Variability and Human Activities on Stream Flow from the Wuding River Basin in China. Hydrological Processes, 21, 3485-3491.
http://dx.doi.org/10.1002/hyp.6485 - 27. Kashaigili, J.J. and Majaliwa, A.M. (2010) Integrated Assessment of Land Use and Cover Changes in the Malagarasi River Catchment in Tanzania. Physics and Chemistry of the Earth, 35, 730-741.
http://dx.doi.org/10.1016/j.pce.2010.07.030 - 28. Coppin, P., Jonckheere, I., Nackaerts, K., Muys, B. and Lambin, E. (2004) Digital Change Detection Methods in Ecosystem Monitoring: A Review. International Journal of Remote Sensing, 25, 1565-1596.
http://dx.doi.org/10.1080/0143116031000101675 - 29. Chakravarty, S., Ghosh, S.K., Suresh, C.P., Dey, A.N. and Shukla, G. (2014) Deforestation: Causes, Effects and Control Strategies.
http://cdn.intechopen.com/pdfs/36125/InTechDeforestation_causes_effects_and_control_ strategies.pdf - 30. FAO (2010) Global Forest Resources Assessment 2010. FAO Forestry Paper 163.
http://www.fao.org/docrep/013/i1757e/i1757e.pdf - 31. Mligo, C. (2012) Anthropogenic Disturbance on the Vegetation in Makurunge Woodland, Bagamoyo District, Tanzania. Tanzania Journal of Science, 37, 94-108.
- 32. Kaale, B.K., Ramadhani, H.K., Kimaryo, B.T., Maro, R.S. and Abdi, H. (2002) Participatory Forest Resource Assessment. MisituYetu Project, CARE Tanzania, Dar es Salaam, 81 p.
- 33. Cochrane, M.A., Alencar, A., Schulze, M.D., Souza, C.M., Nepstad, D.C., Lefebvre, P. and Davidson, E.A. (1999) Positive Feedbacks in the Fire Dynamic of Closed Canopy Tropical Forests. Science, 284, 1832-1835.
http://dx.doi.org/10.1126/science.284.5421.1832 - 34. Chapman, C.A. and Chapman, L.J. (1997) Forest Regeneration in Logged and Unlogged Forests in Kibale National Park, Uganda. Biotropica, 29, 396-412.
http://dx.doi.org/10.1111/j.1744-7429.1997.tb00035.x - 35. Chidumayo, E.N. (1984) Re-Assessment of Effects of fire on Miombo Regeneration in the Zambian Copperbelt. Journal of Tropical Ecology, 4, 361-372.
http://dx.doi.org/10.1017/S0266467400003011 - 36. Ahrends, A. (2005) Patterns of Degradation in Lowland Coastal Forests in Coast Region, Tanzania. A Thesis Submitted to the University of Greifswald in Candidacy for the Degree of “Diplom” (Master of Science German Equivalent).
http://www.rbge.org.uk/assets/files/science/Genetics_Conservation/Degradation %20of%20TCF%20-%20MSc%20A.%20Ahrends.pdf