Advances in Nanoparticles
Vol.2 No.1(2013), Article ID:27883,5 pages DOI:10.4236/anp.2013.21004
Distribution of c-erbB2 Antisense Probe Labeled with Superparamagnetic Iron Oxide Nanoparticles in the Major Organs of Mice on MR Imaging*#
Department of Radiology, The First Affiliated Hospital, Chongqing Medical University, Chongqing, China
Email: †13883669699@163.com
Received December 15, 2012; revised January 16, 2013; accepted January 28, 2013
Keywords: Antisense Oligodeoxynucleotide; Superparamagnetic Iron Oxide; MR Imaging; Iron Concentration; Vivo Distribution
ABSTRACT
Background: The aim of this study was to investigate the distribution of the c-erbB2 antisense probe labeled with superparamagnetic iron oxide nanoparticles in the major organs of mice by MR imaging. Methods: Sixty BALB/c mice were randomly divided into experimental and control groups. MR scans were performed in each mouse of the experimental group at five different time points (10, 30, 60, 180 and 360 min) after injection of the antisense probe. The signal from each major organ (liver, spleen, heart, kidney and muscle tissue) in comparison with the background signal (signal to noise ratio) was determined at each time point as a measure of the distribution of the antisense probe. Six control mice were killed at each of the same time points and the organs immediately removed for determination of their iron content. Results: After injection of the antisense probe, the highest enrichment of the probe was seen in the spleen, reaching a peak at 180 min, followed by the liver, muscle, heart and kidney. Conclusions: MR imaging can visualize the distribution of c-erbB2 antisense probe labeled with superparamagnetic iron oxide nanoparticles in the major organs of mice, and this may provide the basis for further in vivo studies of MR imaging time and dose selection.
1. Introduction
Molecular imaging, using technology widely used in clinical practice, can provide real-time images of the physiologic and pathologic processes inside organisms at the molecular level without injury. This technology can also visualize the expression of specific genes and proteins, allowing early intervention in pathologic processes. It can also reveal more in-depth information on the boilogy of tissue cells that are closer to the essence of life, including those involved in processes such as metabolism, proliferation, angiogenesis and gene expression. The use of molecular imaging not only helps improve the accuracy of early diagnosis of a tumor, but can also provide the necessary early clinical evidence of metastasis and prediction of efficacy of a particular therapy at the molecular level [1-5].
There are various modern imaging techniques that have been applied in molecular imaging studies [2,4], such as single photon emission computed tomography (SPECT), positron emission computed tomography (PET), near infrared radiation (NIR) imaging and magnetic resonance (MR) imaging. MR imaging is a safe, noninvasive, multifaceted and multiparameter imaging method, and it provides extremely precise spatial resolution in biological tissue and anatomical information that is not affected by the depth of imaging required. It is therefore considered the optimal analysis technique.
Superparamagnetic iron oxide (SPIO) has magnetic moments. Its volume is tiny and it is biologically degradable. It is a contrast agent with the ability to cause an obvious micro phase difference in the magnetic field gradients of surrounding protons, which leads to a significant decrease in the T2-weighted imaging signal in tissues. Thanks to these properties, the use of SPIO can lead to a significant increase in the detection rate of cells by MR scanning, and significant signal contrast can be produced in the MR image at ultralow concentrations (in the millimole range). All these factors make SPIO a promising compound for use in a wide range of applications and of high potential value in molecular imaging studies [6].
Some related products are now commercially available. However, SPIO enters and aggregates in the organism in a nontargeted manner, which leads to a low specificity. To solve this problem, we took the c-erbB2 oncogene as the target, and successfully prepared a c-erbB2 antisense probe labeled with SPIO nanoparticles based on the antisense gene theory [7,8]. Following preliminary experiments, we determined the related index and investigated the use of the probe as a contrast agent in MR imaging with the aim of revealing the rules governing its dynamic variation in animals to lay the foundation for its use in future MR studies in living organisms.
2. Materials and Methods
2.1. Materials
We prepared the c-erbB2 antisense probe labeled with SPIO nanoparticles by chemical crosslinking following specific steps described previously [7,8] (Chinese patent No. ZL 200710092512.5). Sixty BALB/c mice (weight 19 ± 0.7 g; 30 males, 30 females) were obtained from the Chongqing Experimental Animal Center. The equipment used included a 1.5-T MR scanner with a wrist surface coil (GE Healthcare, Waukesha, WI, USA), which is widely used clinically, and a Hitachi Z-5000 atomic absorption spectrometer (Hitachi, Japan) to measure the iron concentration in the organs of the mice.
2.2. Methods
We used two contrasting methods: MR imaging to measure the distribution of the antisense probe in the mice and at the same time atomic absorption spectroscopy to measure the iron content in the main organs of the mice.
To ensure consistency, the 60 BALB/c-mice were randomly divided into an experimental group (for MR scanning) and a control group (to provide the organs for measuring the iron content) with 30 mice in each group. Each mouse of the experimental group was successively placed into a custom-made plastic-capped glass bottle and injected with the antisense probe via a tail vein at a dose of 12 ml/kg (concentration of iron 4.11 mg/ml) using as reference the drug-time curve derived previously and the results of preliminary experiments. The mice were then placed in the wrist joint surface coil and the MR scans were acquired at five time points (10, 30, 60, 180 and 360 min) after injection. A T2*-weighted gradient echo sequence with the following parameters was used: repetition time/echo time 2000/80 ms, flip angle 15˚, slice thickness 5 mm, matrix 256 × 128, stimulation time 2, and field of view 10 cm. The signal strength and background noise of the liver, spleen, heart, kidney and muscle (right thigh) tissue were measured by selecting a region of interest in the largest displayed image of the organs, the diameter of the region of interest being onehalf of the organs in the plane image, and the SNR was calculated as the signal strength divided by the background noise. These mice were then killed and the iron content of the same organs determined as blank controls.
The mice of the control group were injected with the probe at the same dose, and six were killed at each of the same time points. The liver, spleen, heart, kidney, and right thigh were removed, washed with clean water and dried with filter paper. For each time point, 0.5 g of tissue was obtained from each organ, cut up and well mixed with 1 ml normal saline to form a homogenate. Aliquots of 200 μl of the homogenate were placed in crucibles which were placed in a muffle furnace and heated at 500˚C - 600˚C to decompose the organic material. The ash was removed from the crucibles and added to 4 ml concentrated hydrochloric acid to dissolve the sediment after cooling. The solution was then filtered and the filtrate collected. The filtrate was diluted as required to fall within the linear area of the standard concentration curve, and the iron content in the final solution determined using atomic absorption spectroscopy. The actual iron content was obtained by subtracting the iron content of the experimental organs from the iron content of the organs from the corresponding control group after injection at each time point.
2.3. Statistical Analysis
The data are reported as means ± standard deviation (SD). The data were analyzed using SAS 8.0 software and variance was analyzed using Dunnett’s test. P < 0.05 was accepted as indicating a significant difference.
3. Results
3.1. Method Validation
The distribution of the antisense probe in the liver, spleen, heart, kidney and muscle was determined from the standard curve with a good linear relationship within the measured range of concentrations (Table 1). The recoveries in three mass concentration ranges (low, medium, high) in tissues were 97.4% - 103.1%, the within-day precisions (relative SD) were in the range 1.36% - 3.97% and the day-to-day precisions (relative SD) were in the range 4.31% - 5.94%, all of which met the analytical requirements.
3.2. MR Imaging
As shown in Figure 1, the signals from the various organs were higher before injection and the signals at 10 min after injection had decreased (become darker). The lowest signals in the organs were seen at 180 min after injection, especially in the spleen. The SNR data shown
Table 1. Standard curve and linearity range of antisense probes in liver, spleen, heart, kidney and muscle.
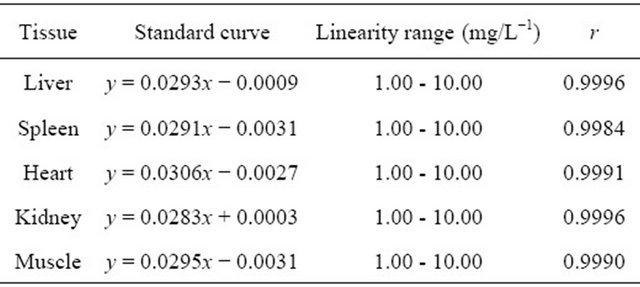
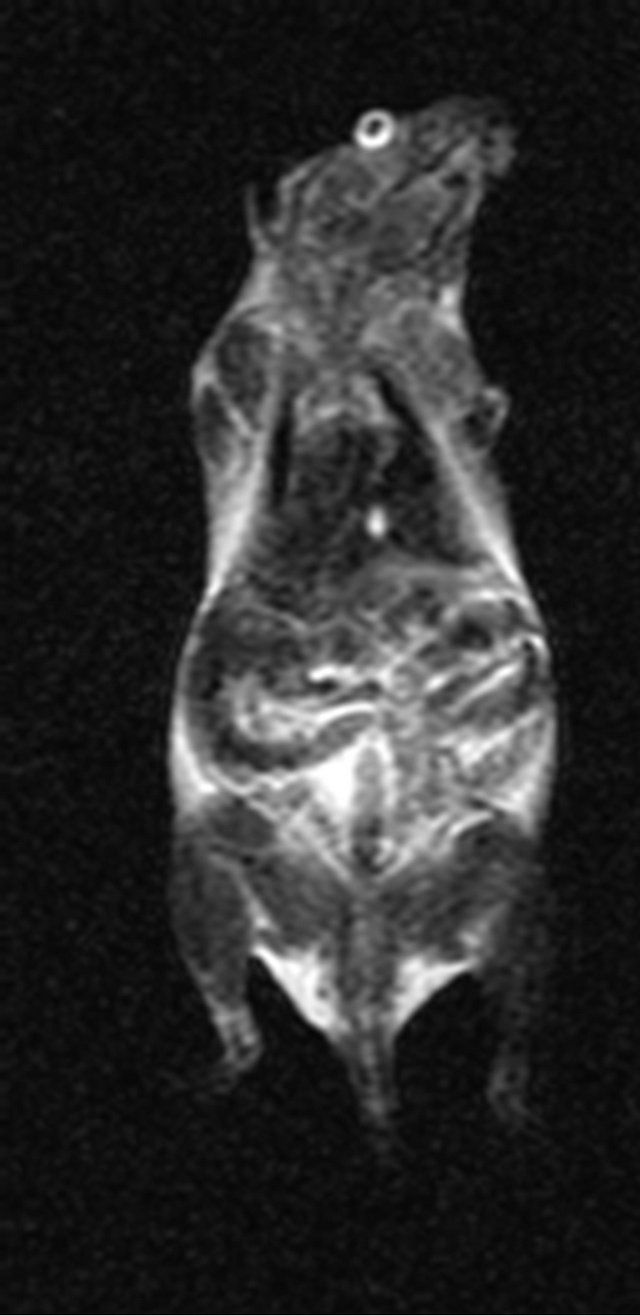
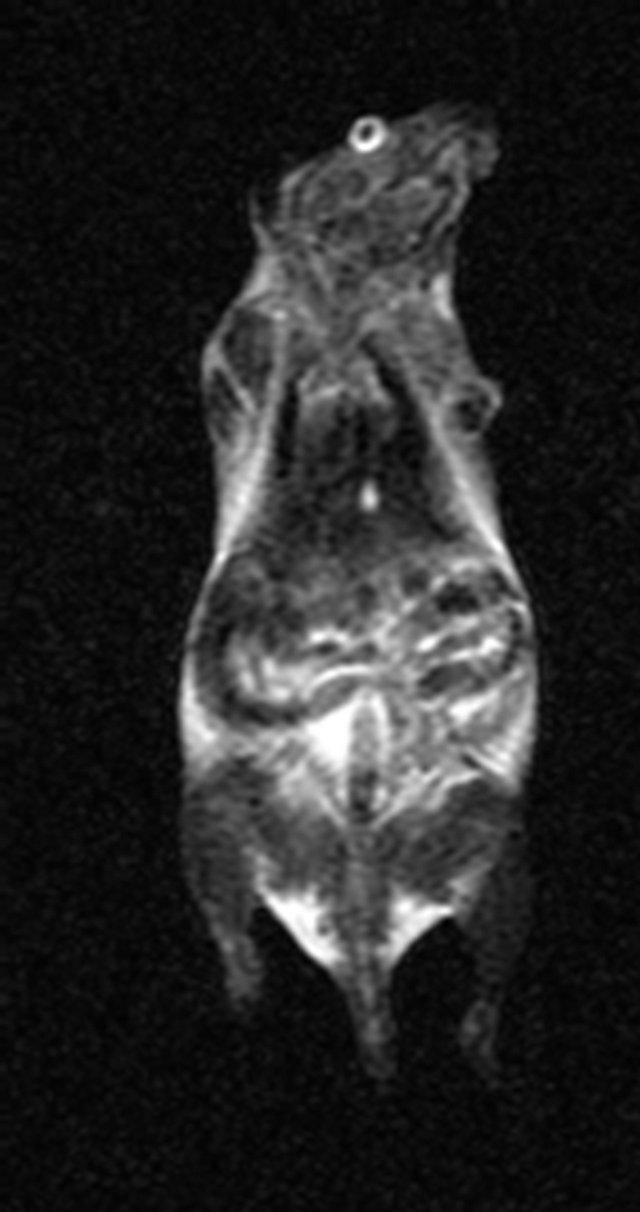
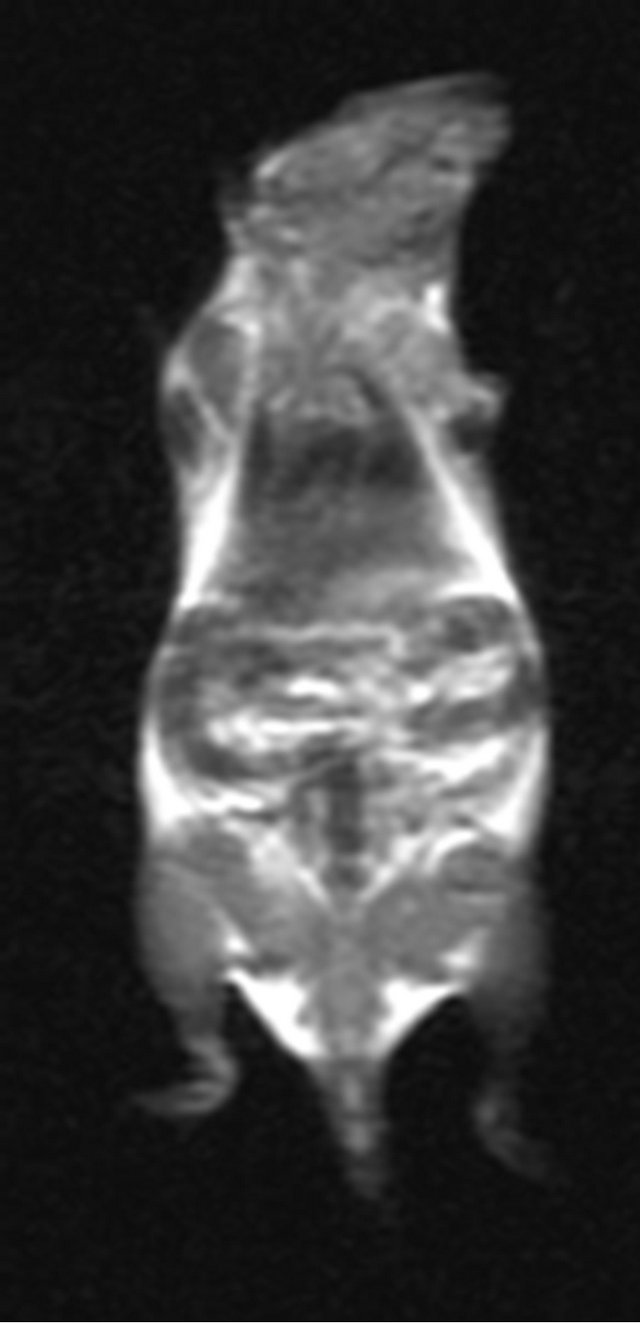
Before 10 min after injected 30 min after injected
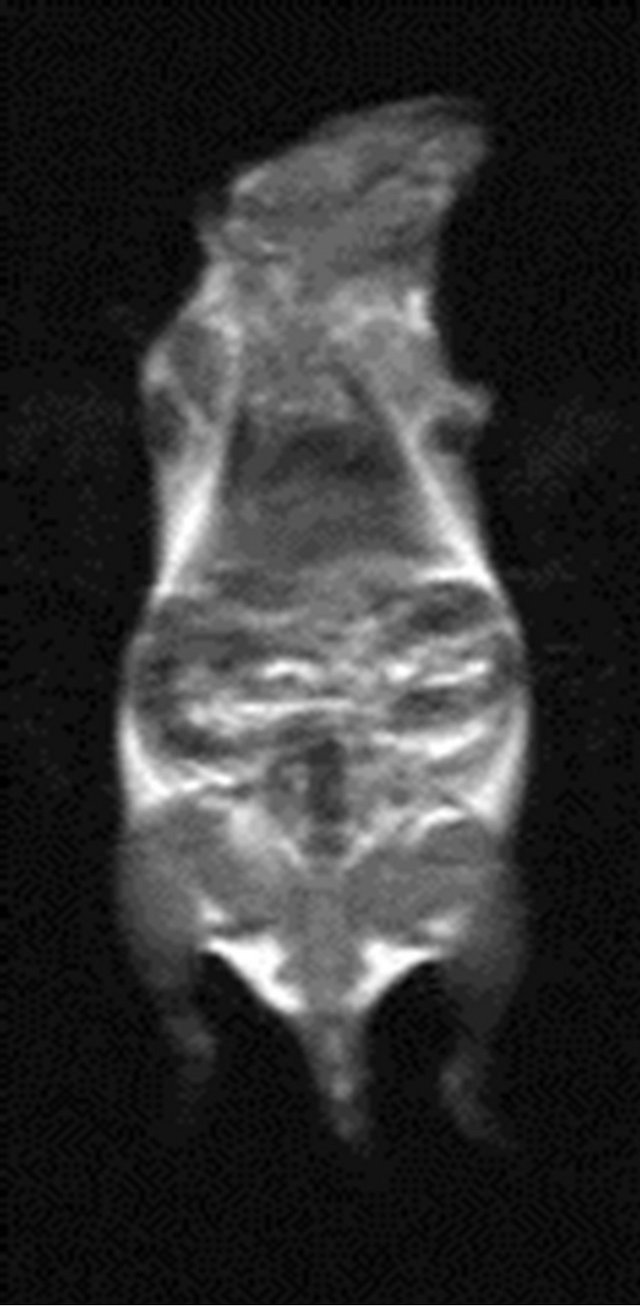
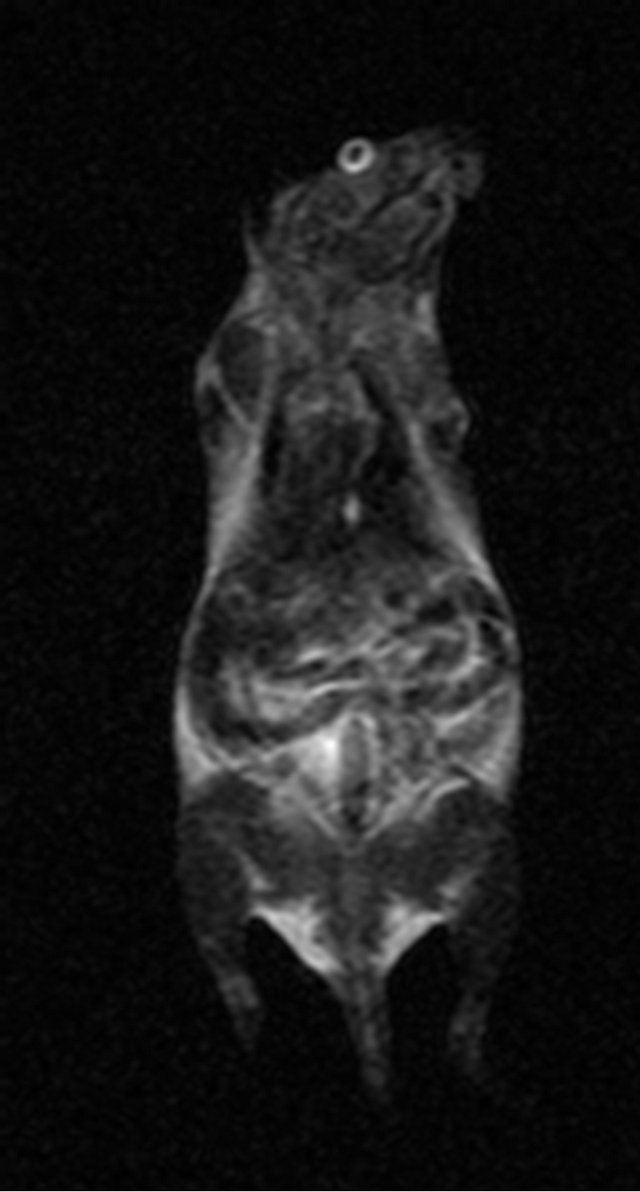
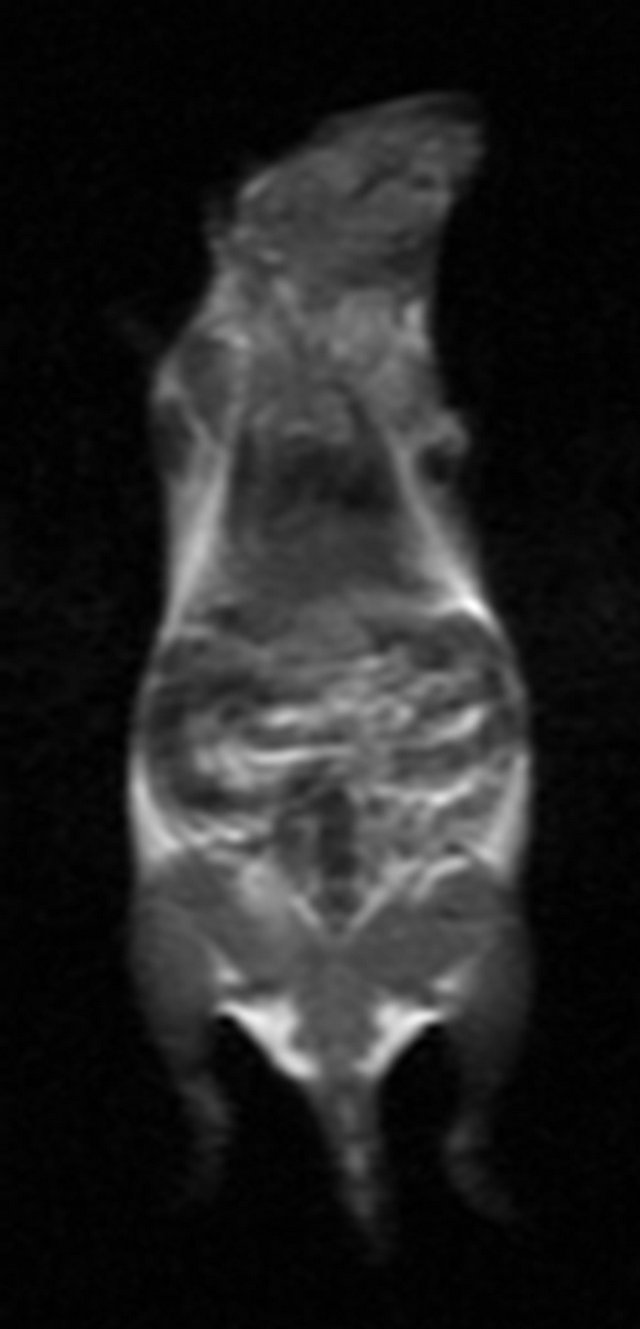
60 min after injected 180 min after injected 360 min after injected
Figure 1. MR imaging before and after injection of the antisense probe.
in Table 2 indicate consistency between the results of MR imaging and atomic absorption spectroscopy in the organs studied.
3.3. Atomic Absorption Spectroscopy
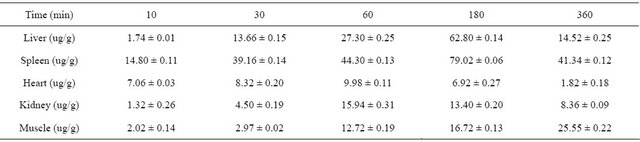
As shown in Table 3 and Figure 2, of all the organs studied, the spleen showed the highest accumulation of antisense probe, followed by the liver and kidney, with peaks at 180 min, 180 min and 60 min after injection, respectively. The results of Dunnett’s test of variance showed that the distribution of antisense probe in the spleen was significantly different from that in the other
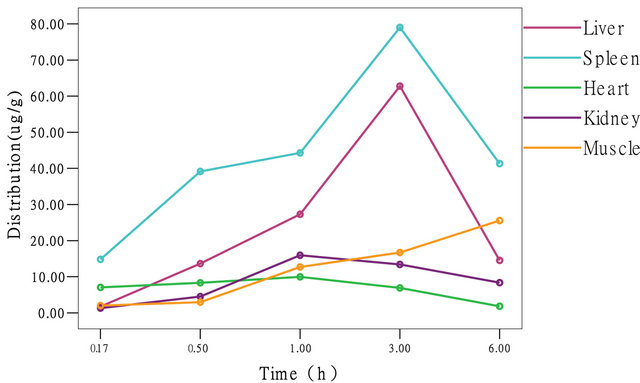
Figure 2. Distribution curve of antisense probes.
organs (α = 0.05, P = 0.017), the distribution of the probe in the liver was significantly different from that in the other organs (α = 0.05, P = 0.006), and the distribution of the probe in the kidney was significantly different from that in the other organs (α = 0.05, P = 0.022). However, the distribution of the probe in muscle tissue gradually increased becoming significantly different from the distribution in the other organs at later time points.
4. Discussion
To be able to diagnose a malignant tumor by MR molecular imaging, three aspects usually need to be considered in the preparation of targeted molecular probes [9,10]. First, regarding tumor-associated markers, to achieve active targeting, the probe’s surface should have reactive functional groups such as -COOH or -NH2 to obtain specific recognition of the tumor target. Second, in the physiological environment, the probe should be able to dissolve spontaneously to form a stable colloidal solution, to avoid the risk of causing an embolism in the blood or lymphatic system. Third, the probe should also have good biocompatibility, and the SPIO-modified material should not cause toxic local or systemic reactions.
Based on these considerations, our group selected the c-erbB2 oncogene as the target, because the amplification and expression of the c-erbB2 oncogene is common in breast cancer and gastrointestinal tumors [11,12], and it does not appear in normal tissue. We synthesized the sequence of the c-erbB2 oncogene antisense oligonucleotide (ASODN) according to the antisense gene theory. This sequence has functional groups, and has the basic properties for active targeting. In addition, before preparation of the antisense probe, we modified SPIO with dextran, and then used chemical crosslinking to connect the SPIO and the ASODN. The -OH group of the glucan coated on the surface of the SPIO facilitated the oxidation—reduction reaction with the amino group of the c-erbB2 oligodeoxynucleotide to form Schiff bases to tightly join the two groups by creating covalent bonds.
Our preliminary results showed [7,8] that antisense
Table 2. SNR data of main organ.

Table 3. Distribution data of antisense probes.
probe spheres with a diameter of about 25 - 40 nm disperse evenly, the rate of connection with the ASODN is 100% while still maintaining the original biological activity, and the connection is stable. In transfected SK-Br3 cells with high expression of the c-erbB2 oncogene, varying amounts of blue iron particles could be seen in the cytoplasm, and the intracellular iron content was significantly higher than in cells without the c-erbB2 oncogene. MR imaging showed that the weakest signal strength and lowest noise ratio occurred in the nontransfected cells. Further investigation of probes in tumorbearing animals is certainly needed to confirm this visual diagnostic method and the ability to target therapy towards c-erbB2 oncogene expression. An understanding of the distribution of the probe in the major organs of the body, and of the basic parameters, may provide the basis for determining in vivo MR scan times and dose selection.
Molecular imaging probes are special pharmaceutical preparations that together with medical imaging techniques (such as SPECT, PET, NIR, and MR) can be seen to combine with characteristic molecules of a disease [10,13]. Regarding the design of this study, we decided to collect the data from six mice at each time point. In addition, we had assessed the general range of plasma concentrations of the drug in preliminary experiments. During the subsequent experiments, the drug concentrations were determined in successive 50% dilutions of the sample until the concentration reached the range 1 - 10 mg/l on the standard curve (the original concentrations were then calculated by multiplication according to the dilution). Thus the results obtained in these experiments were accurate and reliable. And it is worth mentioning that the experiments were conducted to observe the distribution of the antisense probe in mice using two different methods of detection. MR imaging was used to determine the distribution of the probe in the studied organs in terms of the SNR and atomic absorption spectroscopy to determine the iron content in the same organs. In this way the results could be mutually validated to ensure consistency.
To provide basic pharmacokinetic parameters for subsequent in vivo imaging of tumor-bearing animals, the liver, spleen, heart, kidney and muscle were chosen for study based on the preliminary experiments. Experimental results show that, Antisense probes are rapidly distributed in various organs and tissues after intravenous injection. Accumulation of the probe was highest in the spleen, followed by the liver, muscle, heart and kidney, suggesting that the metabolism of the probe is related to the reticuloendothelial system, which is in accord with the distribution of SPIO after intravenous injection reported in the literature [14,15]. However, as shown in Table 3 and Figure 2, the peak distribution of the probe in the liver, spleen, heart and kidney occurred 3 h after injection, and then decreased significantly, but in muscle the probe showed a different characteristic distribution with a gradual increase. This phenomenon may be very useful for MR imaging of tumor-bearing animals, and also indicates that the observation time should be extended in MR imaging of tumor-bearing animals.
To sum up, MR imaging can visualize the distribution of c-erbB2 antisense probe labeled with superparamagnetic iron oxide nanoparticles in the major organs of mice, and this may provide the basis for further in vivo studies of MR imaging time and dose selection.
REFERENCES
- N. Grenier and P. Brader, “Principles and Basic Concepts of Molecular Imaging,” Pediatric Radiology, Vol. 41, No. 2, 2011, pp. 144-160. doi:10.1007/s00247-010-1835-z
- J. C. Gore, H. C. Manning, C. C. Quarles, et al., “Magnetic Resonance in the Era of Molecular Imaging of Cancer,” Magnetic Resonance Imaging, Vol. 29, No. 5, 2011, pp. 587-600. doi:10.1016/j.mri.2011.02.003
- M. H. Michalski and X. Chen, “Molecular Imaging in Cancer Treatment,” European Journal of Nuclear Medicine and Molecular Imaging, Vol. 38, No. 2, 2011, pp. 358-377. doi:10.1007/s00259-010-1569-z
- M. R. Makowski, A. J. Wiethoff, C. H. Jansen, et al., “Molecular Imaging with Targeted Contrast Agents,” Topics in Magnetic Resonance Imaging, Vol. 20, No. 4, 2009, pp. 247-259. doi:10.1097/RMR.0b013e3181ea28b1
- M. A. Pysz, S. S. Gambhir and J. K. Willmann, “Molecular Imaging: Current Status and Emerging Strategies,” Clinical Radiology, Vol. 65, No. 7, 2010, pp. 500-516. doi:10.1016/j.crad.2010.03.011
- R. F. Minchin and D. J. Martin, “Nanoparticles for Molecular Imaging—An Overview,” Endocrinology, Vol. 151, No. 2, 2010, pp. 474-481. doi:10.1210/en.2009-1012
- M. Wen, B. Li, W. Bai, et al., “Application of Atomic Force Microscopy in Morphological Observation of Antisense Probe Labeled with Magnetism,” Molecular Vision, Vol. 14, No. 1, 2008, pp. 114-117.
- M. Wen, B. Li, Y. Ouyang, et al., “Preparation and Quality Test of Superparamagnetic Iron Oxide Labeled Antisense Oligodeoxynucleotide Probe: A Preliminary Study,” Annals of Biomedical Engineering, Vol. 37, No. 6, 2009, pp. 1240-125. doi:10.1007/s10439-009-9683-4
- R. Qiao, J. Zeng, Q. Jia, et al., “Magnetic Iron Oxide Nanoparticle—An Important Cornerstone of MR Molecular Imaging of Tumors,” Acta Physico-Chimica Sinica, Vol. 28, No. 5, 2012, pp. 993-1011.
- K. Chen and X. Chen, “Design and Development of Molecular Imaging Probes,” Current Topics in Medicinal Chemistry, Vol. 10, No. 12, 2010, pp. 1227-1236. doi:10.2174/156802610791384225
- P. Padmanabhan, J. Goggi, R. Bejot, et al., “Molecular Targeting of Breast Cancer: Imaging and Therapy,” Current Pharmaceutical Biotechnology, Vol. 12, No. 4, 2011, pp. 528-538. doi:10.2174/138920111795163959
- J. Capala and K. Bouchelouche, “Molecular Imaging of HER2-Positive Breast Cancer: A Step toward an Individualized Image and Treat Strategy,” Current Opinion in Oncology, Vol. 22, No. 6, 2010, pp. 559-566. doi:10.1097/CCO.0b013e32833f8c3a
- M. E. Seaman, G. Contino, N. Bardeesy, et al., “Molecular Imaging Agents: Impact on Diagnosis and Therapeutics in Oncology,” Expert Reviews in Molecular Medicine, Vol. 12, 2010, p. e20. doi:10.1017/S1462399410001511
- J. W. Bulte and D. L. Kraitchman, “Iron Oxide MR Contrast Agents for Molecular and Cellular Imaging,” NMR in Biomedicine, Vol. 17, No. 7, 2004, pp. 484-499. doi:10.1002/nbm.924
- H. Ittrich, C. Lange, F. Togel, et al., “In Vivo Magnetic Resonance Imaging of Iron Oxide-Labeled, ArteriallyInjected Mesenchymal Stem Cells in Kidneys of Rats with Acute Ischemic Kidney Injury: Detection and Monitoring at 3T,” Journal of Magnetic Resonance Imaging, Vol. 25, No. 6, 2007, pp. 1179-1191. doi:10.1002/jmri.20925
NOTES
*This work was supported by the National Natural Science Foundation of China (No. 30940021), the Natural Science Foundation of Chongqing City (CSTC 2008BB5209), the Medicine Scientific Research Project of Chongqing Health Bureau (No. 062025), and Medicine Scientific Funds of the First Affiliated Hospital of Chongqing Medical University (No. YXJJ2009-008).
#There is no conflict of interest.
†Corresponding author.