American Journal of Plant Sciences
Vol.07 No.06(2016), Article ID:65602,7 pages
10.4236/ajps.2016.76071
Responses of Flowering Time to Elevated Carbon Dioxide among Soybean Photoperiod Isolines
James A. Bunce1,2, Wilbert Cruz Hilacondo1,2
1USDA-ARS Crop Systems and Global Change Laboratory, Beltsville, MD, USA 2Instituto Nacionale de Innovacion Agraria, La Molina, Peru

Copyright © 2016 by authors and Scientific Research Publishing Inc.
This work is licensed under the Creative Commons Attribution International License (CC BY).
http://creativecommons.org/licenses/by/4.0/


Received 26 February 2016; accepted 16 April 2016; published 19 April 2016
ABSTRACT
Changes in the phenology of flowering in soybeans caused by long-term growth at elevated CO2 may be important to the responses of seed yield to elevated CO2. Here we utilized near-isogenic lines of soybeans differing in three genes influencing photoperiod sensitivity to determine whether these genes affected the response of flowering time to elevated CO2. Six isolines of Harosoy 63 were grown at ambient (380 μmol∙mol−1) and elevated (560 μmol∙mol−1) CO2 concentrations in the field using free-air CO2 enrichment systems, in air-conditioned glasshouses with natural summer photoperiods, and in indoor chambers with day lengths of 11, 13, 15, and 17 hours. The effect of CO2 concentration on flowering time varied with genotype, and there was also an interaction between CO2 and photoperiod in all genotypes, as indicated by ANOVA. Elevated CO2 accelerated flowering in some cases, and delayed it in other cases. For all three of the isolines with single dominant genes, elevated CO2 decreased the days to first open flower at the longest photoperiod. At the shortest photoperiod, elevated CO2 delayed flowering in all but one isoline. The all-recessive isoline had slower flowering at elevated CO2 at both the shortest and the longest photoperiods, and also in the field and in the glasshouse. Delayed flowering at elevated CO2 in the field and glasshouse was associated with an increased final number of main stem nodes. It is concluded that the E1, E3, and E4 genes each influenced how the time to first flowering was affected by CO2 concentration at long photoperiods.
Keywords:
Carbon Dioxide Concentration, Flowering, Soybean, Photoperiod, Isolines

1. Introduction
Some experiments growing soybeans at different carbon dioxide concentrations have indicated that carbon dioxide concentration may affect the time of initial flowering (reviewed in Ellis et al. 1995). In some cases first flowering was earlier at elevated than at lower carbon dioxide, while the opposite response occurred in some other cases [1] [2] . No change has also been found in other cultivars. Comparisons of soybean cultivars at ambient and elevated carbon dioxide both in indoor controlled environment chambers and in the field indicated that the duration of vegetative growth, as affected by flowering phenology, was a significant source of variation in the stimulation of yield by elevated carbon dioxide [1] . Thus adaptation of soybeans to rising atmospheric carbon dioxide may benefit from a better understanding of carbon dioxide effects on flowering.
Both delaying and accelerating effects of elevated carbon dioxide on the time to first flowering have been found in several species in addition to soybean [3] . In some, but not all cases, faster flowering at elevated carbon dioxide could be attributed to a generalized acceleration of development as indicated by increased rates of leaf initiation [3] . In this work we tested for carbon dioxide effects on leaf initiation rate in soybean. However, acceleration of development at elevated carbon dioxide would not account for any delayed flowering at elevated carbon dioxide.
In soybeans, long photoperiods delay flowering in photoperiodically sensitive genotypes, and several different genes influencing the photoperiodic response of flowering have been identified [4] [5] . In the cultivar Harosoy 63, near isogenic lines (“isolines”) of dominant and recessive combinations of the photoperiod sensitive genes E1, E3, and E4 had been previously developed [6] , and were used in these experiments in order to determine whether any of these three genes caused elevated carbon dioxide concentration to affect the timing of flowering. Tests were conducted in the field, using free-air carbon dioxide enrichment systems, and in indoor chambers using a range of constant photoperiods at constant temperature. Additional tests were conducted in air conditioned glasshouses, with a typical planting date for soybeans at Beltsville, Maryland, USA, so that plants were exposed to a real, naturally varying photoperiod at constant temperature.
2. Materials and Methods
Six near-isogenic lines of Harosoy 63 (Table 1) were used in this study. Details of the origin of these isolines are given in [6] . The E1e3E4 isoline did not flower in the field or glasshouse experiments by the time flowering had ceased in all the other isolines (60 days after planting), so was not included in the indoor experiments with the two longest photoperiods.
In one experiment, five pots of each isoline were planted in each of two identical, unshaded, air conditioned glasshouses on June 3, 2014. The glasshouses were set to a constant temperature, and shaded, ventilated air temperatures were recorded every 15 minutes. The mean air temperature was 25.2˚C in the ambient CO2 glasshouse and 25.3˚C in the elevated CO2 glasshouse. The CO2 concentration in both glasshouses was continuously measured using infrared gas analyzers (WMA-4, PP Systems, Amesbury, MA) which were calibrated weekly. The CO2 concentration was uncontrolled in one glasshouse, and a vent was left open so that the CO2 concentration inside did not deviate by more than 10 μmol∙mol−1 from that of outside air. Pure CO2 was added to the other glasshouse to keep it 180 ± 10 μmol∙mol−1 above that of the glasshouse without CO2 control, using a PID controller operating a solenoid valve. Typical daily time-courses of CO2 concentration are given in Figure 1, although the ambient night time CO2 concentration varied greatly with outside wind speed. The mean CO2 concentration in the ambient glasshouse was 416 μmol∙mol−1, and it was 596 μmol∙mol−1 in the elevated glasshouse. Seeds were sown in 2 liter plastic pots filled with peat moss, and were watered once or twice daily, and fertilized with a slow-release complete fertilizer. Seedlings were thinned to one per pot a few days after emergence. Flowering stages [7] were routinely recorded three times per week, and daily at critical stages of development, until flowering had ceased in all except the E1e3E4 isoline, which had not yet flowered. In addition to the flowering stages identified by Fehr et al. [7] , the time of first open flower at the apical mainstem node was recorded for each plant. After all flowering and leaf initiation had ceased, the total number of mainstem nodes was determined for each plant. ANOVA was used to compare the mean values of the five plants per line in each glasshouse, recognizing that this was pseudo-replication.
In 2015, all the isolines were grown in field plots in Beltsville, Maryland at ambient (approximately 400 μmol∙mol−1 during midday) and elevated (ambient + 180 μmol∙mol−1) CO2 concentrations, using an area distributed free-air carbon dioxide enrichment system [1] . The midday CO2 concentrations in the field plots averaged

Table 1. Near-isogenic lines of Harosoy 63 used in these CO2 studies. PI is the identification number in the USDA-ARS Germplasm Resources Information Network system.
aHarosoy 63 is e1e2E3E4e5Dt1 [4] ; bOnly substituted alleles are indicated in the name.
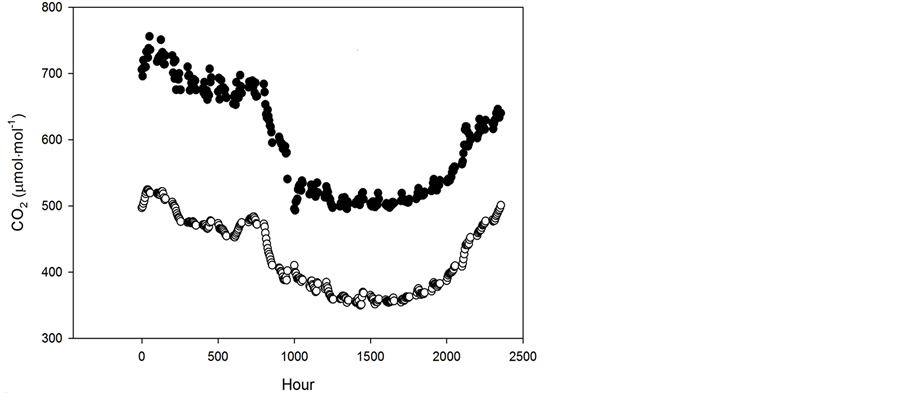
Figure 1. Typical daily time courses of CO2 concentration in uncontrolled (open symbols) and elevated (filled symbols) air conditioned glasshouses.
388 μmol∙mol−1 for the ambient treatment and 572 μmol∙mol−1 for the elevated treatment. The elevated CO2 treatment was applied 24 h per day from planting. There were 3 replicate plots per CO2 treatment, with all isolines grown in each plot. Plots were planted on May 28, 2015. Flowering stages were monitored daily during crucial stages on five plants per plot. Final mainstem node number was determined at maturity. ANOVA was used to compare the two CO2 treatments for each line, with n = 3 plot replicates.
The isolines were also grown in indoor chambers with constant photoperiods of 11, 13, 15, and 17 hours. The total light per day therefore varied with photoperiod, which is also what occurs under field conditions. Air temperatures were constant at 25˚C, and relative humidity was 60%. Daytime CO2 concentrations of 380 or 560 μmol∙mol−1, and night time concentrations of 420 and 600 μmol∙mol−1 were maintained by either adding pure CO2, or air which had been scrubbed of CO2 under the control of infrared CO2 analyzers which sampled air from each chamber continuously. Light was provided by a mixture of 400 W high pressure sodium and metal halide lamps at 1000 μmol−2∙s−1 of photosynthetically active radiation. Plants were grown in 2 liter plastic pots filled with vermiculite and flushed once or twice per day with a complete nutrient solution. Four different chambers were used, with CO2 treatments rotated among chambers. For each photoperiod, there were two chambers at low and two at elevated CO2. There were five pots per isoline in each chamber, with one plant per pot. Environmental conditions in the chambers were logged every 15 minutes, and calibration of light, temperature and humidity sensors was performed at the beginning and end of each experiment. The calibration of the CO2 analyzers was checked weekly. Vegetative and reproductive stages were recorded for every plant every 1 to 3 days until a flower opened on the mainstem of that plant. Each of the 4 photoperiod by 2 CO2 treatments conditions was repeated in different chambers, and statistical comparisons are based on n = 2 chamber replicates per treatment. The number of days between the unfolding of the 5th and 12th mainstem leaves was also recorded for each plant.
3. Results
In the glasshouse and field experiments, the E1e3E4 isoline never flowered, so is not considered further in these experiments. Of the other five isolines in the glasshouse experiment, the e1e3e4 isoline had first flowering (R1) delayed by elevated CO2, while R1 was earlier at elevated CO2 in the e1E3e4 isoline, and was unaffected by CO2 in the three other isolines (Table 2). The number of days between R1 and R5 was increased by elevated CO2 in the e1e3e4 and isoline, but was not affected by CO2 in the other isolines (Table 2). Flowering at the apical main stem node was also delayed by elevated CO2 in the e1e3e4 isoline, and the number of main stem nodes at maturity was increased by elevated CO2 only in the e1e3e4 isoline (Table 2).
The field experiments produced very nearly the same patterns of flowering responses to CO2 as observed in the glasshouse (Table 3), although each developmental stage was slightly delayed in the field compared with the glasshouse experiment. The mean temperature was 23.7˚C in the field during the experimental period. The R1
Table 2. Flowering characteristics and final main stem node numbers of soybean isolines grown in glasshouses at ambient (A) and elevated (E) CO2. Days refer to days from planting.
* indicates a significant effect of CO2 concentration at P = 0.05 for that isoline, based on n = 5 plants in each glasshouse.
Table 3. Flowering characteristics and final main stem node numbers of soybean isolines grown in the field at ambient (A) and elevated (E) CO2. Days refer to days from planting.
* indicates a significant effect of CO2 concentration at P = 0.05 for that isoline, based on 3 replicate plots per CO2 treatment.
stage and the time of flowering at the apical node were delayed by elevated CO2 only in the e1e3e4 isoline, and R1 was earlier at elevated CO2 in the e1E3e4 isoline. Final mainstem node number was increased by elevated CO2 only in the e1e3e4 isoline (Table 3).
The time to R1 in the glasshouse for each CO2 and isoline agreed quite well with the results from the indoor chambers, if one assumes a photoperiod of between 15.5 and 16 hours in the glasshouse (Figure 1). This would be consistent with photoperiod corresponding approximately to the duration of Civil Twilight at Beltsville for the glasshouse experimental period. Civil Twilight ranged from 15 h 50 minutes to 15 h 59 minutes (http://aa.usna.navy.mil/cgi-bin/aa_rstablew.pl) between planting and day 32, which was the last date of reaching R1 for these isolines.
In the indoor chamber experiments, the effect of CO2 concentration on the time to R1 varied among isolines, and for all isolines there was a significant interaction between CO2 and photoperiod as determined by ANOVA (Figure 2). Elevated CO2 delayed R1 in e1e3e4 by slightly more than a day at both the 11 and 17 hour photoperiods, but not at the intermediate photoperiods. In e1e3E4 elevated CO2 delayed R1 with 11 hour days, but accelerated R1 at 15 and 17 hours. Elevated CO2 delayed R1 by 1.2 to 1.6 days in E1e3e4 at the three shorter photoperiods, but accelerated it by 2 days at the longest photoperiod. The largest CO2 effects were in e1E3e4, where elevated CO2 accelerated R1 by 3.6 days with the 17 hour photoperiod, and in e1E3E4, where elevated CO2 delayed R1 by 3 days at the shortest photoperiod (Figure 2). At the shortest photoperiod, elevated CO2 delayed R1 in five of the six isolines. In most cases when e1 was present, the time to R1 was longer for the 11 than for the 13 hour photoperiod, whereas when E1 was present, R1 occurred either at the same time or earlier at the 11 than at the 13 hour photoperiod (Figure 2). The mean number of days between the unfolding of mainstem leaves 5 and 12 was 14.0 ± 0.3 days for all isolines, photoperiods, and CO2 treatments.
4. Discussion
There was no replication of the glasshouse environments in this study. However, the responses of flowering times to the CO2 treatments observed in the glasshouse were consistent with the patterns observed in the field tests, which were replicated, and also fit well with the patterns of flowering in response to photoperiod length in the indoor chambers, which were also replicated. The effect of CO2 on flowering time of each isoline observed in the glasshouse was predictable from the responses observed in the indoor chambers with the assumption of a photoperiod of 15.5 to 16 hours in the glasshouse. Based on these plant responses, and the frequent recording of environmental conditions, it is unlikely that actual experimental conditions in the glasshouses varied significantly from the programmed conditions.
It is clear that each of the three of the photoperiod genes studied resulted in an effect of CO2 on flowering time. This is shown by the earlier flowering at elevated CO2 in all three of the single dominant gene isolines when grown at the 17 hour photoperiod, which contrasts with the later flowering at elevated CO2 in the all recessive isoline at the same photoperiod. When these dominant photoperiod genes were ineffective in delaying flowering because of being grown at the shortest photoperiod, all but one of the isolines had slower flowering at elevated CO2. At the intermediate photoperiods, CO2 consistently affected flowering only in E1, which suggested that E1 required a longer photoperiod for elevated CO2 to switch from delaying to accelerating flowering than occurred in the other single dominant isolines. Faster flowering at elevated CO2 for long photoperiods means that elevated CO2 makes these photoperiod sensitive genes less effective. Elevated CO2 could possibly speed flowering time by increasing the overall rate of plant development by increasing energy supply. However, at the shortest photoperiod, when such an effect would be magnified, elevated CO2 actually slowed flowering in all isolines. Additionally, no effect of CO2 concentration on the rate of leaf initiation occurred at any photoperiod. Tissue warming by elevated CO2 may also occur due to reduced transpiration and could affect overall rates of development. However, this is not consistent with the observed slowing of flowering by elevated CO2 at short photoperiods.
The E3 and E4 genes are known to be related to two different forms of phytochrome A [5] . The E3 and E4 genes have been reported to slow the progression of flowering after R1 in addition to delaying R1 [8] [9] , while E1 only delayed R1. In our glasshouse data, this distinction among E1 and E3 and E4 was not reflected in the days between R1 and R5, but was reflected in the days to flowering at the apex, which was longer for e1E3e4, e1e3E4 and especially e1E3E4 than it was for E1e3e4. However, elevated CO2 did not affect either the days between R1 and R5, or the days to flowering at the apex in any of the isolines which had at least one dominant
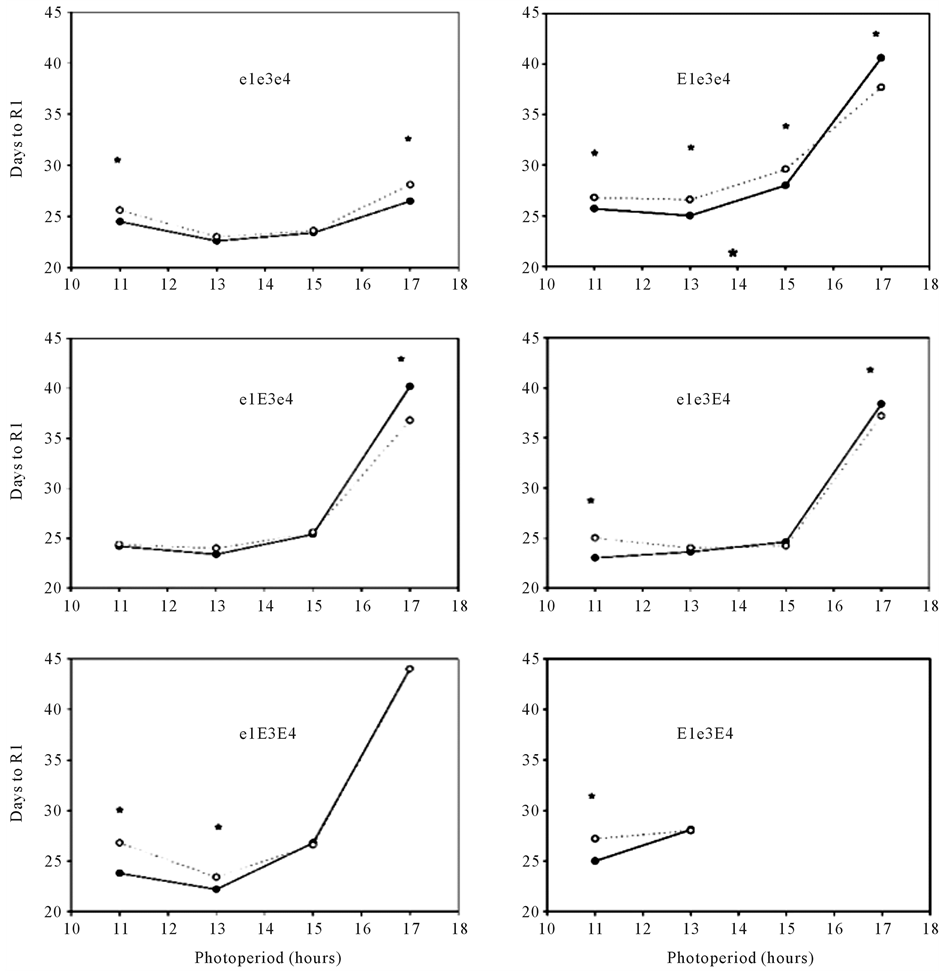
Figure 2. Days to first open flower (R1) in soybean isolines grown with four photoperiods at 380 (filled symbols) or 560 (open symbols) μmol∙mol−1 daytime CO2 concentrations in indoor chambers. * indicates a significant effect of CO2 concentration at that photoperiod, based on n = 2 chambers per treatment.
allele. In Arabidopsis thaliana, two different phytochrome B mutants showed CO2 effects on the leaf number at flower bud formation when grown with a short photoperiod [10] , but the phytochrome A mutant tested showed no effect of CO2 on flowering. There was a strong interaction between photoperiod and CO2 in their effects on flowering in Arabidopsis thaliana wild type and photoperiod mutants [10] , as found here in soybean.
In our prior work with other soybean cultivars [1] , there was no correlation between CO2 effects on the time of first flowering and the rate of progression through flowering stages, and the time of flowering at the apical node and the number of main stem nodes at maturity. However, in this comparison of photoperiod isolines all within one cultivar, these responses were all correlated with each other in the glasshouse and field experiments, with elevated CO2 delaying flowering in the all recessive isoline, increasing the days between R1 and R5, increasing the days to first flowering at the apical main stem node, and increasing the final number of main stem nodes in both the glasshouse and in the field. While an increase in main stem nodes from about 15 to 17 observed here in the all recessive isoline may seem too small to have much impact on seed yield, often in field situations there are no pods on the lowest 5 or more nodes, and often no axillary branches, so the total number of pods could be increased by about 20% just by the delay in flowering observed at elevated CO2. Previous work with different soybean cultivars in the field indicated a strong correlation between the increase in main stem node number at elevated CO2 and the increase in seed yield (Bunce, 2015).
These experiments did not indicate why elevated CO2 slowed flowering at short photoperiods, since nearly all of the isolines tested responded similarly to CO2 at short photoperiods. However, these experiments indicated that the E1, E3 and E4 genes all caused faster flowering at elevated CO2 at the longest photoperiod used. The E1, E3 and E4 isolines varied in the effect of CO2 on flowering time at intermediate photoperiods. Variation among soybean cultivars in these photoperiod genes could be a source of variation in effects of elevated CO2 on flowering phenology and possibly on yield.
Cite this paper
James A. Bunce,Wilbert Cruz Hilacondo, (2016) Responses of Flowering Time to Elevated Carbon Dioxide among Soybean Photoperiod Isolines. American Journal of Plant Sciences,07,773-779. doi: 10.4236/ajps.2016.76071
References
- 1. Bunce, J.A. (2015) Elevated CO2 Effects on Reproductive Phenology and Seed Yield among Soybean Cultivars. Crop Science, 55, 339-343.
http://dx.doi.org/10.2135/cropsci2014.04.0273 - 2. Ellis, R.H., Crauford, P.Q., Summerfield, R.J. and Roberts, E.H. (1995) Linear Relations between Carbon Dioxide Concentration and Rate of Development towards Flowering in Sorghum, Cowpea and Soybean. Annals of Botany, 75, 193-198.
http://dx.doi.org/10.1006/anbo.1995.1012 - 3. Springer, C.J. and Ward, J.K. (2007) Flowering Time and Elevated Atmospheric CO2. New Phytologist, 176, 243-255.
http://dx.doi.org/10.1111/j.1469-8137.2007.02196.x - 4. Cober, E.R., Tanner, J.W. and Voldeng, H.D. (1996) Genetic Control of Photoperiod Response in Early-Maturing, Near-Isogenic Soybeans Lines. Crop Science, 36, 601-605.
http://dx.doi.org/10.2135/cropsci1996.0011183X003600030013x - 5. Cober, E.R. and Morrison, M.J. (2010) Regulation of Seed Yield and Agronomic Characters by Photoperiod Sensitivity and Growth Habit Genes in Soybean. Theoretical and Applied Genetics, 120, 1005-1012.
http://dx.doi.org/10.1007/s00122-009-1228-6 - 6. Cober, E.R., Tanner, J.W. and Voldeng, H.D. (1996b) Soybean Photoperiod-Sensitivity Loci Respond Differentially to Light Quality. Crop Science, 36, 606-610.
http://dx.doi.org/10.2135/cropsci1996.0011183X003600030014x - 7. Fehr, W.R., Caviness, C.E., Burmood, D.T. and Pennington, J.S. (1971) Stage of Development Descriptions for Soybeans, Glycine max (L.) Merr. Crop Science, 11, 929-931.
http://dx.doi.org/10.2135/cropsci1971.0011183X001100060051x - 8. McBain, B.A., Hesketh, J.D. and Bernard, R.L. (1987) Genetic Effects on Reproductive Phenology in Soybean Isolines Differing in Maturity Genes. Canadian Journal of Plant Science, 67, 105-116.
http://dx.doi.org/10.4141/cjps87-012 - 9. Saindon, G. Beversdorf, W.D. and Voldeng, H.D. (1989) Adjustment of the Soybean Phenology Using the E4 Locus. Crop Science, 29, 1361-1365.
http://dx.doi.org/10.2135/cropsci1989.0011183X002900060006x - 10. Song, X., Kristie, D.N. and Reekie, E.G. (2008) Why Does Elevated CO2 Affect Time of Flowering? An Exploratory Study Using the Photoperiodic Flowering Mutants of Arabidopsis thaliana. New Phytologist, 181, 339-346.
http://dx.doi.org/10.1111/j.1469-8137.2008.02669.x