American Journal of Plant Sciences
Vol.4 No.6(2013), Article ID:32853,8 pages DOI:10.4236/ajps.2013.46145
Growth and Yield Responses of Switchgrass Ecotypes to Temperature
![]()
Department of Plant and Soil Sciences, Oklahoma State University, Stillwater, USA.
Email: *v.g.kakani@okstate.edu
Copyright © 2013 Tanka Prasad Kandel et al. This is an open access article distributed under the Creative Commons Attribution License, which permits unrestricted use, distribution, and reproduction in any medium, provided the original work is properly cited.
Received February 21st, 2013; revised March 29th, 2013; accepted April 15th, 2013
Keywords: Biomass Partitioning; Chemical Composition; Growth Response; Switchgrass; Temperature
ABSTRACT
Varietal differences of switchgrass in growth and development, biomass yield and partitioning in response to temperature are not well documented. A study was conducted to quantify the effect of temperature on growth, development, and feedstock quality of switchgrass cultivars, and to determine differences between upland and lowland switchgrass. Two lowland (“Alamo” and “Kanlow”) and two upland (“Caddo” and “Cave-in-Rock”) cultivars of switchgrass were grown in pots filled with pure, fine sand in growth chambers. Four different temperature treatments of 23˚C/15˚C, 28˚C/20˚C, 33˚C/25˚C, and 38˚C/30˚C with 14/10 hours day/night were imposed at four leaf stage. High temperature significantly decreased the biomass yield across all cultivars. Stem elongation rate (SER) and leaf elongation rate (LER) decreased at the highest temperature treatment but lowland cultivars had significantly higher SER and LER across the temperature treatments. Upland cultivars produced more tillers across the temperature treatment. Both shoot/root and leaf/stem ratios increased under the highest temperature in all cultivars, but upland cultivars partitioned more to the leaf and root at higher temperature. Concentration of cellulose decreased at the highest temperature but temperature had no effect on lignin concentration of leaf and stem biomass. In conclusion, although none of the cultivars studied showed strong tolerance to high temperature, differences were observed for many traits of switchgrass in response to temperature.
1. Introduction
Switchgrass is one of the most promising grasses for bioenergy production in the United States. Switchgrass is a perennial, warm-season grass with C4 photosynthestic pathway for carbon assimilation [1] which is classified as upland and lowland types based on ecological origin. Lowland ecotypes are mostly tetraploid (2n = 4x = 36) while upland ecotypes are mainly octaploid (2n = 8x = 72) or hexaploid (2n = 6x = 54) [2,3]. Although switchgrass is a cross pollinated plant, no natural crossing occurs across the ploidy groups making upland and lowland types reproductively distinct [3]. Lowland ecotypes are larger and taller, yield higher biomass and they are commonly found in wet areas with milder winter temperatures. In contrast, upland ecotypes are shorter, produce less biomass, and they are predominantly found in drier and colder areas [1]. Also, studies have shown intraspecific variations in both upland and lowland cultivars in biomass yield and other traits [3-5].
Temperature affects growth and development, dry matter accumulation and partitioning, expansion growth and phenological development of plants [6]. High temperatures during the crop growing season of switchgrass are a norm and expected to increase in the future as a result of climate change in Oklahoma and other regions of the Southern Great Plains of the United States [7]. Thus, it is likely that productivity of switchgrass in the Southern Great Plains will be affected in the future climate. However, the elevated temperature in future can have differential sensitivity to switchgrass populations as huge genetic variations exist in switchgrass population [8]. Such a huge genetic variability in a species is an asset to design and develop specific types of plants that can tolerate one or multiple abiotic stresses [9]. Studying the switchgrass varietal response to temperature is therefore important to understand the growth responses of switchgrass populations in present and future climates and abiotic stresses tolerant plants.
In light of global change, it is very important to understand the influence of temperature on plant growth and development of bioenergy crops which had not get much attention in the past [6,10]. Although few studies have been conducted to evaluate the influence of temperature on switchgrass [11,12], no information is available to document varietal differences in switchgrass in response to temperature. To fill this gap, we conducted an experiment with objectives to quantify the effect of temperature on growth, development, and feedstock quality of switchgrass cultivars and to determine if there exits ecotype and/or varietal differences between upland and lowland switchgrass in response to growth temperature.
2. Materials and Methods
2.1. Plant Culture and Treatments
This experiment was conducted in 2009 using Conviron indoor growth chambers (Conviron Ltd., Winnipeg, Canada) at the Controlled Environmental Research Laboratory (CERL) at Oklahoma State University (36˚7'N, 97˚4'W), Oklahoma, USA. Four large Conviron growth chambers, floor area of 2.97 m2 were used for the study and each chamber consisted of temperature control system. The chambers provide a full color spectrum of light supplied by a combination of high intensity fluorescent and incandescent bulbs. Plastic pots that were 0.45 m tall and 0.2 m in diameter were used for this study. Pots were filled with gravel at the bottom to ensure proper drainage and the rest of the pot was filled with pure, fine sand. Seeds of four cultivars of switchgrass were sown in pots in each chamber. Six pots of each cultivar were placed in a row and a distance of 30 cm was maintained between the rows. The cultivars included two lowland (Alamo and Kanlow) and two upland (Caddo and Cave-in-Rock) cultivars of switchgrass. Emergence was observed after 4 days in Cave-in-Rock and after 7 days in the rest of the cultivars. After emergence, plants were thinned to 4 plants per pot that were of similar physiological age (based on leaf number). Temperature treatment was imposed in each chamber after the plants reached the 4 leaf stage, at 30 days after sowing. Four day/night temperature of 23˚C/ 15˚C, 28˚C/20˚C, 33˚C/25˚C and 38˚C/30˚C were assigned randomly to four chambers and held constant until final harvest. A photoperiod of 14 hours daylight and 10 hours night was maintained from sowing to final harvest. The PPFD was set to 960 μmol m−2·s−1 when the lamp rack was 50 cm above the canopy. Plants were irrigated with a drip irrigation system and supplied with standard Hoagland’s nutrient solution. Irrigation was provided three times in a day for three minutes at 0800, 1200, and 1600 and controlled with a timing device.
Day/night temperature inside the growth chambers were recorded with TP325—temperature/humidity data loggers (The Dickson Company, Addison, IL). The mean recorded temperature in each unit is presented in Table 1. The measured daily temperature was 0.5˚C - 2.9˚C higher than the assigned temperature. The average daily temperatures are presented replacing assigned temperature regimes hereafter (20.3˚C, 25.4˚C, 30.2˚C, 37.6˚C for 23˚C/15˚C, 28/20, 33˚C/25˚C and 38˚C/30˚C, respectively).
2.2. Growth Measurements
Growth measurements were made from first week of temperature treatment. One plant from each of the three middle pots in the row were selected and tagged as sample plants for growth measurement. The plants were marked and growth measurements were taken until 86 DAS. Plant height, tiller number and node number were recorded at weekly intervals. Leaf elongation was recorded every day and leaf elongation rate was derived from average elongation rate of 6 - 10th leaves. At the final harvest, plant height, tiller number and node number were measured for all 4 plants in each pots (n = 6) and average were used for statistical analysis. Leaf and stem of plants from middle three pots (n = 3) were separated to study partitioning of biomass. Leaf area and weight were measured to calculate the specific leaf area (SLA).
2.3. Biomass Analysis
Dried samples of leaf and stem were ground separately in a Wiley Mill (Thomas-Wiley Mill Co., Philadelphia, PA) to pass a 2 mm screen and then reground to uniformity in an Udy-Cyclone Impact Mill (Udy Corporation, Fort Collins, CO.) with a 1-mm screen. Biomass was analyzed at the Soil, Water and Forage Analytical Laboratory (SWFAL) at Oklahoma State University for neutral detergent fiber (NDF), acid detergent fiber (ADF), and acid detergent lignin (ADL) with an Ankom 200 Fiber Analyser (ANCOM Technology Corp., Fairport, NY) following the Van Soest and Wine method [13]. From these, cellulose was calculated as ADF minus ADL, hemicellulose was calculated as NDF minus ADF, and ADL was considered as lignin.
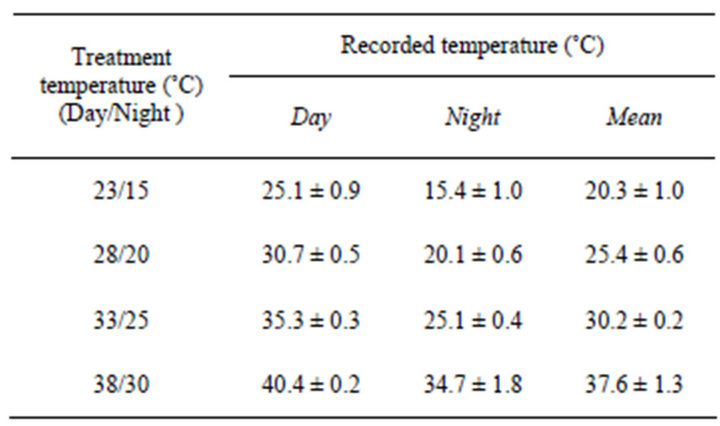
Table 1. Temperatures in the four growth chambers.
2.4. Statistical Analysis
Measurements taken from each pot were averaged before statistical analysis, and statistical analysis were done considering the pots as replication. Therefore, the uncertainty associated variation among pots was presented as standard errors SE of mean (n = 3 or 6). A two-way ANOVA was carried out on the data to determine the effect of temperature (T), cultivar (C) and their interaction (C × T) for various traits using PROC GLM in SAS [14].
3. Results
3.1. Growth Measurements
Stem elongation rate significantly differed among cultivars (P < 0.001) and temperature (P < 0.001) treatments (Figure 1(a)). Stem elongation rate (SER), derived from the linear phase of increase of main tiller height over time, was generally higher in lowland cultivars than upland cultivars across the temperature treatments. However, at the lowest temperature condition (20.3˚C) SER of Caddo was equal to other two lowland cultivars. SER dropped sharply in all cultivars at the highest temperature. Although stem elongation decreased sharply for all cultivars in the highest temperature condition, it remained higher for lowland cultivars than upland cultivars. Tillering rate was significantly different among cultivars (P < 0.05) and temperature (P < 0.001) treatments (Figure 1(b)) but no interaction was observed. Kanlow had the lowest tillering rate across the temperature treatments. Increase in temperature increased the tillering rate of upland cultivars as compared to lowland cultivars.
Node development was also significantly different among cultivars (P < 0.001) and temperature treatments (P < 0.001). The interaction effect of temperature and cultivar was also significant (P < 0.05) (Figure 1(c)). Node development rate decreased sharply at 37.6˚C except for Alamo. Leaf elongation rate was significantly different among cultivar (P < 0.001) and temperature (P < 0.001) treatment but interaction effect was not significant (Figure 1(d)). Lowland types had higher leaf elongation rate across the temperature treatments than upland types. Kanlow had the highest leaf elongation rate and Caddo had the lowest leaf elongation rate. Leaf elongation rate of all cultivars was higher in moderate temperatures but declined sharply at 37.6˚C.
Plant height measured at final harvest was significantly different among temperature (P < 0.001) (Figure 2(a)). Similar to SER, plant height also decreased sharply at 37.6˚C for all cultivars. The interaction effect was also significant (P < 0.001). Tiller number per plant increased at higher temperatures (30.2˚C and 37.6˚C). Total cultivars was greater in all temperature treatments compared to lowland cultivars (Figure 2(b)). Final node number of all cultivars decreased sharply at 37.6˚C (Figure 2(c)). Both the tiller and node addition of Alamo remained more stable than in other cultivars showing wider adapta-
***P < 0.001; **P < 0.01 and *P < 0.05; NS, non-significant (P > 0.05).

Figure 1. The effect of temperature on (a) stem elongation rate, (b) tiller addition, (c) node addition of switchgrass cultivars and (d) leaf elongation rate (LER). Temporal trends in plant height, tiller number and main plant node numbers, between 30 and 86 days after sowing, were used to derive the rates. Standard errors of means are shown (n = 3). Significance level for cultivar (C), temperature (T) and (C × T) are shown.
***P < 0.001; **P < 0.01 and *P < 0.05; NS, non-significant (P > 0.05).
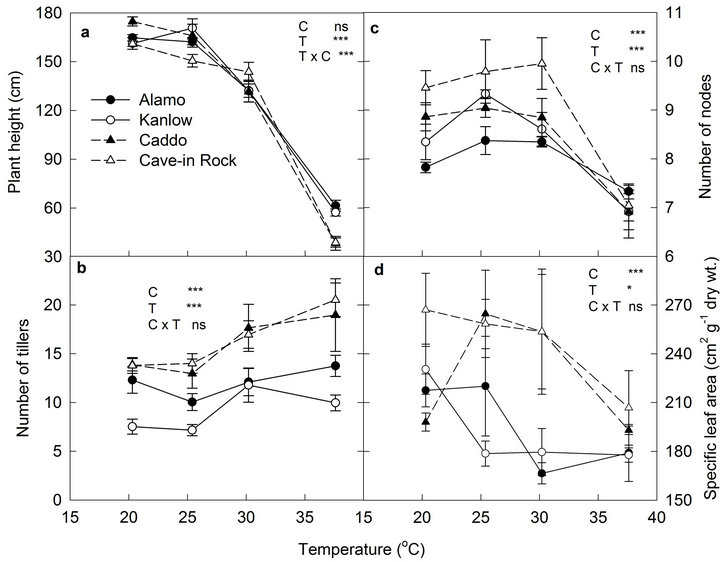
Figure 2. The effect of temperature on final (a) plant height, (b) tiller number, (c) node number of switchgrass cultivars, and (d) specific leaf area. Vertical bars denote standard errors of mean (n = 6). Significance level for cultivar (C), temperature (T) and G × T are shown.
tion of Alamo across the temperature range.
Specific leaf area was significantly different among cultivars (P < 0.001) and temperature treatments (P < 0.05) (Figure 2(d)). The interaction effect was not significant (P > 0.05). Specific leaf area of upland cultivars was generally higher at all temperature treatments compared to lowland types. Specific leaf area decreased sharply at 37.6˚C in upland cultivars. In lowland cultivars, there was no significant difference in specific leaf area when plants were grown at 30.2˚C and 37.6˚C.
3.2. Biomass Yield and Partitioning
Temperature had significant (P < 0.001) effect on shoot biomass yield of switchgrass cultivars (Figure 3(a)). Similarly, the interaction effect was also significant (P < 0.05). Upland cultivars produced maximum shoot biomass at 20.3˚C and lowland cultivar produced maximum biomass at 30.2˚C.
Biomass yield of all cultivars declined sharply at 37.6˚C. Significant interaction was observed in shoot biomass yield of switchgrass cultivars in response to temperature. Biomass yield of the two upland cultivars was the highest at 20.3˚C but it decreased with increase in temperature. Biomass yield of two lowland cultivars was increased up to 30.2˚C and decreased sharply at 37.6˚C.
This shows that lowland cultivars are adapted to a wider range of climates compared to upland cultivars. Within lowland ecotypes, Alamo produced more shoot biomass compared to Kanlow.
Partitioning of biomass between plant parts was measured as shoot/root ratio and leaf/stem ratio. Leaf/stem ratio varied significantly among cultivars (P < 0.05) and temperature treatments (P < 0.001) (Figure 3(b)). Leaf/ stem ratio of upland cultivars increased more sharply at 37.6˚C compared to lowland cultivars. Root/shoot ratio varied significantly among cultivars (P < 0.001) and between temperature treatments (P < 0.001) but interaction effect was not significant (Figure 3(c)). Root/shoot ratio of lowland cultivars increased up to 30.2˚C and decreased slightly at 37.6˚C. Among the upland types, root/shoot ratio of Caddo increased sharply at the highest temperature 37.6˚C. Root/shoot ratio of lowland cultivars was generally higher than upland cultivars.
3.3. Cell Wall Components of Shoot Biomass
Cellulose concentration of leaves was significantly different among cultivars (P < 0.001) (Figure 4). Caddo had the highest (36%) and Cave-in-Rock had the lowest (32%) cellulose concentration in their leaves. Similarly, temperature had a significant effect on cellulose concentration of leaves (P < 0.001). Cellulose concentration of leaves increased up to 30.2˚C and declined by 10% at highest temperature. The interaction effect of temperature and cultivar was not significant (P > 0.05). Unlike in the leaf, cellulose concentration of the stem did not differ among cultivars but the temperature effect was significant (P < 0.001). Similar to the leaf, the cellulose concentration of the stem decreased at the highest temperature. The interaction effect of cultivar and temperature on cellulose concentration of the stem was not significant (P > 0.05).
Hemicellulose concentration of leaves was significantly different among cultivars (P < 0.05) and temperature treatments (P < 0.001) (Figure 5). It increased from 20.3˚C to 25.4˚C, and then decreased again at higher temperatures, except in cave-in-Rock in which hemicellulose concentration increased at the highest temperature. The interaction effect was not significant (P < 0.05). Hemicellulose concentration of stems did not differ significantly (P > 0.05) among cultivars but temperature and the interaction effect were significant (P < 0.05). Contrary to the leaves, hemicelluloses concentration of stems tended to increase when plants were grown at higher temperature.
Lignin concentration of leaves was significantly different (P < 0.01) among cultivars (Figure 6). Leaves
***P < 0.001; **P < 0.01 and *P < 0.05; NS, non-significant (P > 0.05).
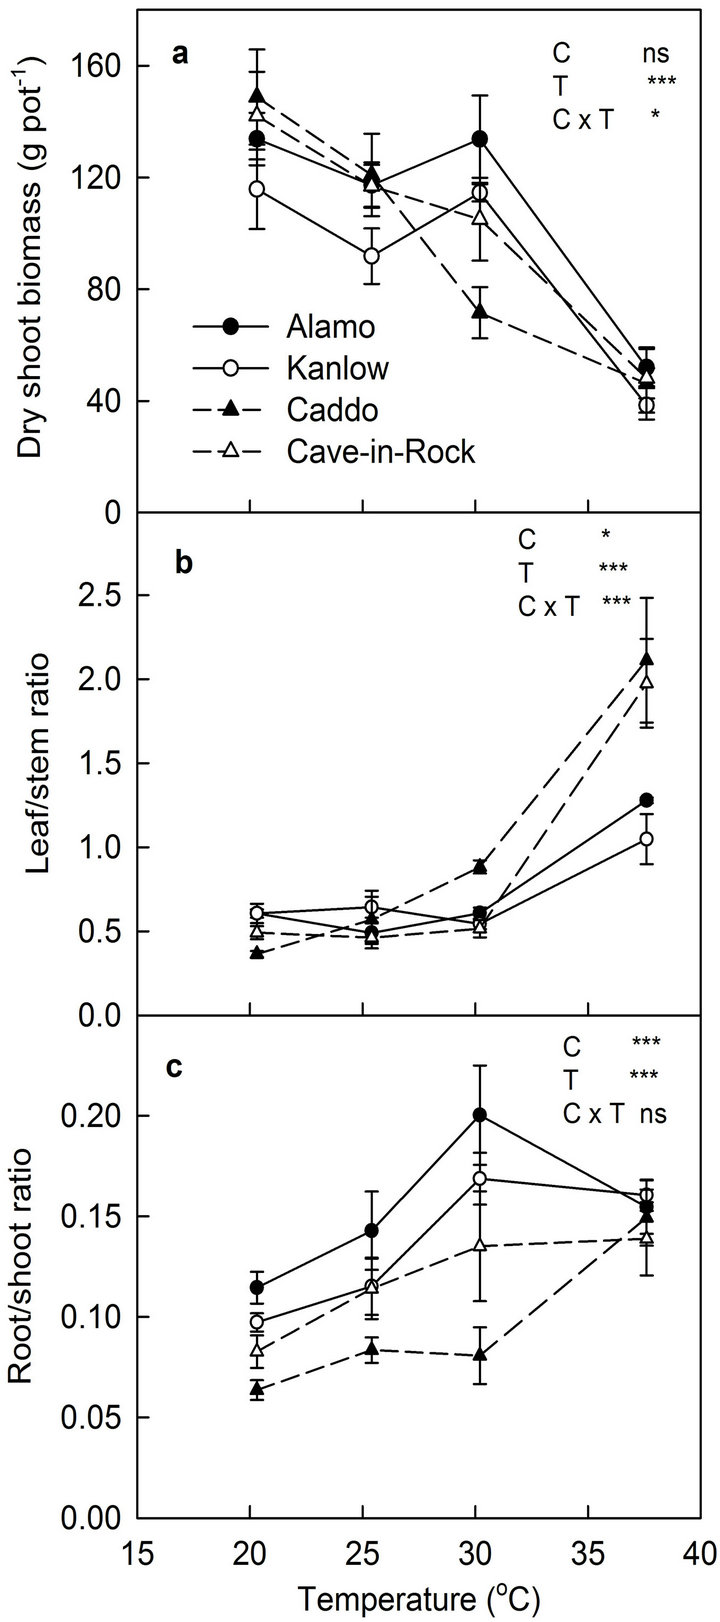
Figure 3. The effect of temperature on final (a) Shoot biomass yield, (b) leaf/stem ratio, and (c) root/shoot ratio of switchgrass cultivars. Vertical bars denote standard errors of mean (n = 6). Significance level for cultivar (C), temperature (T) and C × T are shown.
of Caddo had highest concentration of lignin (4.39%) while Alamo had the lowest of lignin concentration (3.64%). Temperature and the interaction effects were not significant (P > 0.05). Lignin concentration of stems was not significantly different (P > 0.05) among cultivars, temperature treatment and interaction effect.
4. Discussion
The current study, under well irrigated and fertilized conditions using controlled environment growth chambers, proves differences in growth, development, yield and quality of switchgrass cultivars. Varietal difference was noted for stem elongation, tiller addition, node development, biomass yield and partitioning. Although direct comparisons of the trait expression between a controlled environmental study and field condition are difficult, growth and development responses observed in this study show that there is considerable genetic variation in switchgrass in response to temperature.
The leaf/stem ratio of all cultivars increased at 37.6˚C for all cultivars but the increase in the ratio was higher in upland cultivars compared to lowland cultivars. As the leaf/stem ratio is known to increase at both lower and higher temperature with a minimum at optimum temperature [15], both upland cultivars were more susceptible to high temperature than lowland cultivars. Among upland cultivars, Cave-in-Rock had more stable leaf/stem ratio in the temperature range of 20.3˚C - 30.2˚C which shows wider adaptation of Cave-in-Rock compared to Caddo. Moreover, Caddo had a sharp increase in root/ shoot ratio at 37.6˚C indicating the cultivar was more affected by high temperature than the other cultivars as root/shoot ratio is known to increase at both lower and higher temperature with a minimum at optimum temperature [15]. In the lowland types, a decrease in root/ shoot ratio was observed at 37.6˚C which indicate root development was severely impaired in lowland types at high temperature.
A decrease in cellulose concentration of both stem and leaf biomass in higher temperature was observed, which may be associated with higher loss of glucose molecules in the respiration process at higher temperature. Although lignification of plant biomass is under genetic control, environmental factors also play a role in lignification [16]. However, the present study found no effect of temperature on lignin concentration of both stem and leaf biomass. Similar result was found by Ford et al. [17] who did not find effect of temperature during growth of tropical grasses in lignin concentration. As the higher concentration of cellulose in the biomass is an important trait of quality feedstock [18], our study suggests that switchgrass grown at higher temperature than optimum may decrease the quality feedstock for ethanol production.
***P < 0.001; **P < 0.01; *P < 0.05; NS, non-significant (P > 0.05).
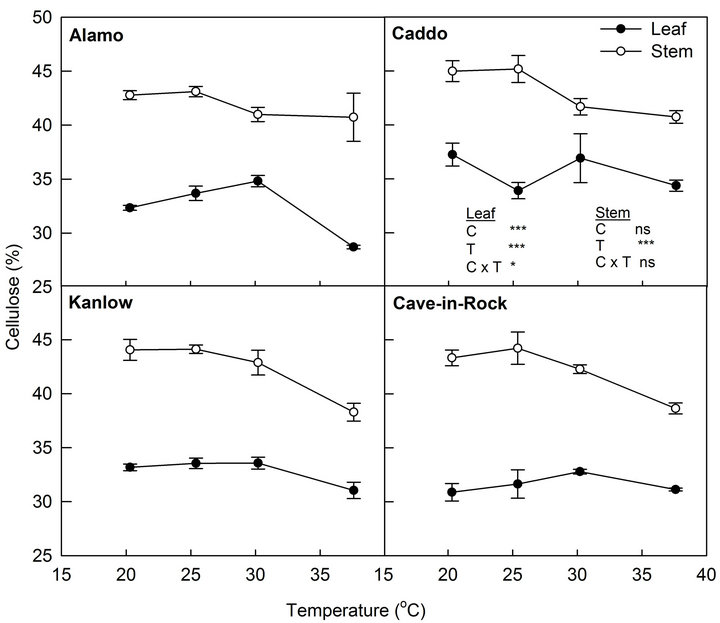
Figure 4. Effect of temperature on cellulose concentration of leaf and stem of switchgrass cultivars. Vertical bars denote standard errors of mean (n = 3). Significance levels for cultivar (C), temperature (T) and (C × T) are shown.
***P < 0.001; **P < 0.01; *P < 0.05; NS, non-significant (P > 0.05).

Figure 5. Effect of temperature on hemicellulose concentration of leaf and stem of switchgrass cultivars. Vertical bars denote standard errors of mean (n = 3). Significance levels for cultivar (C), temperature (T) and (C × T) are shown.
Our findings on responses to temperature are specific to four cultivars of switchgrass. These are high yielding cultivars of upland and lowland types and they are currently grown for forage purposes and Alamo and Cavein-Rock are grown extensively as biofuel feedstock. Our study suggests that there is variation among these cultivars for a variety of traits. However, none of the cultivars we studied showed very strong tolerance to high temperature stress as the total biomass yield of all cultivars declined sharply at the highest temperature. Therefore,
***P < 0.001; **P < 0.01; *P < 0.05; NS, non-significant (P > 0.05).

Figure 6. Effect of temperature on lignin concentration of leaves and stems of switchgrass cultivars. Vertical bars denote standard errors of mean (n = 3). Significance levels for cultivar (C), temperature (T) and (C × T) are shown.
further investigation of the temperature response of a larger number of switchgrass cultivars and accessions to screen for tolerant cultivars is necessary.
In conclusion, our study reveals some beneficial traits of switchgrass cultivars for improved biomass production in present and future climates. Although none of the cultivars studied showed strong tolerance to high temperature, differences was observed for many traits of switchgrass in response to temperature. Some of these traits include stem elongation rate, rate of tiller development, and root/shoot and leaf/stem ratios which can be used as traits in determining the yield and stress tolerance of switchgrass.
5. Acknowledgements
This research was funded in part by the Oklahoma Bioenergy Center. The manuscript is a contribution of Oklahoma Agricultural Experiment Station at Oklahoma State University, Stillwater, OK.
REFERENCES
- M. A. Sanderson and D. D. Wolf, “Morphological Development of Switchgrass in Diverse Environments,” Agronomy Journal, Vol. 87, No. 5, 1995, pp. 908-915. doi:10.2134/agronj1995.00021962008700050022x
- L. E. Gunter, G. A. Tuskan and S. D. Wullschleger, “Diversity among Populations of Switchgrass Based on RAPD Markers,” Crop Science, Vol. 36, No. 4, 1996, pp. 1017-1022. doi:10.2135/cropsci1996.0011183X003600040034x
- S. D. Wullschleger, M. A. Sanderson, S. B. McLaughlin, D. P. Biradar and A. L. Rayburn, “Photosynthesis Rates and Ploidy Levels among Populations of Switchgrass,” Crop Science, Vol. 36, No. 2, 1996, pp. 306-312. doi:10.2135/cropsci1996.0011183X003600020016x
- C. L. Porter Jr., “An Analysis of Variation between Upland and Lowland Switchgrass, Panicum virgatum L., in Central Oklahoma,” Ecology, Vol. 47, No. 6, 1996, pp. 980-992. doi:10.2307/1935646
- I. C. Madakadze, K. A. Stewart, R. M. Madakadze and D. L. Smith, “BASE temperature for Seedling Growth and Their Correlation with Chilling Sensitivity for WarmSeason Grasses,” Crop Science, Vol. 43, No. 3, 2003, pp. 874-878. doi:10.2135/cropsci2003.0874
- V. G. Kakani and K. R. Reddy, “Temperature Response of C4 Species Big Bluestem (Andropogon gerardii) Is Modified by Growing Carbon Dioxide Concentration,” Environmental and Experimental Botany, Vol. 61, 2007, pp. 281-290. doi:10.1016/j.envexpbot.2007.06.002
- J. H. Christensen, B. Hewitson, A. Busuioc, A. Chen, X. Gao, I. Held, R. Jones, R. K. Kolli, W.-T. Kwon, R. Laprise, V. Magaa Rueda, L. Mearns, C. G. Menéndez, J. Räisänen, A. Rinke, A. Sarr and P. Whetton, “Regional Climate Projections,” In: S. Solomon, D. Qin, M. Manning, Z. Chen, M. Marquis, K. B. Averyt, M. Tignor and H. L. Miller, Eds., Climate Change 2007: The Physical Science Basis. Contribution of Working Group I to the Fourth Assessment Report of the Intergovernmental Panel on Climate Change, Cambridge University Press, Cambridge, and New York, 2007.
- M. K. Das, R. G. Fuentes and C. M. Taliaferro, “Genetic Variability and Trait Relationships in Switchgrass,” Crop Science, Vol. 44, No. 2, 2004, pp. 443-448.
- A. F. Foschiani, F. Miceli and M. Vischi, “Assessing Diversity in Common Bean (Phaseolus vulgaris L.) Accessions at Phenotype and Molecular Level: A Preliminary Approach,” Genetic Resources and Crop Evolution, Vol. 56, No. 4, 2009, pp. 445-453. doi:10.1007/s10722-008-9377-z
- V. G. Kakani, G. K. Surabhi and K. R. Reddy, “Photosynthesis and Fluorescence Responses of C4 Plant Andropogon gerardii Acclimated to Temperature and Carbon Dioxide,” Photosynthetica, Vol. 46, No. 3, 2008, pp. 420-430. doi:10.1007/s11099-008-0074-0
- J. A. Balasko and D. Smith, “Influence of Temperature and Nitrogen Fertilization on the Growth and Composition of Switchgrass (Panicum virgatum L.) and Timothy (Phleum pratense L.) at Anthesis,” Agronomy Journal, Vol. 63, No. 6, 1971, pp. 853-857. doi:10.2134/agronj1971.00021962006300060009x
- J. C. Hartman and J. B. Nippert, “Physiological and Growth Responses of Switchgrass (Panicum virgatum L.) in Native Stands under Passive Air Temperature Manipulation,” GCB Bioenergy, 2012, in press. doi:10.1111/j.1757-1707.2012.01204.x
- P. J. Van Soest and R. H. Wine, “Use of Detergents in the Analysis of Fibrous Feeds. IV. Determination of Plant Cell Wall Constituents,” Journal of Associated Officers of Agricultural Chemistry, Vol. 50, No. 1, 1967, pp. 50-55.
- SAS Institute, “SAS/STAT User’s Guide, Version 9.1,” SAS Institute, Cary, 2009.
- H. Lambers, R. VandenBoogaard, E. J. Veneklaas and R. Villar, “Effects of Global Environmental Change on Carbon Partitioning in Vegetative Plants of Triticum aestivum and Closely Related Aegilops Species,” Global Change Biology, Vol. 1, No. 6, 1995, pp. 397-406. doi:10.1111/j.1365-2486.1995.tb00038.x
- K. J. Moore and H. J. G. Jung, “Lignin and Fiber Digestion,” Journal of Range Management, Vol. 54, No. 4, 2001, pp. 420-430. doi:10.2307/4003113
- C. W. Ford, I. M. Morrison and J. R. Wilson, “Temperature Effects on Lignin, Hemicellulose and Cellulose in Tropical and Temperate Grasses,” Australian Journal of Agricultural Research, Vol. 30, No. 4, 1979, pp. 621-633. doi:10.1071/AR9790621
- W. G. Hohenstein and L. L. Wright, “Biomass Energy Production in the United States: An Overview,” Biomass and Bioenergy, Vol. 6, No. 3, 1994, 115-124. doi:10.1016/0961-9534(94)90073-6
NOTES
*Corresponding author.