American Journal of Plant Sciences
Vol.4 No.1(2013), Article ID:27577,9 pages DOI:10.4236/ajps.2013.41004
Effect of Tillage and Nitrogen on Wheat Production, Economics, and Soil Fertility in Rice-Wheat Cropping System
![]()
1Department of Agronomy, Faculty of Agriculture, Gomal University, Dera Ismail Khan, Pakistan; 2Department of Soil & Environmental Sciences, Faculty of Agriculture, Gomal University, Dera Ismail Khan, Pakistan; 3University Wensam College, Gomal University, Dera Ismail Khan, Pakistan; 4Department of Horticulture, Faculty of Agriculture, Gomal University, Dera Ismail Khan, Pakistan.
Email: *marwat7862003@yahoo.com
Received August 20th, 2012; revised September 20th, 2012; accepted September 27th, 2012
Keywords: Wheat; Tillage; Nitrogen; Income; SOM; TSN
ABSTRACT
Conservation tillage and nitrogen may improve soil fertility, yield and income on sustainable basis. The aim of this study was to evaluate the impact of three tillage systems viz. zero (ZT), reduced (RT), and conventional tillage (CT) and five N rates (0, 80, 120, 160, and 200 kg·N·ha−1) on yield and yield components, soil organic matter (SOM), total soil N (TSN), and income of wheat (Triticum aestivum L.) grown after rice (Oryza sativa L.). Nitrogen rates significantly affected yield and yield attributing characters with highest values recorded at 200 kg·N·ha−1. Mean maximum grain yield (6390 - 6845 kg·ha−1), net benefit (1359 - 1460 US$ ha−1), and benefit cost ratio (5.6 - 5.7) could be achieved at 160 to 200 kg·N·ha−1. The tillage systems produced similar yield and yield components except spikes m−2. The SOM and TSN were highest in ZT compared to other tillage systems. Though tillage × N interactions were not significant for most of the parameters under study, the overall effect of ZT with 200 kg·N·ha−1 appeared to be most favorable compared to RT and CT. Zero tillage resulted in highest number of spikes m−2 (304.4), SOM (9.6 g·kg−1) and TSN (0.5 g·kg−1) with 200 kg·N·ha−1. The results suggest that ZT with 200 kg·N·ha−1 was optimum and sustainable strategy to achieve higher yield and income and also to improve SOM and TSN on silty clay soil.
1. Introduction
Rice (Oryza sativa L.) followed by wheat (Triticum aestivum L.) is a major cropping system in South Asia, occupying 14 Mha, while in Pakistan it covers 2.2 Mha [1]. A current trend in rice-wheat cropping system (RWCS) is the excessive use of tillage implements to obtain a good tilth. Management practices such as tillage, fertilizers, and pesticides result in degradation of natural resources and low grain yield [2]. Research results showed that CT practices declined soil structure and stability over years due to depletion of SOM, which is already low in the soils of northwestern Pakistan affecting crop yield [3] (Fan et al., 2005). The present wheat yield is much lower than its genetic potential. Wheat planting in Pakistan is generally delayed when sown after harvest of fine rice. Wheat yield reduces by 1% - 1.5% ha−1·day−1, if planted after 15th November [4]. Conventional agriculture is serious threat to sustainability of RWCS and hazardous to environment [5].
Nitrogen is the most limiting nutrient in crop production and its efficient use to increase food production is more than any other input; however, much use of N may cause environmental concerns such as nitrate leaching, eutrophication, and greenhouse gases emissions and reduce crop yield [6]. Therefore, proper use of N is critical to optimize crop yield and minimize environmental damage. It has been estimated that 40% - 60% of N-applied is taken up by wheat, which decreases as the N-input increases, resulting in higher residual soil N that can be readily leached [7].
Zero tillage is an alternative to address the problems associated with conventional agriculture. Unlike CT, ZT may facilitate wheat planting at optimum time and reduce cost of production. Zero tillage improve waterand nutrient-use efficiencies, and increase crop productivity and carbon sequestration, ameliorate soil properties and mitigate green house gases emission [8]. Under ZT, mineralization is more evenly distributed over the growing season, while under CT there is a flush of mineralization following cultivation and hence soil N is more prone to leaching losses rather than its availability to crop. In ZT surface residues reduce soil bulk density and increase infiltration rate [9]. Crop residues are a source of organic C for soil microorganisms and also contribute to plant nutrients. Cereal residues, however, contribute little immediate plant-available N to the soil because of their wide C:N ratios. Sustaining wheat productivity in RWCS without jeopardizing the quality of soil and environment depends on appropriate tillage in combination with optimum N rate. Looking to the scenario of unsustainable CT and its impact on SOM, TSN, and productivity decline, there is a need to modify current tillage practices while growing wheat after rice. Current N recommendations developed for CT may be inadequate for optimum production of wheat under ZT and need redressing due to potential effects of surface residue on N transformations and crop development. No studies have been conducted in arid climate of Pakistan to determine feasibility of tillage in combination with N rates, and their effects on wheat yield with large amounts of previous crop residues. The present experiment was designed to evaluate the effect of tillage, N rates and their interaction on wheat yield and yield components, SOM, TSN, and income of wheat in RWCS.
2. Materials and Methods
2.1. Site, Treatments and Crop Management
Field experiments were conducted from 2007-2009 at Gomal University, Dera Ismail Khan, Pakistan (31˚49'N, 70˚55'E, 165 m elevation). The study area is characterized by low rainfall (<200 mm·y−1), hot and dry summer. The experiment was laid out in a randomized complete block design with split plot arrangement replicated four times. Three tillage systems viz. ZT, RT, and CT were assigned to main plots, while five N (0, 80, 120, 160 and 200 kg·N·ha−1) were applied to subplots. Each subplot was 50 m2 (10 m × 5 m) in size. The five subplots treated with different concentrations of N were isolated from each other by making bunds around them so that N could not be transported between these subplots. After rice harvest, the land was prepared for wheat. Zero tillage sowing was accomplished with ZT drill in the standing stubbles of preceding rice crop. Reduced tillage included rotavator followed by seed drilling machine, while CT comprised of disk plow (once), cultivator (twice) and rotavator (twice). Wheat (cv. Nasir 2000) was planted in first week of November in 30-cm wide rows at 100 kg·ha−1 seed rate and harvested in third week of May each year. N was applied at 120 kg·ha−1 in the form of urea. Half of the N was applied at sowing, while remaining half was applied at tillering stage. Phosphorus was applied at 60 kg·ha−1 at sowing as triple super phosphate, banded with drilling in wheat plots. Weeds were controlled with Affinity 50 WDG (carfentrazone ethyl ester + isoproturon) at two kg·ha−1 one month after sowing.
2.2. Soil Analysis
Before the experiment was laid out, the soil was deeply dug to make sure that the soil constituents were the same. Since the soil was very hard and calcareous, fifteen soil cores were randomly sampled from the 0 - 20 cm soil depth in the experimental plots and bulked for determineing physico-chemical characteristics. At the end of two years of experimentation, soil samples were taken again from each subplot (8 random samples) for total SOM contents and TSN. Organic matter was determined through wet oxidation based upon the Walkley and Black method [10]. Total N in soil was determined by the Kjeldhal method. The extractable P and K in soil samples were determined by the AB-DTPA extractable method [11]. The soil was silty clay (sand 150 g·kg−1, silt 450 g·kg−1 and clay 400 g·kg−1), calcareous, alkaline in reaction (pH 7.8), low in organic matter content (6.5 g·kg−1), total N (0.3 g·kg−1), AB-DTPA extractable P (7.8 mg·P·kg−1 soil) and high in available K (192 mg·K·kg−1 soil).
2.3. Measurement of Crop Parameters
Data were recorded on spikes m−2, grains spike−1, 1000- grain weight, biological yield, grain yield, net benefit (NB), and benefit cost ratio (BCR). Number of spikes in one meter long row at four different places were counted in each subplot and converted into number of spikes m−2. Number of grains spike−1 was recorded by counting the number of grains of 10 randomly selected spikes from each subplot and average number of grains spike−1 was calculated. A random sample of 1000 grains from each treatment was collected and weighed with digital balance for 1000-grain weight. For biological yield, each subplot was harvested, sun dried, and weighed into kg·ha−1. For grain yield, the biomass of each subplot was sun dried, threshed, cleaned, and grains were weighed into kg·ha−1. Net benefit was determined by subtracting total cost of production from gross income. Benefit cost ratio was calculated from gross income divided by total cost of production.
2.4. Statistical Analysis
Data for each parameter over two year period was subjected to analysis of variance using a randomized complete block design with split plot arrangement according to MSTATC [12]. Treatment means were compared using least significant difference (LSD) test at P ≤ 0.05.
3. Results and Discussion
3.1. Spikes m−2
Spikes m−2 was significantly affected by N rates both annually and for the two year period (Table 1). However, tillage (T), and T × N interactions were significant only in 2008-09 (Y2) and for the two year period. More spikes m−2 (255.1) were recorded in 2007-08 (Y1) than in Y2 (243.5). The lower spikes m−2 in Y2 may be due to lower tillers m−2, which resulted from poor plant population. Indeed tillers m−2 were reduced by early Field cricket attack in Y2, although it was controlled by dusting insecticide (Sevin® 80 WSP Carbaryl) but the average plant population remained a bit thinner compared to Y1. Zero tillage produced highest number of spikes m−2 (247.1 and 255.4) compared to RT (243.8 and 249.1) and CT (239.7 and 243.5) during Y2 and over years, respectively. The higher spikes in ZT compared to CT were perhaps due to increased tiller production and increased tiller survival. The results revealed that spikes m−2 increased with increase in N rate and maximum spikes m−2 were recorded at 200 kg·N·ha−1 in Y1 (300.4), Y2 (289.3), and over years (294.8), while minimum spikes m−2 ranging from 173.1 - 180.5 were recorded in control. The formation of spikes m−2 is positively correlated with N supply, thus increase in spikes m−2 may be due to increased soil fertility and availability of resources to wheat crop at higher N rate compared with control [13]. In T × N interactions, ZT at 200 kg·N·ha−1 produced highest spikes m−2 during Y2 (297.6) and over years (304.4). The results suggest that ZT is more responsive to N fertilization compared to RT and CT probably due to limited roots feeding area and hard compact surface leaving fewer chances of N losses via leaching and denitrification, which may be more in CT due to loose soil to a sufficient depth [14].
3.2. Grains Spike−1 and 1000-Grain Weight
Nitrogen significantly increased grains spike−1. In contrast, nitrogen did not impact the effects of tillage. The results revealed that lowest grains spike−1 (48.2) was recorded in control (Data not shown). Grains spike−1 in- creased with each increment of N upto 200 kg·N·ha−1. Grains spike−1 were highest at 200 kg·N·ha−1 in Y1 (61.4), Y2 (66.3), and over years (63.9). More grains spike−1 at higher N may be due to more availability of N [15]. Nitrogen had also significant effect on 1000-grain weight (Data not shown). Reduced grain weight can result from a large fraction of higher order tillers, which were relatively similar in all the three tillage systems. There was consistent increase in 1000-grain weight with increase in N rate both annually as well as for the 2-year period. The mean maximum value (45.3 g) was recorded with 200 kg·N·ha-1, while lowest value (37.1 g) was recorded in control, indicating that severe nutrient stress had depressed 1000-grain weight [16].
Table 1. Spikes of wheat as affected by tillage and N levels during two growing seasons.

Note: Means followed by same letter or no letter do not differ significantly at 5% level of probability.
3.3. Biological Yield
Nitrogen significantly affected biological yield during both the years (Table 2). The results revealed that biological yield increased linearly with increase in N rate and maximum biological yield recorded at 200 kg·N·ha−1 was 21,084, 20,470, and 20,777 kg·ha−1 during Y1, Y2, and for the 2-year period, respectively. Higher yield with higher N rate may be attributed to higher radiation interception due to increase in leaf chlorophyll content, more and broader leaves, and higher leaf area index, which ultimately increased dry matter production [3]. The results further indicate that tillage and T × N interaction did not influence biological yield significantly. Zero tillage produced similar biological yield to RT and CT at each level of N during both the years as well as mean over years. The results further indicated that biological yield was lower with little or no N in ZT compared to RT and CT though the difference was not significant, probably due to N deficiency in ZT and more N immobilization [17]. Although T × N interactions were not significant, but the favorable response of biological yield to ZT at highest N rate (200 kg·N·ha−1) compared to other tillage systems, the response being consistent both annually as well as over years, may not be overlooked. These results suggest that ZT may produce higher biological yield compared to RT and CT if N is not a limiting factor.
3.4. Grain Yield
Grain yield was significantly affected by N, while T and T × N interactions were not significant (Table 3). Grain yield increased linearly with increase in N rate and maximum grain yield could be achieved at 160 to 200 kg·N·ha−1 during Y1 (6453 - 6912 kg·ha−1), Y2 (6326 - 6777 kg·ha−1), and mean over years (6390 - 6845 kg·ha−1), while minimum grain yield (2042 - 2083 kg·ha−1) was recorded from control. The increase in grain yield at higher N rate is mainly due to increased radiation interception driven by a rise in growth rate, leaf area and leaf area index, which ultimately increased grain yield [18]. Moreover, the highest grain yield is the result of increased spikes m−2, grains spike−1 and 1000-grain weight. The results further revealed that tillage systems produced statistically similar grain yield which is quite encouraging regarding ZT because of lower inputs cost. All the three tillage systems performed better at higher N rates compared to lower or no N. However, the most favorable effect of ZT at 200 kg·N·ha−1 on grain yield both annually as well as over years compared to RT and CT would be of interest though the difference was not significant. The results indicate that ZT without N fertilizer would have adverse effect on wheat grain yield compared to RT and CT probably due to lower N availability at the commencement of crop growth [19]. However, ZT
Table 2. Biological yield as affected by tillage and N levels during two growing seasons.
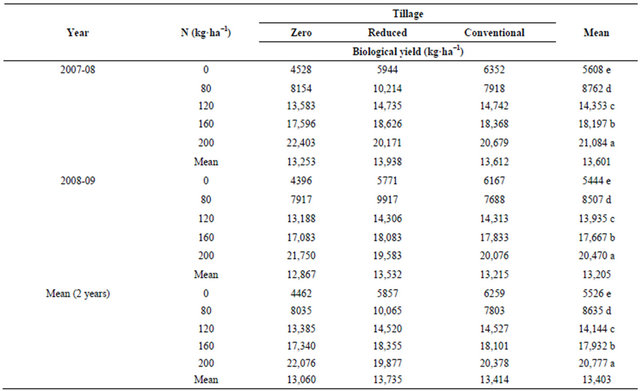
Note: Means followed by same letter or no letter do not differ significantly at 5% level of probability.
Table 3. Grain yield as affected by tillage and nitrogen levels during two growing seasons.
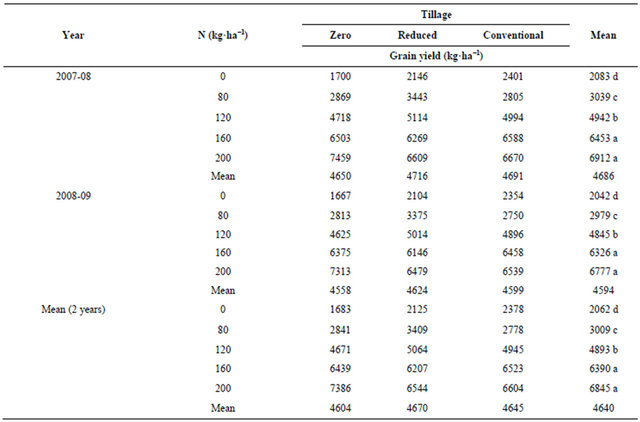
Note: Means followed by same letter or no letter do not differ significantly at 5% level of probability.
would produce similar or even higher grain yield if provided with optimum N rate compared to RT and CT. In case of higher N application (≥200 kg·N·ha−1) there will be more chances of N losses via leaching and denitrification from CT compared to ZT [14], which may lead to significant differences in grain yield of the tillage systems. The results would further indicate that ZT would have higher N requirement compared to RT and CT to achieve higher grain yield due to lower mineralization and limited roots feeding area [20]. Additionally, the wide C:N ratio of the residues of rice can have a negative effect on N supply and hence higher N would be needed to optimize yield under ZT compared to RT and CT system. The results would suggest that ZT at 200 kg·N·ha−1 may be more productive, economical, and safe environmentally on sustainable basis compared to the other tillage systems. In contrast, CT at higher N rate may have environmental consequences besides fatigues in soil fertility and productivity and unnecessary economic costs if continued for longer term.
3.5. Net Benefit
Net benefit was significantly affected by nitrogen (Table 4). It increased with increase in N rates and maximum NB was obtained from 160 - 200 kg·N·ha−1 in the range of 1273 - 1368 US$ ha−1, 1445-1551 US$ ha−1, and 1359 - 1460 US$ ha−1 during Y1, Y2, and for the 2-year period, respectively. Lowest NB ranging from 283 - 333 US$ ha−1 was obtained from control both annually as well as over years. It is evident from the results that N is positively correlated with NB and hence there was linear increase in NB with rising N rate. The possible reason for significant variation in NB might be variation in yield due to different N rates, which means that increase in N up to optimum rate increased NB compared to control. Overall effect of tillage and T × N interaction was not significant. However, favorable effect of T × N interacttion revealed that NB obtained from ZT with 200 kg·N·ha−1 was quite hopeful when compared with RT and CT system. This indicates that ZT is more economical at higher N rate than RT/CT at similar level of N. The optimum NB obtained from ZT with 200 kg·N·ha−1 is ascribed to cutting costs of cultivation, enhanced N and water use efficiency, significant reduction in weed population, and an identical grain yield compared to RT and CT system. The economic comparison of ZT at optimum N with CT was accounted for gross margin only, although ZT have some other potential benefits, which
Table 4. Net benefit as affected by tillage and N levels during two growing seasons.
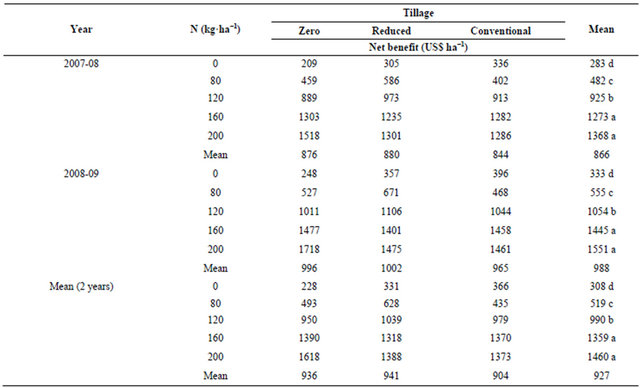
Note: Means followed by same letter or no letter do not differ significantly at 5% level of probability.
may have significant economic and environmental impacts like C sequestration, fuel saving, and reduced risk of soil erosion, surface and ground water pollution, improvement in soil properties and thus ZT may become several folds superior to CT [21].
3.6. Benefit Cost Ratio
There was no significant effect of tillage and T × N interaction on BCR. The most consistent effect was that of N fertilizer, which increased BCR significantly each year as well as over years (Table 5). The BCR increased with increase in N rate and highest BCR was achieved at 160 to 200 kg·N·ha−1 during Y1 (5.5 - 5.6), Y2 (5.7 - 5.8), and for the 2-year period (5.6 - 5.7) compared to control having lowest BCR in the range of 2.3 - 2.4. The highest BCR from 160 and 200 kg N plots could be due to more nutrients uptake by crop at these two levels resulting in higher yield as against control. Moreover, N significantly increased BCR as a result of higher produce obtained compared to control. Although tillage and T × N interacttion did not influence BCR significantly, however, ZT with 200 kg·N·ha−1 had a little margin over RT and CT, which indicates that ZT may be more cost effective at higher N rate compared to RT and CT system. The BCR value obtained from ZT at 200 kg·N·ha−1 during both the years as well as over years was quite satisfactory when compared with RT and CT system. Because the latter two systems (RT and CT) despite higher cost of cultivation could not produce higher yield than ZT, as a result BCR value remained statistically at par with ZT. The reason for favorable BCR in ZT at 200 kg·N·ha−1 compared to RT and CT is ascribed to lower cost of cultivation, and better utilization of resources. The unfavorable out put/input ratio under CT might be due to its higher N losses through leaching, denitrification and its more favorable environment for weeds growth particularly Phalaris minor and Rumex dentatus which were dominant in CT [22,23].
3.7. Soil Organic Matter
Mean values for tillage revealed that ZT plots stored highest SOM content (7.48 g·kg−1 soil) compared to RT (6.90 g·kg−1 soil) and CT (6.86 g·kg−1 soil) after 2 years of experimentation (Table 6). Soil organic matter increased with increase in N rate and highest value (8.37 g·kg−1 soil) was recorded at 200 kg·N·ha−1. The T × N interaction revealed that all the three tillage systems increased SOM with each increment of N; however, highest SOM (9.60 g·kg−1 soil) was recorded from ZT at 200 kg·N·ha−1. Higher SOM storage under ZT may be due to reduced decomposition of SOM because of a less aerobic environment and better physical protection of SOM
Table 5. Benefit cost ratio as affected by tillage and N levels during two growing seasons.

Note: Means followed by same letter or no letter do not differ significantly at 5% level of probability.
Table 6. Soil organic matter accumulation in 0 - 20 cm depth after 2 years of trial as affected by tillage and N.

Note: Means followed by same letter or no letter do not differ significantly at 5% level of probability.
within aggregates. Moreover, CT increases the rate of SOM decomposition and C and N mineralization [24], which may increase wheat yield in short term but in long term continuous CT degrades SOM and reduces soil fertility and structural stability. In contrast, ZT system with optimum N fertilization provides more SOM [25], a condition necessary for long-term sustainability, which should be a major consideration in future tillage research. Therefore, the need to manage SOM and improve soil structure is a main concern in the soil.
Table 7. Total soil nitrogen in 0 - 20 cm depth at the end of 2 years of experimentation as affected by tillage and N.
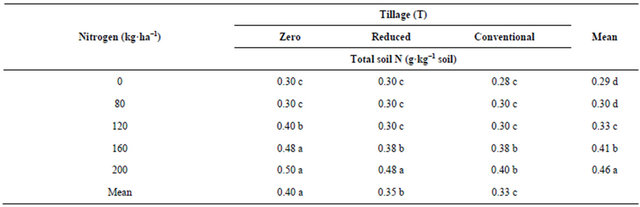
Note: Means followed by same letter or no letter do not differ significantly at 5% level of probability.
3.8. Total Soil N Content
Total soil N showed almost similar responses to tillage and N as SOM in the 0 - 20 cm soil depth (Table 7). Zero tillage had the highest TSN stock (0.40 g·kg−1 soil) compared to RT (0.35 g·kg−1 soil) and CT (0.33 g·kg−1 soil) after 2 years of continuous RWCS. Mean values for N rates revealed highest TSN (0.46 g·kg−1 soil) contents at 200 kg·N·ha−1 and lowest TSN (0.29 - 0.30 g·kg−1 soil) at N rate from 0 - 80 kg·N·ha−1. In T × N interaction, highest TSN storage was achieved from ZT (0.48 - 0.50 g·kg−1 soil) at 160 to 200 kg·N·ha−1 and from RT (0.48 g·kg−1 soil) at 200 kg·N·ha−1, while it was lowest (0.28 - 0.30 g·kg−1 soil) at 0 or lower N rates irrespective of the tillage system. Higher TSN sequestration under ZT at higher N rate may be due to more accumulation of crop residues near the soil surface from which soil N is derived. Moreover, N might have incorporated in microbial biomass near the soil surface, leaving less N available for mineralization or leaching [26].
4. Conclusion
In a hot arid climate and in an irrigated condition when crop residues were left on the field, the final biomass and grain yield of wheat under ZT were similar to those obtained under RT and CT; these results support the adoption of ZT for wheat under such conditions. A preceding rice crop residues with wide C:N ratio did not improve the productivity of the subsequent wheat crop but rather demanded more N particularly under ZT. Because wheat biomass, grain yield, net benefit (NB), benefit cost ratio (BCR), soil organic matter (SOM) and total soil N (TSN) responded differently to N among the tillage systems, it can be assume d that N was a limiting factor in the productivity of ZT wheat. Nitrogen at 160 - 200 kg·N·ha−1 produced higher yield and yield attributing characters in addition to higher NB, BCR, SOM, and TSN compared to lower levels of N. Zero tillage had the highest spikes m−2, SOM, and TSN at 200 kg·N·ha−1 among the tillage systems. The results would indicate that ZT may be more productive, economical, and safe environmentally, while sequestering more C and N at higher level of N than RT and CT system. Thus wheat can be grown successfully after rice on silty clay soils with ZT at 200 kg·N·ha−1 in arid climates. The farmers of KPK Pakistan, who face problem of yield decline under CT despite application of higher doses of N to wheat crop, require demonstration of the benefits of higher N level under ZT that may guarantee sustainable and profitable wheat production.
REFERENCES
- MINFAL, “Agriculture Statistics of Pakistan,” Government of Pakistan, Ministry of Food, Agriculture and Livestock, Economic Wing, Islamabad, 2009, p. 20.
- R. S. Chhokar, R. K. Sharma, G. R. Jat, A. K. Pundir and M. K. Gathala, “Effect of Tillage and Herbicides on Weeds and Productivity of Wheat under Rice-Wheat Growing System,” Crop Protection, Vol. 26, No. 11, 2007, pp. 1689-1696. doi:10.1016/j.cropro.2007.01.010
- M. Fan, R. Jiang, X. Liu, F. Zhang, S. Lu, X. Zeng and P. Christie, “Interactions between Non-Flooded Mulching Cultivation and Varying Nitrogen Inputs in Rice-Wheat Rotations,” Field Crops Research, Vol. 91, No. 2-3, 2005, pp. 307-318. doi:10.1016/j.fcr.2004.08.006
- K. S. Gangwar, K. K. Singh, S. K. Sharma and O. K. Tomar, “Alternative Tillage and Crop Residue Management in Wheat after Rice in Sandy Loam Soils of IndoGangetic Plains,” Soil and Tillage Research, Vol. 88, No. 1-2, 2006, pp. 242-252. doi:10.1016/j.still.2005.06.015
- J. M. Holland, “The Environmental Consequences of Adopting Conservation Tillage in Europe: Reviewing the Evidence,” Agriculture, Ecosystems & Environment, Vol. 103, No. 1, 2004, pp. 1-25. doi:10.1016/j.agee.2003.12.018
- S. S. Malhi, C. A. Grant, A. M. Johnston and K. S. Gill, “Nitrogen Fertilization and Management for No-Till Cereal Production in the Canadian Great Plains: A Review,” Soil and Tillage Research, Vol. 60, No. 3-4, 2001, pp. 101-122. doi:10.1016/S0167-1987(01)00176-3
- G. Guarda, S. Padovan and G. Delogu, “Grain Yield, Nitrogen-Use Efficiency and Baking Quality of Old and Modern Italian Bread-Wheat Cultivars Grown at Different Nitrogen Levels,” European Journal of Agronomy, Vol. 21, No. 2, 2004, pp. 181-192. doi:10.1016/j.eja.2003.08.001
- J. Timsina and D. J. Connor, “Productivity and Management of Rice-Wheat Cropping Systems: Issues and Challenges,” Field Crops Research, 69, No. 2, 2001, pp. 93- 132. doi:10.1016/S0378-4290(00)00143-X
- B. Singh and S. S. Malhi, “Response of Soil Physical Properties to Tillage and Residue Management on Two Soils in a Temperate Environment,” Soil and Tillage Research, Vol. 85, No. 1-2, 2006, pp. 143-153. doi:10.1016/j.still.2004.12.005
- D. W. Nelson and L. E. Sommers, “Total Carbon, Organic Carbon, and Organic Matter,” In: A. L. Page, R. H. Miller and D. R. Keeney, Eds., Methods of Soil Analysis, Part 2, Agronomy No. 9, Madison, Wisconsin, 1982, pp. 539-579.
- P. N. Soltanpour, “Use of Ammonium BicarbonateDTPA Soil Test to Evaluate Elemental Availability and Toxicity,” Communications in Soil Science and Plant Analysis, Vol. 16, No. 3, 1985, pp. 322-338. doi:10.1080/00103628509367607
- R. G. D. Steel and J. H. Torrie, “Principles and Procedures of Statistics” McGraw Hill Book Co. Inc., New York, 1980.
- H. Iqtidar, K. M. Ayyaz and K. E. Ahmad, “Bread Wheat Varieties as Influenced by Different Nitrogen Levels,” Journals of Zhejiang University-Science, Vol. 7, No. 1, 2006, pp. 70-78. doi:10.1631/jzus.2006.B0070
- K. Atreya, S. Sharma, R. M. Bajracharya and N. P. Rajbhandari, “Applications of Reduced Tillage in Hills of Central Nepal,” Soil and Tillage Research, Vol. 88, No. 1-2, 2006, pp. 16-29. doi:10.1016/j.still.2005.04.003
- C. Cantero-Martınez, P. Angas and J. Lampurlanes, “Growth, Yield and Water Productivity of Barley (Hordeum vulgare L.) Affected by Tillage and N Fertilization in Mediterranean Semiarid, Rainfed Conditions of Spain,” Field Crops Research, Vol. 84, No. 3, 2003, pp. 341-357. doi:10.1016/S0378-4290(03)00101-1
- S. N. Stratilakis and C. K. Goulas, “Yield Performance at Three Nitrogen Rates of a Set of Honeycomb vs. Traditional Pedigree Selected Bread Wheat Varieties,” European Journal of Agronomy, Vol. 19, No. 1, 2003, pp. 65- 76. doi:10.1016/S1161-0301(02)00014-X
- S. Machado, S. Petrie, K. Rhinhart and A. Qu, “LongTerm Continuous Cropping in the Pacific Northwest: Tillage and Fertilizer Effects on Winter Wheat, Spring Wheat, and spring Barley Production,” Soil and Tillage Research, Vol. 94, No. 2, 2007, pp. 473-481. doi:10.1016/j.still.2006.09.007
- A. M. Kibe, S. Singh and N. Kalra, “Water-Nitrogen Relationships for Wheat Growth and Productivity in Late Sown Conditions,” Agricultural Water Management, Vol. 8, No. 4, 2006, pp. 221-228. doi:10.1016/j.agwat.2006.02.010
- S. Rieger, W. Richner, B. Streit, E. Frossard and M. Liedgens, “Growth, Yield, and Yield Components of Winter Wheat and the Effects of Tillage Intensity, Preceding Crops, and N Fertilization,” European Journal of Agronomy, Vol. 28, No. 3, 2008, pp. 405-411. doi:10.1016/j.eja.2007.11.006
- J. C. Dowson, D. R. Huggins and S. S. Jones, “Characterizing Nitrogen Use Efficiency in Natural and Agricultural Ecosystems to Improve the Performance of Cereal Crops in Low-Input and Organic Agricultural Systems,” Field Crops Research, Vol. 107, No. 2, 2008, pp. 89-101. doi:10.1016/j.fcr.2008.01.001
- O. Erenstein, U. Farooq, R. K. Malik and M. Sharif, “OnFarm Impacts of Zero Tillage Wheat in South Asia’s RiceWheat Systems,” Field Crops Research, Vol. 105, No. 3, 2008, pp. 240-252. doi:10.1016/j.fcr.2007.10.010
- A. V. D. Bossche, S. D. Bolle, S. D. Neve and G. Hofman, “Effect of Tillage Intensity on N Mineralization of Different Crop Residues in a Temperate Climate,” Soil and Tillage Research, Vol. 103, No. 2, 2009, pp. 316-324. doi:10.1016/j.still.2008.10.019
- K. Usman, S. K. Khalil, A. Z. Khan, I. H. Khalil, M. A. Khan and Amanullah, “Tillage and Herbicides Impact on Weed Control and Wheat Yield under Rice-Wheat Cropping System in Northwestern Pakistan,” Soil and Tillage Research, Vol. 110, No. 1, 2010, pp. 101‑107. doi:10.1016/j.still.2010.07.009
- R. Bhattacharyya, V. Prakash, S. Kundu, A. K. Srivastva and H. S. Gupta, “Soil Aggregation and Organic Matter in a Sandy Clay Loam Soil of the Indian Himalayas under Different Tillage and Crop Regimes,” Agriculture, Ecosystems & Environment, Vol. 132, No. 1-2, 2009, pp. 126- 134. doi:10.1016/j.agee.2009.03.007
- R. Lai, “Soil Quality Changes under Continuous Cropping for 17 Seasons for an Alfisol in Western Nigeria,” Land Degradation & Development, Vol. 9, No. 3, 1998, pp. 259-274. doi:10.1002/(SICI)1099-145X(199805/06)9:3<259::AID-LDR290>3.0.CO;2-V
- F. Bessam and R. Mrabet, “Long-Tern Changes in Soil Organic Matter under Conventional Tillage and No-Tillage Systems in Semiarid Morocco,” Soil Use and Management, Vol. 19, No. 2, 2003, pp. 139-143. doi:10.1079/SUM2003181
NOTES
*Corresponding author.