American Journal of Plant Sciences
Vol.3 No.5(2012), Article ID:19476,4 pages DOI:10.4236/ajps.2012.35070
Epidemiology of the Groundnut (Arachis hypogaea L.) Leaf Spot Disease: Genetic Analysis and Developmental Cycles
![]()
1Department of Genetics and Plant Breeding, Regional Nuclear Energy Center, Kinshasa, DR Congo; 2Department of Biological Sciences, Laurentian University, Sudbury, Canada; 3Faculty of Agronomy, University of Kinshasa, Kinshasa, DR Congo.
Email: *knkongolo@laurentian.ca
Received December 3rd, 2011; revised December 27th, 2011; accepted February 12th, 2012
Keywords: Groundnut; Leaf Spot; Cercospora arachidicola; Cercosporidium personatum; DR Congo; Genetic Variation
ABSTRACT
Groundnut leaf spot is one of the important factors limiting groundnut productivity in Africa particularly in the Democratic Republic of Congo (DR Congo). Early and late leaf spot disease of groundnut caused by Cercospora arachidicola Hori and Cercosporidium personatum (Berk & Curt.). Deighton, respectively, can cause considerable yield losses without fungicide management. The main objectives of this research were to analyze plant and disease developmental cycles. Significant differences were observed among the groundnut varieties evaluated for resistance to the leaf spot disease. The results show that plant development cycle can be divided into three developmental stages. A first stage characterized by a low production of leaves, a second stage with a significant leaf development and finally a third stage with a reduction of leaves. Interestingly, the leaf spot disease cycle was also divided in three stages. The disease stage characterized by the highest level of symptom expression was not associated with the plant phase with the highest emerged leaves. Disease symptoms reached the highest pick only after the phase of intense leaf development. The molecular analysis revealed that all the groundnut varieties analyzed were genetically closely related even though they showed different reactions to the leaf spot disease.
1. Introduction
Groundnut (Arachis hypogaea L.) is an important food and forage crop because of its high protein and oil content. Its seed is used as a source of cooking oil and in confectionary products for human consumption [1,2]. Groundnut hay (vine) is a nutritious animal feed, particularly for the subsequent dry season when green forage is not available. In addition, groundnut seed and hay are often sold in local markets, providing income to the resource-poor farmers [1,2]. Pod yield of groundnut crops in the DR Congo averages only 850 kg/ha which is low compared to 2500 kg/ha in developed countries. These low crop yields in DR Congo and other parts of Central Africa are attributed to foliar diseases. Early leaf spot caused by Cercospora arachidicola Hori and late leaf spot caused by Cercosporidium personatum (Berk. & Curt) Deighton, are among the major diseases of groundnut worldwide, including Central Africa [3,4].
Leaf spot symptoms can appear on any above ground parts of groundnut plant including leaves, petioles, stipules, stems and pegs in the later stages of disease [3,4]. Spots first develop on the upper surface of lower leaves as small necrotic pinhead size spots that enlarge and become light to dark brown or black circular spots ranging from 1 to 10 mm in diameter [5]. At later stages these spots coalesce and result in defoliation, causing significant losses in biomass and yield. Early leaf spots are brown to reddish brown in color and always have a yellow halo. Most of the early leaf spot spores are formed on the upper leaf surface giving it a slightly raised surface, while lower leaf surface is usually smooth. Late leaf spots are characterized by dark brown to black spots and usually do not have yellow halo. Most of the late leaf spot spores are formed on the lower surface giving it a rough and tufted appearance, where as upper leaf surface is generally smooth. Leaf spot can cause yield losses of 50% - 70% in West Africa and up to 50% worldwide [6]. This disease is constantly observed in DR Congo and it causes significant losses, with a high severity during rainy periods [5]. Leaf spot can increase rapidly under favorable conditions as several secondary cycles may occur per season. The first appearance of leaf spot and its continuous progress throughout the growing season are heavily dependent upon weather conditions. Environmental conditions required for both types of leaf spot are warm temperatures and long periods of high humidity or leaf wetness. When adequate moisture is present, leaf spot infections may occur in a relatively short period when temperatures are warm [7]. Knowledge of the association between groundnut plant developmental stages and leaf spot disease progression is limited.
The main objective of the present study was to analyze plant and disease developmental cycle at leaf, individual plant and population levels. A comparison of the plant and disease development stages allowed the timing of the period of intense development of the disease in relation to plant development phases.
2. Materials and Methods
2.1. Genetic Materials
Nine groundnut varieties, representing a range of resistance levels to the leaf spot disease were used. They included ICG9998, G17, ICGM281, K12, JL24, JL12; Kimpese, A1408, and A65. The seeds were obtained from INERA-M’vuazi Research Centre in Bas-Congo (DR Congo), except for the variety A65, which was provided by INERA-Gandajika (DR Congo) research station. The main characters of these varieties are described in Table 1.
2.2. Field Trials and Leaf Spot Resistance
The present study was conducted in central region of the DR Congo in Gandajika (Eastern Kasai). The trial was a completely randomized block design (RCBD) with three replicates, at two different sites under natural conditions of infection of leaf spot between 2008 and 2009. Site 1 was located at the research station of the National Institute for Agronomic Studies and Research (INERA) (6˚80'S latitude, 23˚95'E longitude, and 758 m, altitude). The second site was located in farmer’s field in Mpiana (6˚61'S latitude, 23˚93'E longitude, and 704 m, altitude). The previous crops consisted of a fallow of Mimosa Invisa and Brachiaria ruziziensis at site 1 (INERA) and maize (Zea mays L.) at site 2 (Mpiana).
2.3. Plant Development Phases
Groundnut plants were observed at regular intervals since their emergence to the end of the growing season. The number of leaves differentiated by the plant was recorded, and then converted to percentage at the end of the cycle. Graphs describing plant developmental phases referring to the number of differentiated leaves were produced using Excel software 2007.
2.4. Disease Developmental Phases
The development of the disease was monitored on individual groundnut leaf, individual groundnut plant and by considering a groundnut plant population. Disease symptoms were assessed over time based the density of leaf lesions. Total numbers of lesions per leaf on the main stem of 10 plants at random were counted. An average was then calculated for each plant and for the whole sample. The percentage of leaves affected by leaf spot per plant was recorded periodically. The incidence of disease was also assessed by tracking the number of plant newly infected every week in a population of 440 plants. The disease incidence was calculated based on the following formula:
where p1 represents plants population affected by groundnut leaf spots and p2 represents total observed groundnut plants or 440 plants. To compare the different phases for plant and disease cycles for the nine groundnut varieties, the following parameters were estimated: The coefficient of variation assessed as a percentage; CV = standard de viation/mean; the confidence interval whose limits are

Table 1. Principal characteristics of plant materials evaluated in Gandajika, DR Congo.
given by X ± T × Sm, Sm is the standard error of the mean and is estimated by dividing sigma with the square root of n (n = population size); and T is given by the table STUDENT (for the sample of fewer than 30). The significance level was 0.05. Symptom severity was assessed using a scale of increasing severity of 1 to 9, where 1 (no symptoms) represents an apparently healthy plant and 9 a severely infested groundnut plant with 80% to 100% of foliar area infected.
2.5. DNA Extraction
The total cellular DNA from individual samples was extracted from seedling tissue using the method described by Mehes et al. [10] with some modifications. The modification involved addition of PVP (polyvinylpyrrolidone) and β-mercaptoethanol to the CTAB extraction buffer. The DNA concentration was determined using the fluorochrome Hoechst 33258 (bisbensimide) fluorescent DNA quantitation kit from Bio-Rad (cat. # 170-2480) and the purity was determined using a spectrophotometer (Varian Cary 100 UV-VIS spectrophotometer).
2.6. ISSR Analysis
The ISSR amplification was carried out in accordance with the method described by Nagaoka and Ogihara [8], with some modifications described by Mehes et al. [9]. All DNA samples were primed with each of the ten primers used (Table 2). All PCR products were loaded into 2% agarose gel in 1X Tris-Borate-EDTA (TBE) buffer. Gels were pre-stained with 4 μl of ethidium bromide and run at 3.14 V/cm for approximately 120 minutes. These agarose gels were visualized under UV light source, documented with the Bio-Rad ChemiDoc XRS system and analyzed for band presence or absence with the Discovery Series Quantity One 1D Analysis Software. The resulting data matrix of the ISSR phenotype was analyzed using POPGENE software (version 1.32) to estimate genetic diversity parameters [10]. The genetic distances were calculated using Jaccard’s similarity coefficient estimated with the RAPDistance program version 1.04 [11].
3. Results and Discussion
3.1. Plant Developmental Phases
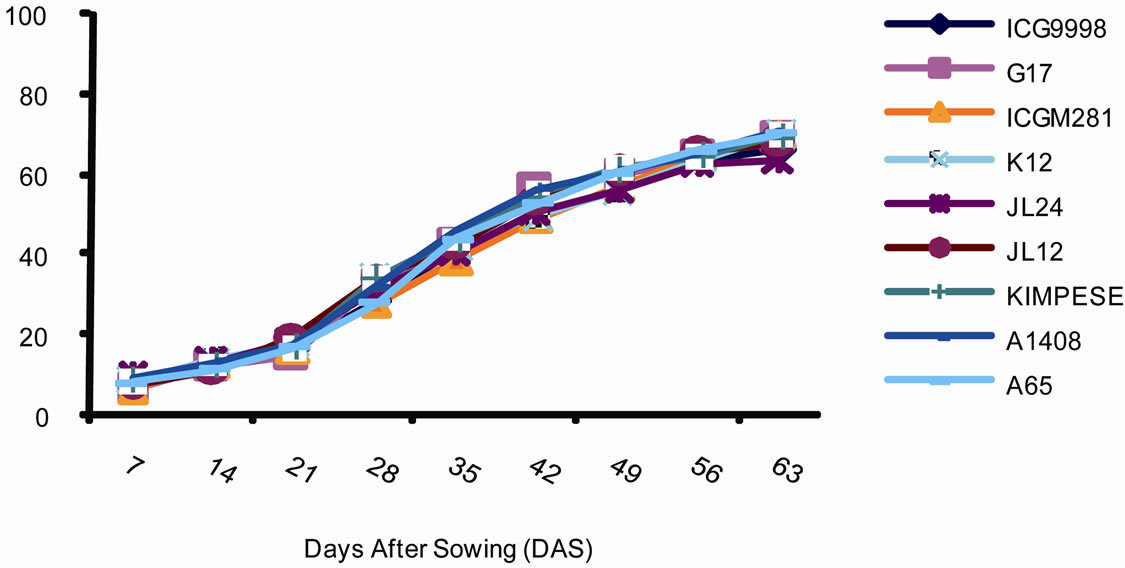
The plant developmental cycle is illustrated in Figure 1. Three plant phases were identified. The first is a stage during which the speed of differentiation of the leaves is slow. This stage starts from seed germination and lasts for 28 days. The percentage of differentiated leaves during this phase was 30%. This phase was followed by a stage of intense differentiation of leaves per plant. This stage lasts between 28th and 49th days. Its duration is 21 days and the percentage of leaves differentiated varied between 50% and 60%. Finally the third phase during which the percentage of leaves differentiated was only

Table 2. The nucleotide sequences of ISSR primers used to screen DNA samples of six groundnut (Arachis hypogaea) varieties from the DR Congo breeding program.
 (a)
(a) (b)
(b)
Figure 1. Percentage of leaves emerged overtime in groundnut (Arachis hypogaea) varieties planted in Gandajika (DR Congo) at (a) site 1 (INERA) and (b) site 2 (Mpiana).
20%. The duration of this phase was 35 days.
3.2. Evaluation of Groundnuts for Disease Severity
The reaction of the nine varieties evaluated was consistent was as expected. ICG998 and ICGM281 from ICRISAT (India) and Bolivia, respectively were the most resistant varieties. G17 variety that was considered susceptible showed a rating of 2.6 on a scale of 1 to 9 and was similar to resistant lines throughout the experimentation at both sites (Table 3). Kimpese that is considered tolerant in previous trials was susceptible at both sites and during other subsequent field trials. Similar results were observed with K12, a tolerant accession that was among the susceptible lines during these trials. A1408 and A65 were susceptible as expected. Resistant genotypes had smaller lesions, longer latent periods, and reduced sporulation as described by Chiteka et al. [12]. Genetically, leaf spot disease is a quantitative disease controlled by many additive genes [13]. Different plant reaction to leaf spot in different environments is expected for a polygenic trait. It should be also pointed out that the weather conditions during the trails were characterized by optimal conditions for both the ground nut plants and leaf spot disease. The monthly average temperature was 27˚C during the growing season and the rainfalls varied from 116 mm to 156 mm per month.
3.3. Disease Developmental Cycles
3.3.1. Development of the Disease on Individual Leaves
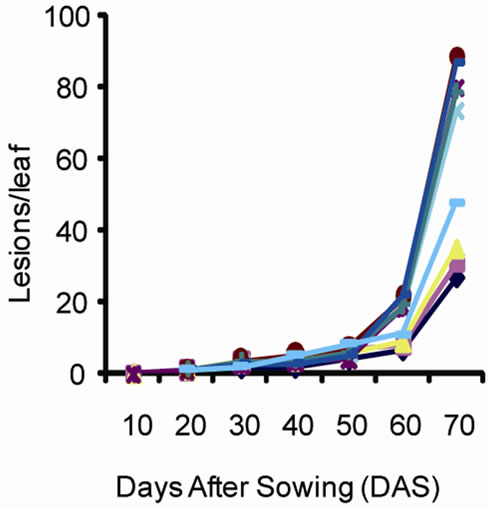
Disease development phases are illustrated in Figure 2. It is noted based on changes in the number of lesions since the onset of symptoms until the end of the growing season that the disease intensifies overtime and reaches its highest level on 72nd day for a growing cycle of 90 days. The change in the number of lesions overtime was similar in both sites. There was a significant increase in the number of lesions after 58 days. The nine varieties could be divided in two groups. The first group including ICG9998, G17 and ICGM281 was characterized by a small number of lesions per leaf (ranging from 26 d to 35 d at Site 1 and from 25 d to 35 d at site 2). The second group that included K12, A65, JL12, A1408, Kimpese and JL24 was characterized by high values of leaf lesions between 47 d and 87 d at both sites. The analysis of variance revealed significant differences between the plant groups for leaf lesions.
In general, the disease development curve revealed three stages. An initial development stage of the disease corresponded to a period when the relative humidity and temperature where most favorable to leaf spot development. The second stage corresponded to an increase of leaf infection. The third stage also corresponded to an increase of the disease expression and incidence associated to weather conditions that were less favorable for foliar disease. Leaf spot symptoms were severe because of the cumulative effect of the infection development
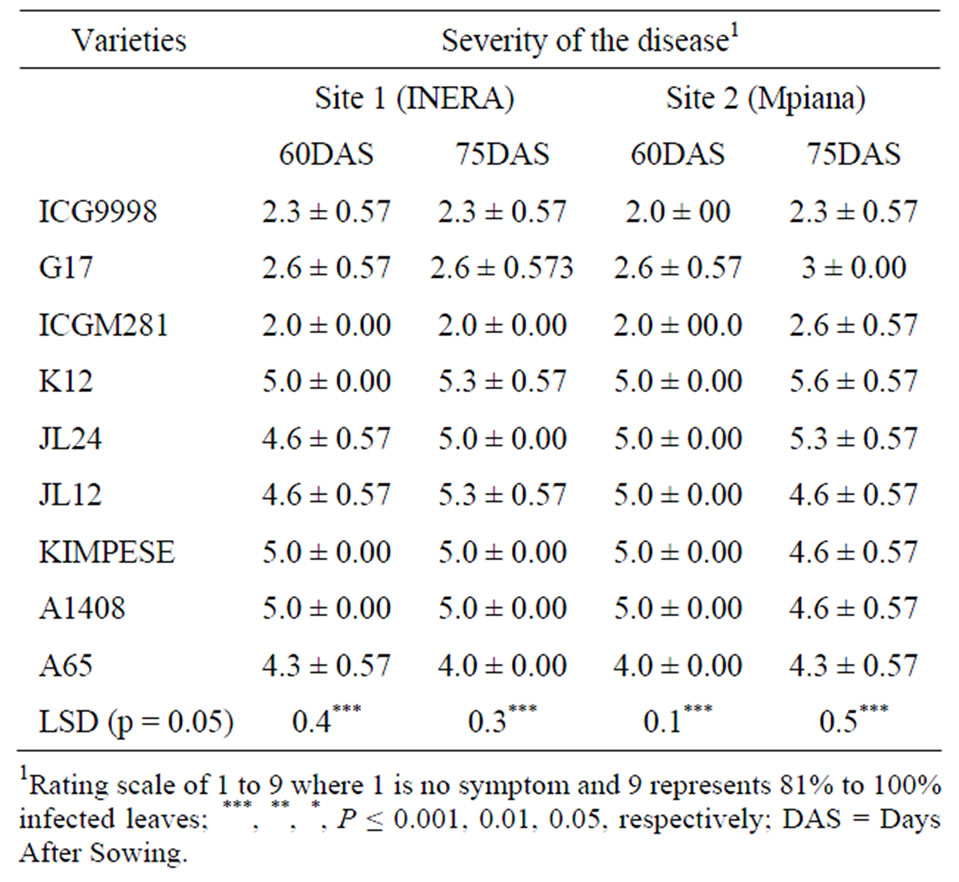
Table 3. Severity of ground nut leaf spot disease at sites 1 (INERA) and 2 (Mpiana) in Gandajika (DR Congo).
 (a)
(a) (b)
(b)
Figure 2. Number of lesions per leaf caused by leaf spot disease over time at (a) site 1 (INERA) and (b) site 2 (Mpiana).
overtime.
3.3.2. Development on Individual Plants
Figure 3 illustrates the disease development on plants. The results show that the percentage of the average number of infected leaves per plant evolves in three stages at sites 1 and 2. The first stage characterized by a slow development of the disease. This stage starts at emergence (day 6) until the 37th day lasting 31 days. The average portion of infected leaves during this stage was below 10%. The second stage characterized by a more intense development of the disease with the average number of affected leaves of 70%. This stage lasts 40 days between 37th and 77th day. Finally, the third stage which starts at 77th day and lasts until the end of the vegetative cycle of the plant. This stage is characterized by a slow development of the disease; the vast majority of leaves being already infected.
3.3.3. Development of the Leaf Spot Disease in a Groundnut Population
Development of the disease in a population of 440 plants was monitored. The curves of leaf spot development in the two sites presented a general S-shaped form (Figure 4). They also have three important stages which vary from one variety to another. The first stage was characterized by a slow development of the disease. The number of infected plants expressed in percentage was below
 (a)
(a)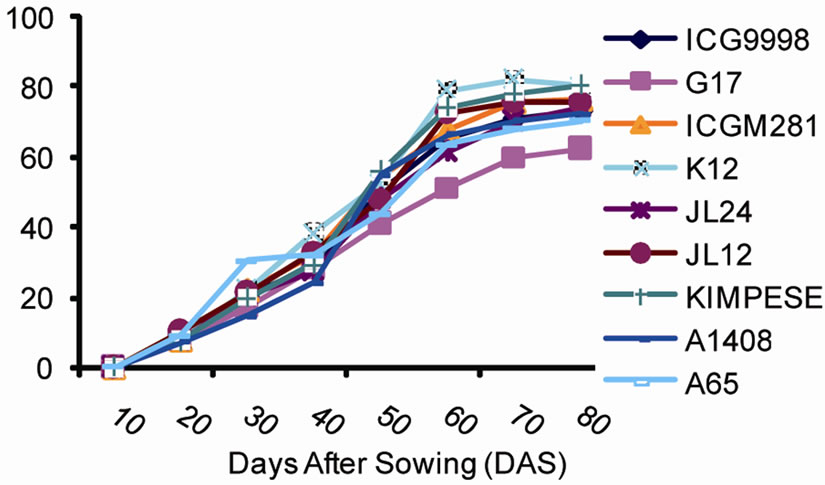 (b)
(b)
Figure 3. Development of leaf spot disease symptoms in a plant at (a) site 1 (INERA) and (b) site 2 (Mpiana).
 (a)
(a) (b)
(b)
Figure 4. Incidence of leaf Spot disease at (a) site 1 (INERA) and (b) site 2 (Mpiana).

Figure 5. Dendrogram of the genetic relationships between groundnut (Arachis hypogaea) varieties from the DR Congo breeding program using the data generated from the Jaccard similarity matrix from ISSR profiles.
10%. This stage corresponds to an incubation period that lasts 7 to 25 days. This phase was followed by an exponential phase during which the disease affected a much larger proportion of leaves. This second phase lasts two to three weeks. The final stage called a stationary phase (saturation) was of variable durations (Figure 4).
Leaf spot development on groundnut plant and population of plants revealed a sigmoid curve with three stages. This polycyclic pattern of leaf spot is consistent with the development cycle of groundnut rust caused by Puccinia arachidis Speg. Similarly, plant development was also divided in three stages similar to groundnut development cycle described by Gillier and Sylvester [14]. Surprisingly, the stage of intense leaf spot development was not associated with the phase of the highest numbers of emerge leaves. In fact, this plant phase occurred between the 25th and 47th days. At that time less than 40% of plants were infected with leaf spot. The highest incidence of plant infection occurred between 47th and 57th days after germination and after the highest pick of leaf production.
Savary and Van Santen [15] reported that the infection of biotrophic parasites particularly leaf spot disease requires a state of maturity of the leaves and especially that of the orifices of the stomata through which the penetration of conidia occurs. The diameter of leaf stomata orifices has to be greater than the germ tube of the pathogen, so that the penetration of the latter in leaf can take place. The period of intense leaf infection corresponded to this stage of leaf maturity which was not associated with the highest number of leaves on plants. The result of the present study suggests that plant physiological traits may play an important role in resistance to leaf spots. The most efficient traits used in selection for resistance to leaf spot disease in groundnut include lesion number, infection ratings and defoliation ratings [16]. The age of the leaf had a significant effect on leaf spot resistance when evaluated using the detached leaf technique. Younger leaves are more susceptible compared to older leaves [13]. In addition many plant with resistance to leaf spot share common characteristics such as late relative maturity.
3.4. Genetic Analysis
The ISSR primers described in Table 3 amplified the DNA samples studied with different band sizes. Six of the nine groundnut varieties were analyzed in detail while other three varieties fail to produce enough seeds and DNA samples for statistical analyses. The level of polymorphic loci among the six groundnut varieties analyzed (A65, Kimpese, J24, K12, ICGM281, and G17) was 44%. In general, the genetic distances among the six varieties varied from 0.09 to 0.28 on a scale of 0 (for identical populations) to 1 (for populations that are dif-

Table 4. Distance matrix generated from ISSR data using the Jaccard’s similarity coefficient analysis for six groundnut (Arachis hypogaea) varieties.
ferent for all criteria) (Table 4). The closest genetic distance value was observed between J24 and Kimpese. The genetic distance data showed that the six varieties analyzed were closely related. These data also revealed that the two leaf spot resistant varieties analyzed (G17 and ICGM 281) cluster together despite the fact that they are from different origin, one from DR Congo and the other from Bolivia. This level of genetic closeness among varieties is consistent with Dwivedi et al. [17] who reported based on RAPD results a high degree of genetic similarity in groundnut germplasms from different provenances. Despite the wide range of morphological diversity observed in the cultivated groundnut gene pool, molecular marker analyses have thus far been unable to detect a parallel level of genetic diversity. Other molecular studies revealed genetic dissimilarity values ranging from 1.2% to 41% by RAPDs [17]. Up to 52% genetic dissimilarity was detected by AFLPs [18] and 56% by SSR [19]. The polymorphism level (44%) detected in the present study with ISSR markers still needs to be validated using several groundnut accessions. Search for ISSR loci associated with leafspot disease resistance genes is in progress.
4. Acknowledgements
This research was conducted through a partnership between Laurentian University (Ontario, Canada), University of Kinshasa (DR Congo), and Caritas Congo. The authors are grateful to the Canadian International Development agency (CIDA) for financial support. Technical assistance of Mrs. Ramya Narendrula for molecular experiments is appreciated.
REFERENCES
- J. B. Naab, F. K. Tsigbey, P. V. V. Prasad, K. J. Boote, J. E. Bailey and R. L. Brandenburg, “Effects of Sowing Date and Fungicide Application on Yield of Early and Late Maturing Peanut Cultivars Grown under Rainfed Conditions in Ghana,” Crop Protection, Vol. 24, No. 4, 2005, pp. 325-332. doi:10.1016/j.cropro.2004.09.002
- S. K. Nutsugah, M. Abudulai, C. Oti-Boateng, R. L. Brandenburg and D. L. Jordan, “Management of Leaf Spot Diseases of Peanut with Fungicides and Local Detergents in Ghana,” Plant Pathology Journal, Vol. 6, No. 3, 2007, pp. 248-253. doi:10.3923/ppj.2007.248.253
- P. Subrahmanyam and D. H. Smith, “Influence of Temperature, Leaf Wetness Period, Leaf Maturity, and Host Genotype on Web Blotch of Peanut,” Oléagineux, Vol. 44, 1989, pp. 27-31.
- P. Subrahmanyam, D. McDonald, R. W. Gibbons, S. N. Nigam and D. L. Nevill, “Resistance to Rust and Late Leaf Spot Diseases in Some Genotypes of Arachis Hypogaea,” Peanut Science, Vol. 9, No. 1, 1982, pp. 6-10. doi:10.3146/i0095-3679-9-1-2
- L. Tshilenge, “Pathosystem Groundnut (Arachis hypogaea L.), Cercospora spp. and Environment in DR-Congo: Overtime Interrelations,” In: K. K. C. Nkongolo, Ed., Contribution to Food Security and Malnutrition in DRCongo, Laurentian Press, 2010, pp. 195-221.
- F. Waliyar, “Evaluation of Yield Losses Due to Groundnut Leaf Diseases in West Africa,” Summary Proceedings of the Second ICRISAT Regional Groundnut Meeting for West Africa, Niamey, 11-14 September 1990.
- D. R. Butler, “Weather Requirements for Infection by Late Leaf Spot in Groundnut,” Summary Proceedings of the Fourth Regional Groundnut Workshop for Sourthern Africa, Arusha, 19-23 March 1990.
- T. Nagaoka and Y. Ogihara, “Applicability of Inter-Simple Sequence Repeat Polymorphisms in Wheat for Use as DNA Markers in Comparison to RFLP and RAPD Markers,” Theoretical and Applied Genetics, Vol. 94, No. 5, 1997, pp. 597-602. doi:10.1007/s001220050456
- M. S. Mehes, K. K. Nkongolo and P. Michael, “Genetic Analysis of Pinus strobus and Pinus monticola Populations from Canada Using ISSR and RAPD Markers: Development of Genome-Specific SCAR Markers,” Plant Systematics and Evolution, Vol. 267, No. 1-4, 2007, pp. 47-63. doi:10.1007/s00606-007-0534-1
- F. C. Yeh and T. J. B. Boyle, “Population Genetic Analysis of Co-Dominant and Dominant Markers and Quantitative Traits,” Belgian Journal of Botany, Vol. 129, 1997, p. 157.
- J. S. Armstrong, A. J. Gibbs, R. Peakall and G. Weiller, “The RAPDistance Package,” 2005. ftp://life.anu.edu.au/pub/RAPDistance
- Z. A. Chiteka, D. W. Gorbet, F. M. Shokes, T. A. Kucharek and D. A. Knauft, “Components of Resistance to Late Leafspot in Peanut. I. Levels and Variability— Implications for Selection,” Peanut Science, Vol. 15, No. 1, 1988, pp. 25-30.
- D. J. Foster, J. C. Wynne and M. K. Beute, “Evaluation of Detached Leaf Culture for Screening Peanuts for Leafspot Resistance,” Peanut Science, Vol. 7, No. 2, 1980, pp. 98- 100. doi:10.3146/i0095-3679-7-2-10
- P. Gillier and P. Sylvestre, “Groundnut, Coll. Agricultural Techniques and Tropical Crop Productions,” Maisonneuve et Larose, Paris, 1969.
- S. Savary and G. Van Santen, “Pathological Approaches for Tropical Crops. Case Study of Groundnut in West Africa,” Editions de l’ORSTOM 213, Paris, 1991, p. 293.
- W. F. Anderson, C. C. Holbrook and J. C. Wynne, “Heritability and Early-Generation Selection for Resistance to Early and Late Leaf spot in Peanut,” Crop Sciences, 1991, Vol. 31, pp. 588-593.
- S. L. Dwivedi, S. Gurtu, S. Chandra, W. Yuejin and S. N. Nigam, “Assessment of Genetic Diversity among Selected Groundnut Germplasm. I: RAPD Analysis,” Plant Breeding, Vol. 120, No. 4, 2001, pp. 345-349. doi:10.1046/j.1439-0523.2001.00613.x
- G. He and C. S. Prakash, “Evaluation of Genetic Relationships among Botanical Varieties of Cultivated Peanut (Arachis hypogaea L.) Using Markers,” Genetic Resources and Crop Evolution, Vol. 48, No. 4, 2001, pp. 347-352. doi:10.1023/A:1012019600318
- E. S. Mace, D. T. Phong, H. D. Upaadhyaya, S. Chandra and J. H. Crouch, “SSR Analysis of Cultivated Groundnut (Arachis hypogaea L.) Germplasm Resistant to Rust and Leaf Spot Diseases,” Euphytica, Vol. 152, No. 3, 2006, pp. 317-330. doi:10.1007/s10681-006-9218-0
NOTES
*Corresponding author.