American Journal of Plant Sciences
Vol.3 No.1(2012), Article ID:16638,9 pages DOI:10.4236/ajps.2012.31004
Quantitative Analysis of ATP Sulfurylase and Selenocysteine Methyltransferase Gene Expression in Different Organs of Tea Plant (Camellia sinensis)
![]()
1College of Resources and Environmental Sciences, Anhui Agricultural University of China, Hefei, China; 2Biotechnology Center of Anhui Agricultural University of China, Hefei, China.
Email: zhulin_2002.163@163.com
Received September 27th, 2011; revised October 25th, 2011; accepted November 15th, 2011
Keywords: Quantitative Real-Time Polymerase Chain Reaction; ATP Sulfurylase; Selenocysteine Methyltransferase; Tea Plant (Camellia sinensis)
ABSTRACT
Tea plant (Camellia sinensis) has unique biological features for the study of cellular and molecular mechanisms, an evergreen broad-leaved woody plant which can accumulate selenium in soil abundant of Selenium. Expression of the genes related to Selenium (Se) metabolism is an adaptation to the soil environment for a long period. The purpose of the present study was to explore if there exist differences of expression about these genes in tea plant between growing in Selenium-abundant and normal soil. A quantitative real-time reverse transcription polymerase chain reaction (Q-RT-PCR) assay was done for quantification of ATP sulfurylase (APS) and selenocysteine methyltransferase (SMT) mRNA normalized to Glyceraldehyde-3-phosphate dehydrogenase (GAPDH) gene in tea plant. Young leaves, mature leaves and tender roots from tea plants growing in soil abundant of Selenium were respectively obtained from Shitai County, Anhui Province, and also the relevant materials of the selenium un-enriched tea plant planted at agricultural garden of Ahui Agriculture University were taken as control for real-time PCR analysis. The results showed that APS1, APS2 and SMT expression levels for either young or mature leaves in selenium-enriched tea plant were lower than that in ordinary (selenium un-enriched) tea plant. In contrast, the APS1, APS2 and SMT expression level of roots in selenium-enriched tea plant were all higher than that in ordinary tea plant. APS1 gene expression level of roots in selenium-enriched tea plant was about 1.6 times higher than that in the ordinary tea plant, APS2 gene expression level was about 4.8-fold higher than that in the ordinary tea plant, SMT gene expression level was about 3.3 times higher than that in the ordinary tea plant. Among various tissues of selenium-enriched tea plant, APS1 gene relative expression level of young leaves was similar to or slightly higher than mature leaves, and the one of roots was the lowest among them; APS2 gene relative expression level of young leaves was similar to or slightly higher than the roots, and the one of mature leaves was the lowest among them; SMT gene relative expression level of young leaves was similar to or slightly higher than mature leaves, and the one of roots was the highest among them. Our results suggest that there existed correlation between selenium and expression levels of these genes.
1. Introduction
Plants primarily take up Se as selenate or selenite reviewed in Terry et al. [1], which is metabolized, via the sulfur (S) assimilation pathway, resulting in the production of selenocysteine (SeCys) [2], selenomethionine and other Se isologs of various S metabolites [3]. Overexpression of Selenocysteine methyltransferase (SMT) in A. thaliana results in the production of Se-methylselenocysteine (MeSeCys) and its derivative c-glutamyl-Se-methylselenocysteine, as well as increased tolerance to selenite [4]. ATP sulfurylase (APS) and SMT are two key enzymes which plays key roles in Selenium(Se) metabolism [5]. ATP sulfurylase catalyzes the formation of adenosine phosphosulfate (APS) from ATP and sulfate [6]. SMT specifically methylates selenocysteine (SeCys) to produce the nonprotein amino acid Se-methyl selenocysteine [7]. We have isolated APS and SMT gene cDNA sequences (APS1, APS2 and SMT) from Camellia sinensis [8,9].
The genes expression related to Selenium (Se) metabolism is an adaptation to the soil environment for a long period. Se hyperaccumulation was found to positively correlate with shoot accumulation of S-methylcysteine (MeCys) and MeSeCys, in addition to the level of SMT enzymatic activity [10]. Our former study found that tea plant growing in Selenium-abundant had more absorption of Selenium than in normal soil [8,9]. The purpose of the present study was to explore if there exist differences of expression about these genes involved in Selenium metabolism in tea plant between growing in Selenium-abundant and normal soil.
The current methods used to study gene expression, such as Northern hybridization and quantitative competitive polymerase chain reaction (PCR), have a limited dynamic range and lack the required sensitivity [11,12]. These techniques are also time-consuming and require large quantities of RNA [13].
Real-time quantitative PCR (RT-qPCR) has become a popular approach adopted by scientists since it is highly sensitive, accurate, and rapid; provides high-throughput results; and can quantify mRNA copy numbers [14-16]. Real-time quantitative PCR remains one of the most sensitive and quantitative tools for gene expression used today. Quantitative PCR (qPCR) is a powerful, highly sensitive technique that can be used to quantitate gene expression, determine gene copy number. Here we report the expression characterization of key enzyme gene related to selenium metabolism in different organs of tea plant by real-time quantitative PCR, to further profile the expression of a number of the transcripts identified through floral induction in different soil environment.
2. Materials and Methods
2.1. Plant Material
Young leaves (recently emerged developing), mature leaves and tender roots from tea plants (Camellia sinensis Qimen-chuyezhong)growing in soil abundant of Selenium (symbolize by FXN, FXL, FG) were respectively collected from Shitai County, Anhui Province, the People’s Republic of China, and also the relevant materials of the selenium un-enriched tea plant (symbolize by PN, PL, PG) obtained from the agricultural garden of Ahui Agriculture University were taken as control for realtime PCR analysis. All tea plant trees have a high of 0.6 m above. The length and width of mature leaves was shorter than 7 cm and 3 cm in these shrubs. The plant materials were frozen in liquid N2 and stored at –70˚C until extraction of RNA.
2.2. PCR Primer Design
The real-time PCR analysis relies on a consistent expression level being maintained by the reference gene through out all experiments. Housekeeping genes (reference genes) are constitutively expressed and required for cellular survival, including functions such as cell wall structure and primary metabolism. Previously, these have been found to be reasonable internal reference genes for normalizing real-time data. These genes are expected to exhibit minor differences in their expression profiles under diverse experimental conditions. Examples such as Actin, Glyceraldehyde-3-phosphate dehydrogenase gene (GAPDH), ribosomal genes, Cyp, and EF1-α have been widely used in RNA blot analyses and are commonly used for realtime RT-PCR in various plant species [13,17,18]. In our experiment, we took GAPDH as internal reference gene and took relevant tea plant materials short of Selenium as control.
One housekeeping gene GAPDH and three key enzyme genes (APS1, APS2, SMT) related to selenium or sulfur metabolism was selected for expression analysis. Primers were designed using Primer Premier 5 software (PREMIER Biosoft International, Palo Alto, CA, USA) with amplicon lengths of 213, 216, 225 and 228 bp respectively. The PCR primer pair specific for GAPDH was rtG-F (5’-TTGGCATCGTTGAGGGTCT-3’) and rtG-R (5’-CAGTGGGAACACGGAAAGC-3’), rtA1-F (5’-GATGGTGATTTGGTTGGTGT-3’) and rtA1-R (5’- TTGGGGAGAGATCCTGTAGTT-3’) for APS1, rtA2-F (5’-ACTGTCTCCTGCGGCACTCC-3’) and rtA2-R (5’- TGCTGCTTCATTCGCCAACTA-3’), rtS-F (5’-ATGGTGTGATGTGGGAGCGT-3’) and rtS-R (5’-CGAGTTTACAGAGTGGTTGGG-3’) for SMT.
2.3. Total RNA Isolation
All the solutions and reagents were prepared in DEPCtreated double distilled water. The plastic materials were treated with DEPC and autoclaved. Glass material and the mortar and pestle were treated for 3 - 6 h at 180˚C.
The extraction buffer contained 100 mM Tris HCl (pH 8.0), 20 mM EDTA, 1.4 M NaCl, 2% CTAB, 2% PVPP, and just prior to use, 2% β-mercaptoethanol. Tissue (0.18 g) added with 2% PVPP was ground to a fine powder in liquid nitrogen using a mortar and pestle. The powder was equally transfer into two 2 mL eppendorf tubes and added to pre-warmed (65˚C) extraction buffer at 10 ml/g of tissue and shaken gently. Tubes were subsequently incubated in a 65˚C water bath for 30 min and shaken every 10mins. Mixtures were extracted with equal volumes chloroform:Isoamyl alcohol (24:1, v/v) and freezing in ice-bath for 10 min, then centrifuged at 13,000 × g for 15 min at 4˚C. The aqueous layer was transferred to a new tube and centrifuged at 13,000 × g for 10 min at 4˚C to remove any remaining insoluble material. This step was proved more critical for root and leave tissues. To the supernatant, 1/3 vol. 8mol/L LiCl and 25 μL β-mercaptoethanol were added, mixed, and then stored overnight at –20˚C, and at –80˚C for 30 min next day. Nucleic acid pellets were collected by centrifugation at 13,000 × g for 30 min at 4˚C The pellet was dissolved in 0.5 mL Trizol (pH 7.5), and then added with 100 μL 2 mol/L NaAc (pH 4.8) and 600 μL hydroxybenzene:chloroform:Isoamyl alcohol (25:24:1, v/v), mixed, freezing in ice-bath for 10 min. mixtures were centrifuge at 12,000 × g for 10 min at 4˚C. The upper phase was added equal volume of hydroxybenzene:chloroform:Isoamyl alcohol (25:24:1, v/v). Centrifuge at 12,000 × g for 10 min at 4˚C. Transfer the upper phase to another tube with equal volume of chloroform-isoamyl alcohol, vortex, and recentrifuge under same conditions. The upper phase was added 1/3 volume of 3 mol/L NaAc (pH 5.2) and double vol. of absolute ethanol, stored at –20˚C for two h. Recover the RNA pellet by centrifugation at 13,000 × g at 4˚ for 15 min and wash the pellet twice with 1 ml of precooled 70% ethanol by centrifuging at 12,000 × g and 4˚ for 2 min. The pellet was dried by air, and dissolved in 20 μl DEPC-treated water. The absorbances of the RNA at wavelengths of 230, 260, 280, and 320 nm were determined with a spectrophotometer (NanoDrop® ND- 1000, Thermo, USA), and 1% agarose gels were run to visualize the integrity of the RNA.
2.4. RNA Purification and cDNA Synthesis
Total RNA samples, separately isolated from emerged developing leaves, mature leaves and tender roots of tea plants, were treated with DNase I (TIANGEN) to remove genomic DNA, and then reverse-transcribed into the first strand cDNAs by using PrimeScript® RT Master Mix (Perfect Real Time)(TaKaRa code DRR036S), which were used as templates in subsequent real-time quantitative PCR analysis. Reactions were done in 10μl volumes containing 25 pmol of oligo dT primer and 50 pmol random 6 mers, total RNA corresponding to 400 ng, added with 2.0 μl 5 × PrimeScript® Buffer (for Real Time) and 0.5 μl PrimeScript® RT Enzyme Mix I.
Reactions were run using the manufacturer’s recommended cycling parameters of 37˚C for 15 min, 85˚C for 5 sec, and 4˚C for 1 min. The concentrations of the synthesized cDNA were determined, and the cDNA was diluted up to 0.75 - 0.85 μg/μL for use in RT-qPCR.
2.5. Real-Time PCR Conditions and Analysis
PCR reactions were performed in 96-well plates with an Multicolor Real-time PCR Detection System (Bio-rad iQ5) using SYBR® Green to detect dsDNA synthesis. Reactions were done in 20 μl volumes containing 10 μM of each primer, 1 μl cDNA corresponding to 0.72 - 0.85 μg), and 10.0 μl 2 × SYBR® Premix Ex TaqTM II Reagent (TaKaRa). Three replications were done for each gene analysis of Real-time PCR.
Aliquots from the same cDNA sample were used with all primer sets in each experiment. Reactions were run using the manufacturer’s recommended cycling parameters of 95˚C for 1 min, 40 cycles of 94˚C for 15 s, 57.7˚C/ 61.7˚C (57.7˚C for APS1and SMT, 61.7˚C for APS2) for 30 s and 72˚C for 20 s. Fluorescence signals were collected at each polymerization step. The Ct values, upon which the calculations for relative expression levels of APS1, APS2 and SMT were based, were the means of triplicate independent PCRs for both the target and the endogenous control. No-template controls were included for each primer pair and each PCR reaction was completed in triplicate. Dissociation curves for each amplicon were then analyzed to verify the specificity of each amplification reaction; the dissociation curve was obtained by heating the amplicon from 55˚C to 95˚C.
Relative gene expression data were analyzed using real-time quantitative PCR and the 2–DDCT method [19]. For the –DDCT calculation to be valid, the amplification efficiencies of the target and reference must be approximately equal. A sensitive method for assessing if two amplicons have the same efficiency is to look at how –DDCT varies with template dilution. Expression levels were determined as the number of amplification cycles needed to reach a fixed threshold in the exponential phase of the PCR reaction (Ct). DCT is equal to the difference in threshold cycles for target and reference (Ct target-Ct reference). For amplicons designed to be between 210 to 230 bp and for which the primer and Mg2+ concentrations have been properly optimized, the efficiency is close to one. Therefore, the amount of target, normalized to an endogenous reference and relative to a calibrator, is given by amount of target = 2–DDCT. Here, DDCT = DCTs – DCTc. DCTs is equal to the difference in threshold cycles of the sample (tea plant materials rich in Selenium), and DCTc is the one of the control (tea plant materials short of Selenium).
3. Results
3.1. Isolation and Quality Detection of Total RNA
Electrophoresis of isolated RNA on 1% agarose gel stained with SYBR Green I showed distinct 28S and 18S rRNA bands, indicating a good quality of total RNA (Figure 1). The A260/A230 absorbance ratio indicates polysaccharide or polyphenolic contamination, and the A260/ A280 ratio indicates protein contamination [20]. We repeatedly obtained A260/A230 ratios greater than 2, and the A260/A280 ratios were always between 1.9 and 2.3 (Table 1, except for roots from tea plants short of selenium),
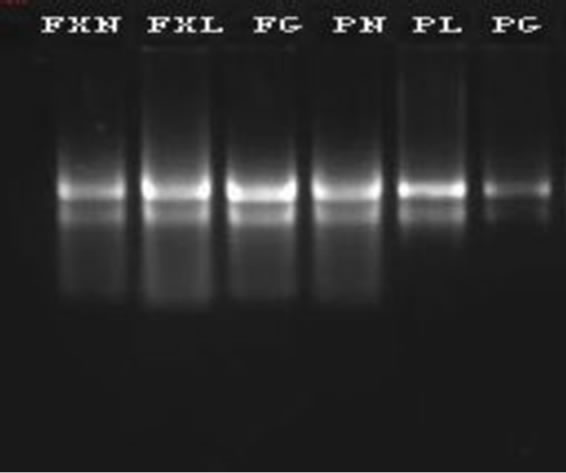
Figure 1. Agrose gel electrophoresis of total RNA.
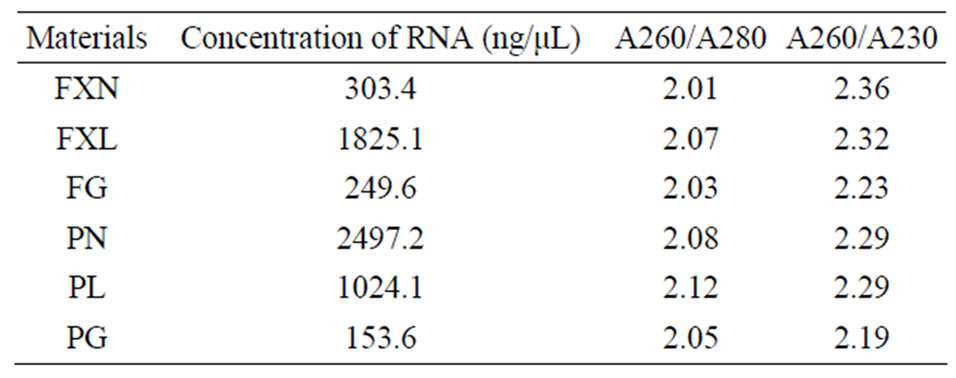
Table 1. Spectrophotometric analysis of RNA quality and quantity.
indicating that there was no polysaccharide, polyphenol, or protein contaminations in our preparation.
Apart from the integrity of the ribosomal bands visualized on an SYBR Green I agarose gel (Figure 1), the high quality of RNA was further evaluated by the first strand cDNAs of reverse-transcription and qPCR. The concentrations of various sample cDNAs are more 700 ng/μl (data not shown).
3.2. Quantification of the Discrepancy APS and SMT Expression between Selenium Enriched and Selenium Un-Enriched Tea Plant
Considering that the tea plant has different reaction to the selenium content of soil, it was necessary to investigate the expression patterns of the genes related to selenium metabolism in the development of tea plant. To evaluate the specificity of amplification product of the interrelated genes, the reverse-transcribed cDNAs of six samples (young leaves, mature leaves and tender roots of tea plant with low or high selenium content) were amplified by the method for an SYBR Green qPCR assay. We can draw a conclusion that it has only single sharp peak for APS1, APS2, SMT and the reference gene GAPDH from the dissociation curves, which ascertain the absence of primer dimmers and non-specific amplification products. Meanwhile, PCR amplification curves also show that amplifi- cation has good reproducibility in each sample (Figure 2, Figure 3).
The genes and enzymes involved in selenium metabolism have been extensively reviewed [5,7,21,22], and the selenium metabolism pathway is highly conserved in plants and some bacteria. The expressions of APS1, APS2 and SMT were observed by q-PCR in all tissues of either selenium-enriched or ordinary (selenium un-enriched) tea plant (Figure 4). From the results obtained, we conclude
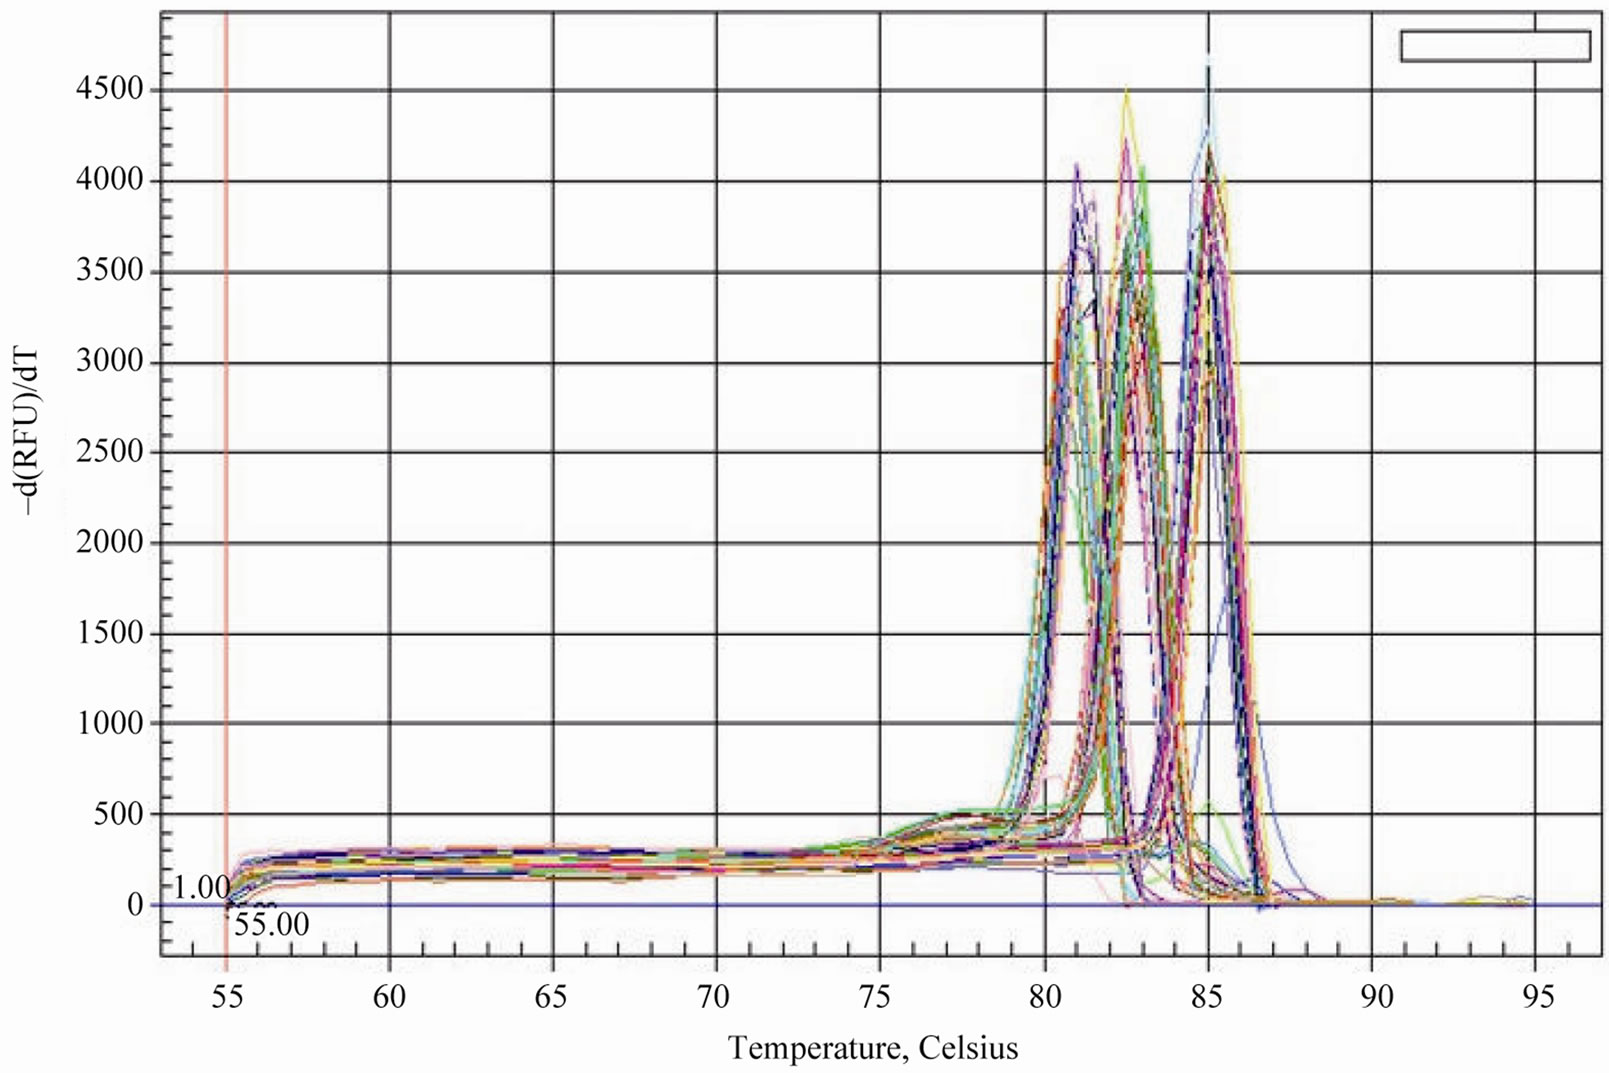
Figure 2. The dissociation curves (melting curves) of APS1, SMT and GAPDH qPCR product.
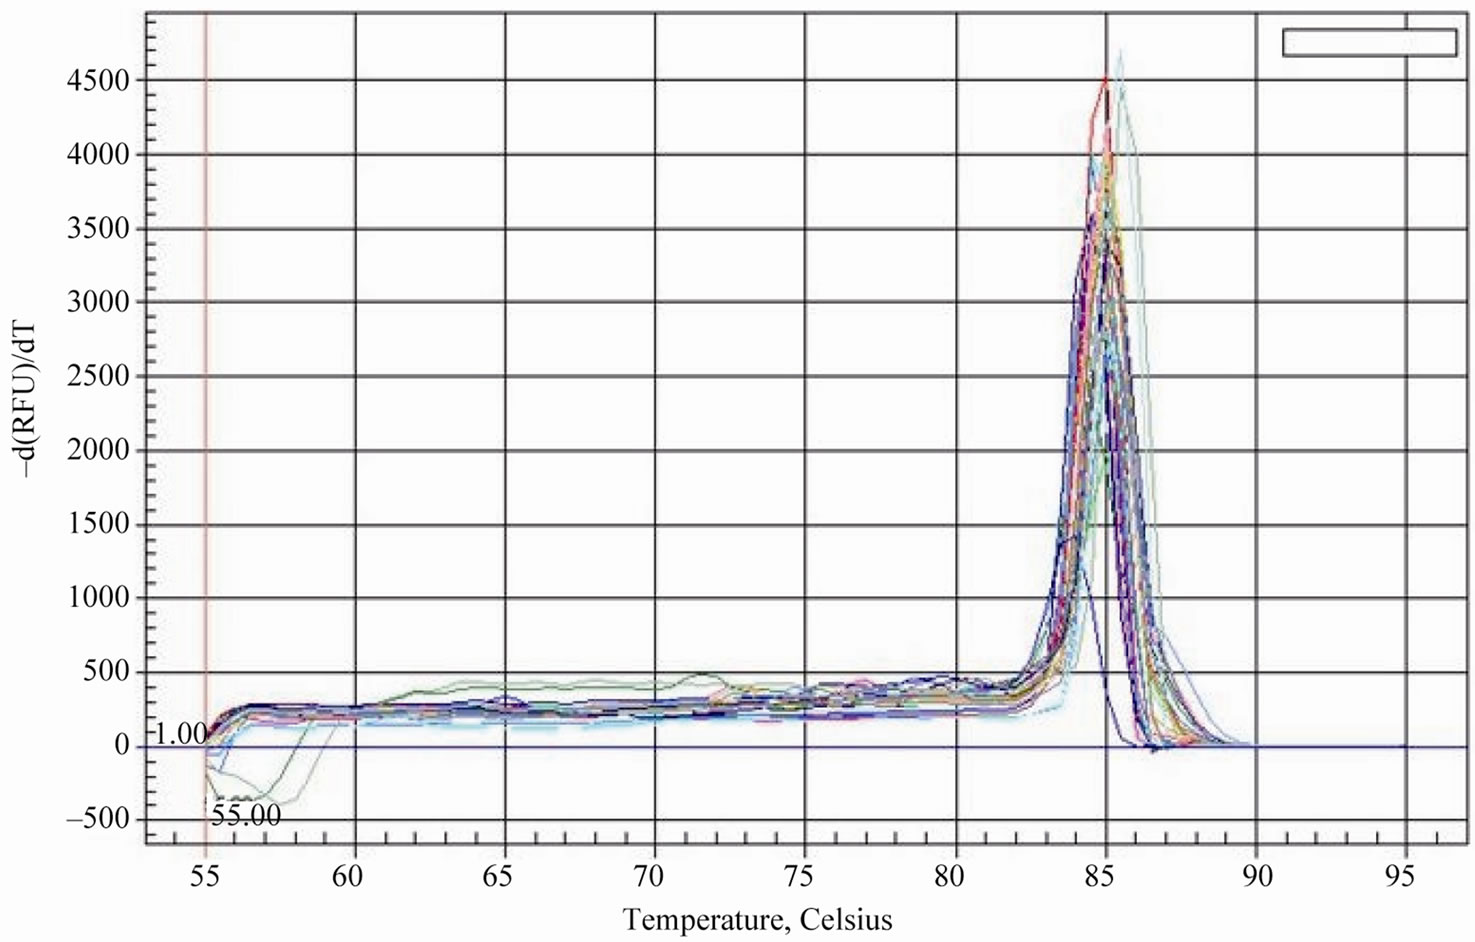
Figure 3. The dissociation curves (melting curves) of APS2 and GAPDH qPCR product.
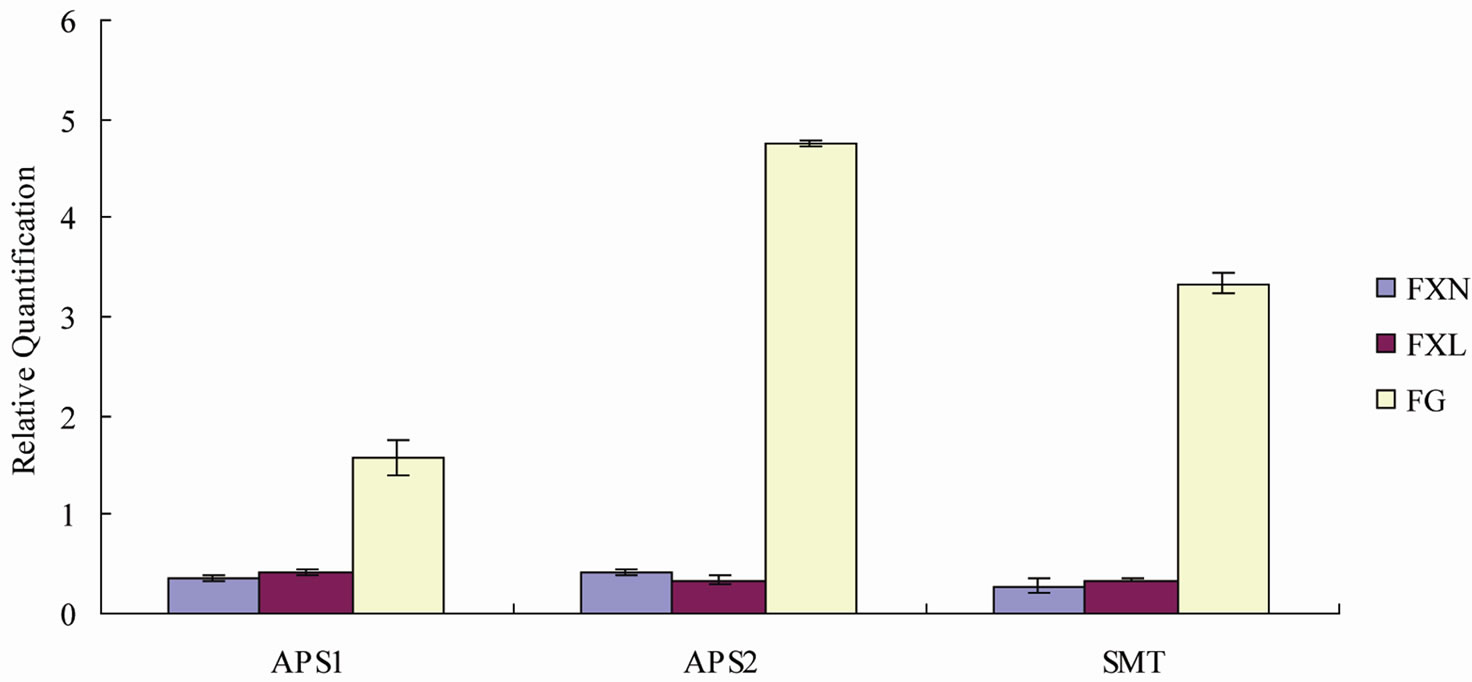
Figure 4. Relative quantification of APS1, APS2 and SMT expressions in different tissues of tea plant, and the values were ratios about the genes expression in three tissues of selenium-enriched to selenium un-enriched tea plant.
that APS1, APS2 and SMT expressions for either young or mature leaves in selenium-enriched tea plant were weaker than that in ordinary tea plant. In contrast, the APS1, APS2 and SMT expression level of roots in selenium-enriched tea plant were all higher than that in ordinary tea plant. APS1 gene expression level of roots in selenium-enriched tea plant was about 1.6 times higher than that in the ordinary tea plant, APS2 gene expression level was about 4.8-fold higher than that in the ordinary tea plant, SMT gene expression level was about 3.3 times higher than that in the ordinary tea plant.
3.3. Gene Relative Expression in Different Organs of Selenium-Enriched Tea Plant
The expression amounts of the same gene in different parts of the selenium-enriched tea were compared. The relative expression amounts (the former to the latter) was given as Table 2.
We can also conclude that APS1 gene relative expression level of young leaves was similar to or slightly higher than mature leaves in enriched tea plant. The relative expression levels of them were about 5.43-fold and 4.96-fold higher than the roots, and the one of roots was the lowest among the three tissues. APS2 gene relative expression level of young leaves was similar to or slightly higher than the roots and the one of mature leaves was the lowest among them. SMT gene relative expression level of young leaves was similar to or slightly higher than mature leaves, and the one of roots was the highest among them.
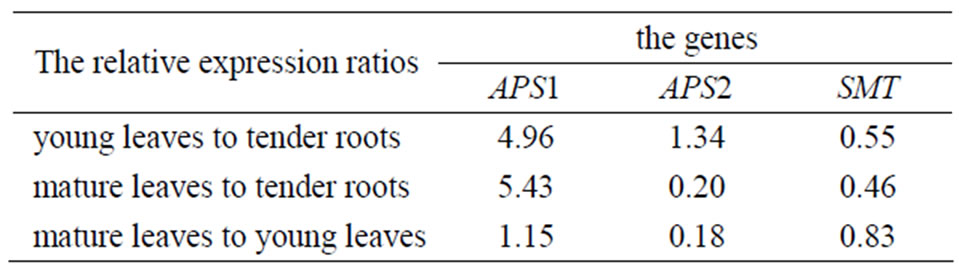
Table 2. The relative expression of APS1, APS2 and SMT in different tissues of selenium-enriched tea plant.
4. Discussion
Tea plant has unique biological features for the study of cellular and molecular mechanisms. It is an evergreen broad-leaved woody plant. Its growth and development involves strategic storage and redistribution of metabolites in concordance with inter-annual climatic cycles, and it is rich in polysaccharides and polyphenols. These features present challenges to the high quality RNA isolation from a wide range of tea plant tissues and organs, spanning different developmental stages as well as exposure to biotic stress. Hence, for each new plant species or tissues being studied, RNA isolation methods have to be adjusted and optimized. In our previous experiments, several standard methods and commercially available kits for RNA isolation failed to give either high quality or high yield of RNA for various tea plant tissues and organs. Even the simplest modifications have proved to be efficient as in the case described here.
For the successful isolation of intact RNA from plant tissues rich in polysaccharides and polyphenols, it is important to prevent these contaminating substances from binding to nucleic acids. These substances may coprecipitate and contaminate RNA during extraction, affecting its yield and quality [20]. Additionally, pectic substances in the cell wall of forest trees and the high content of polyphenolics may complicate nucleic acid extraction. For these reasons, high concentrations of PVP and β-mercaptoethanol were used to prevent polyphenolic oxidation and formation of high-molecular-weight complexes with nucleic acids and proteins [23]. The high concentrations of CTAB and salt were used in the extraction buffer to preserve the integrity of nuclear and organellar membranes, yielding total RNA with the lower concentrations of unspliced hetero nuclear transcripts (hnmRNA) as well as an increased RNA-to-DNA ratio [24,25]. One disadvantage of using this detergent is that it may artificially increase absorbance at 260 nm if still present in the final RNA solution [26]. The high Na+ molarity of the extraction buffer will increase the solubility of polysaccharides, thus reducing their coprecipitation with RNA in later steps of the protocol [27,28]. RNA extracts are further depleted of coextracted DNA during the LiCl precipitation. The high molarity LiCl solution not only precipitates RNA differentially from DNA but also favors a precipitation of larger transcripts over smaller ones [29]. Finally, SDS extraction and ethanol precipitation were added after LiCl precipitation, which is necessary for the removal of contaminants, organic molecules and residual Li+.
Quantitative PCR allows the researcher to view the entire reaction and product being generated throughout all stages of the reaction [30]. In its simplest and cheapest form, real-time PCR employs the DNA-binding dye, SYBRGreen. SYBR Green binds to the minor groove of double-stranded DNA and fluoresces at a much higher intensity when bound to double-strand DNA when compared with the dye in free solution. As the amplification reaction proceeds and more double-stranded amplicons are produced, the SYBR Green dye fluorescence signal will increase and can be detected. As SYBR Green will bind indiscriminately to any double-stranded piece of DNA, it is important that the assay is completely optimized so that only the specific target of interest is amplified and that non-specific products or primer dimers are excluded. Quantitative PCR can accurately compare discrepancy among the expressions of specific genes in different tissues. ΔΔCt analysis calculates the relative change in expression when comparing the ΔΔCt value of the target gene to the reference gene under a control condition [31]. Gene expressions of selenium-enriched and ordinary tea plant in different tissues were analyzed by ΔΔCt methods. This result is corrected by reference to the level of gene expression in the test sample relative to the target gene in the calibration samples, calibration of the target gene with a reference gene to make up the difference between samples. In the amplification process, the core of the problem is the amplification efficiency, if the efficiency of target gene and reference gene is not equal to 2 or the same, ΔΔCt analysis would not be accurate. So we should exclude impact of various factors as far as possible, which demands the high quality of the samples and experimental operation.
Plants primarily take up Se as selenate or selenite from soil [32-34]. After absorbed, they mainly are transported to the chloroplast, and then metabolized via the sulfur assimilation pathway, resulting in the production of selenocysteine, SeMet and other Se analogues of various S metabolites [3,35]. APS can activate and reduce selenate. It plays key roles in Selenium (Se) reduction and accumulation [36-38]. APS2 had a chloroplast transit peptide sequence, and may be located in the chloroplast [8, 39,40]. Our results also showed that APS2 gene expression was the highest in the leaves of Selenium enriched tea plant among all tested tissues. The relative expression of APS2 gene in the mature leaves and tender roots of selenium-enriched tea was low; the relative expression level of APS1 gene in the young leaves was in similar to mature leaves, roots was the lowest. From the relative expression of APS1 and APS2 genes we guess that both gene expressions may be related to their site of action. APS1 may be located in cytoplasm, since APS1 has the highest expression level in mature leaves. APS2 may be located in the chloroplast, which has the highest expression level in young leaves.
Generally, selenate transport from root to shoot was highly dependent on the chemical form of the selenate supplied. The Shoot/root ratio of total Se content in all plant species studied ranged from 0.6 to 1 for plants supplied with SeMeth and was less than 0.5 for those supplied with  while this ratio ranged from 1.4 for rice to 17.2 for Indian mustard when
  was the form of supplied Se [41]. A large number of selenate are transferred to and accumulated in the leaves, while only a small amount of selenite and organic selenium transferred and accumulated to the leaves. Selenite is almost transferred to the plants, probably because it soon be transformed into organic Se (e.g., selenomethionine) and left in the root [42]. The relative expression level of SMT gene in young leaves of Selenium-enriched tea plant was similar to that in mature leaves, and it was the highest in roots. These implied that selenite was quickly converted to organic selenium and left in the root.
We have compared the relative expression of APS, SMT gene in selenium-enriched tea plant with that of ordinary tea plant and the expression of different tissues of selenium-enriched tea plant, but we just discussed the APS, SMT gene expression discrepancy at the transcriptional level. As a result of that assimilation, accumulation and conversion of selenium involve in a very complex metabolic process, it need further research to illuminate the traits of APS and SMT at genetic translation level, and related amino acids content in different parts of tea plant, to validate APS, SMT roles in the process of selenium metabolism in tea plant.
5. Acknowledgements
This study was financially supported by grants From the National Natural Science Foundation of China (Grant No. 30971870) and the Natural Scientific Research Item of Education Department of Anhui Province (KJ2007B116).
REFERENCES
- N. Terry, A. M. Zayed, M. P. De Souza and A. S. Tarun, “Selenium in Higher Plants,” Annual Review of Plant Physiology and Plant Molecular Biology, Vol. 51, No. 1, 2000, pp. 401-432. doi:10.1146/annurev.arplant.51.1.401
- B. H. Ng and J. W. Anderson, “Synthesis of Selenocysteine by Cysteine Synthase from Selenium Accumulator and Non-Accumulator Plants,” Phytochemistry, Vol. 17, No. 12, 1978, pp. 2069-2074. doi:10.1016/S0031-9422(00)89282-1
- D. R. Ellis and D. E. Salt, “Plants, Selenium and Human Health,” Current Opinion in Plant Biology, Vol. 6, No. 3, 2003, pp. 273-279. doi:10.1016/S1369-5266(03)00030-X
- D. R. Ellis, T. G. Sors, D. G. Brunk, C. A. lbrecht, C. Orser, B. Lahner, K. V. Wood, H. H. Harris, I. J. Pickering and D. E. Salt, “Production of Se-Methylselenocysteine in Transgenic Plants Expressing Selenocysteine Methyltransferase,” BMC Plant Biology, Vol. 4, 2004, p. 1. doi:10.1186/1471-2229-4-1
- B. Neuhierl, M. Thanbichler, F. Lottspeich and A. BÖck, “A Family of S-Methylmethionine-Dependent Thiol/Selenol Methyltransferases,” Journal of Biological Chemistry, Vol. 274, No. 9, 1999, pp. 5407-5414.
- T. Leustek, M. Murillo and M. Cervantes, “Cloning of a cDNA Encoding ATP Sulfurylase from Arabidopsis Thaliana by Functional Expression in Sac-Charomyces Cerevisiae,” Plant Physiology, Vol. 105, No. 3, 1994, pp. 897-902.
- B. Neuhierl and A. BÖck, “On the Mechanism of Selenium Tolerance in Selenium-Accumulating Plants: Puri- fication and Characterization of a Specific Selenocysteine Methyltransferase from Cultured Cells of Astragalus Bisulcatus,” European Journal of Biochemistry, Vol. 239, No. 1, 1996, pp. 235-238. doi:10.1111/j.1432-1033.1996.0235u.x
- L. Zhu, W. W. Deng, A. H. Ye, M. Yu, Z. X. Wang and C. J. Jiang, “Cloning of Two cDNAs Encoding a Family of ATP Sulfurylasefrom Camellia Sinensis Related to Selenium or Sulfur Metabolism and Functional Expression in Escherichia Coli,” Plant Physiology and Biochemistry, Vol. 46, No. 8-9, 2008, pp. 731-738. doi:10.1016/j.plaphy.2007.03.029
- L. Zhu, C. J. Jiang, W. W. Deng, X. Gao, R. J. Wang and X. C. Wan, “Cloning and Expression of Selenocysteine Methyltransferase cDNA from Camellia Sinensis,” Acta Physiologiae Plantarum, Vol. 30, No. 2, 2008, pp. 167- 174. doi:10.1007/s11738-007-0105-7
- T. G. Sors, D. R. Ellis, G. N. Na, B. Lahner, S. Lee, T. Leustek, I. J. Pickerin and D. E. Salt, “Analysis of Sulfur and Selenium Assimilation in Astragalus Plants with Varying Capacities to Accumulate Selenium,” The Plant Journal, Vol. 42, No. 6, 2005, pp. 785-797. doi:10.1111/j.1365-313X.2005.02413.x
- J. N. Qi, S. C. Yu, F. L. Zhang, X. Q. Shen, X. Y. Zhao, Y. J. Yu and D. S. Zhang, “Reference Gene Selection for Real-Time Quantitative Polymerase Chain Reaction of mRNA Transcript Levels in Chinese Cabbage (Brassica rapa L. ssp. pekinensis),” Plant Molecular Biology Reporter, Vol. 28, No. 4, 2010, pp. 597-604. doi:10.1007/s11105-010-0185-1
- S. J. Vandecasteele, W. E. Peetermans, R. Merckx and J. Van Eldere, “Quantification of Expression of Staphylococcus Epidermidishousekeeping Genes with Taqman Quantitative PCR during in Vitro Growth and under Different Conditions,” Journal of Bacteriology, Vol. 183, No. 24, 2001, pp. 7094-7101. doi:10.1128/JB.183.24.7094-7101.2001
- J. D. Dean, P. H. Goodwin and T. Hsiang, “Comparison of Relative RT-PCR and Northern Blot Analyses to Measure Expression of β-1,3-Glucanase in Nicotiana benthamiana Infected with Colletotrichum destructivum,” Plant Molecular Biology Reporter, Vol. 20, No. 4, 2002, pp. 347-356. doi:10.1007/BF02772122
- S. A. Bustin, “Absolute Quantification of mRNA Using Real-Time Reverse Transcription Polymerase Chain Reaction Assays,” Journal of Molecular Endocrinology, Vol. 25, No. 2, 2000, pp. 169-193. doi:10.1677/jme.0.0250169
- M. Orsel, A. Krapp and F. Daniel-Vedele, “Analysis of the NRT2 Nitrate Transporter Family in Arabidopsis. Structure and Gene Expression,” Plant Physiology, Vol. 129, No. 2, 2002, pp. 886-888. doi:10.1104/pp.005280
- B. R. Kim, H. Y. Nam, S. U. Kim, S. I. Kim and Y. J. Chang, “Normalization of Reverse Transcription Quantitative-PCR with Housekeeping Genes in Rice,” Biotechnology Letters, Vol. 25, No. 3, 2003, pp. 1869-1872. doi:10.1023/A:1026298032009
- A. Bézier, B. Lambert and F. Baillieul, “Study of Defense-Related Gene Expression in Grapevine Leaves and Berries Infected with Botrytis Cinerea,” European Journal of Plant Pathology, Vol. 108, No. 2, 2002, pp. 111- 120. doi:10.1023/A:1015061108045
- C. Thomas, D. Meyer, M. Wolff, C. Himber, M. Alioua and A. Steinmetz, “Molecular Characterization and Spatial Expression of the Sunflower ABP1 Gene,” Plant Molecular Biology, Vol. 52, No. 5, 2003, pp. 1025-1036. doi:10.1023/A:1025482432486
- J. K. Livak and D. T. Schmittgen, “Analysis of Relative Gene Expression Data Using Real-Time Quantitative PCR and the 2–DDCT Method,” Methods, Vol. 25, No. 4, 2001, pp. 402-408. doi:10.1006/meth.2001.1262
- J. Logemann, J. Schell and L. Willmitzer, “Improved Method for the Isolation of RNA from Plant Tissues,” Analytical Biochemistry, Vol. 163, No. 1, 1987, pp. 16-20. doi:10.1016/0003-2697(87)90086-8
- E. A. H. Pilon-Smits, S. Hwang, C. M. Lytle., Y. L. Zhu, J. C. Tai, R. C. Bravo, Y. C. Chen, T. Leustek and N. Terry, “Overexpression of ATP Sul-Furylase in Indian Mustard Leads to Increased Selenate Uptake, Reduction, and Tolerance,” Plant Physiology, Vol. 119, No. 1, 1999, pp. 123-132. doi:10.1104/pp.119.1.123
- D. L. LeDuc, A. S. Tarun, M. Montes-Bayon, J. Meija, M. F. Malit, C. P. Wu, et al., “Overexpression of Selenocysteine Methyltransferase in Arabidopsis and Indian Mustard Increases Selenium Tolerance and Accumulation,” Plant Physiology, Vol. 135, No. 1, 2004, pp. 377-383. doi:10.1104/pp.103.026989
- C. S. Wang and L. O. Vodkin, “Extraction of RNA from Tissues Containing High Levels of Procyanidins That Bind RNA,” Plant Molecular Biology Reporter, Vol. 12, No. 2, 1994, pp. 132-145.
- S. L. Dellaporta, J. Wood and J. B. Hicks, “A Plant DNA Minipreparation,” Plant Molecular Biology Reporter, Vol. 1, No. 4,1983, pp. 19-21. doi:10.1007/BF02712670
- M. Mejjad, F. Vedel and G. Ducreux, “Improvement of DNA Preparation and of PCR Cycling in RAPD Analysis of Marine Microalgae,” Plant Molecular Biology Reporter, Vol. 12, No. 2, 1994, pp. 101-105. doi:10.1007/BF02668370
- J. J. Doyle and J. L. Doyle, “Isolation of Plant DNA from Fresh Tissue,” Focus, Vol. 12, No. 12, 1990, pp. 13-15
- G. Fang, S. Hammar and R. Rebecca, “A Quick and Inexpensive Method for Removing Polysaccharides from Plant Genomic DNA,” Bio Techniques, Vol. 13, No. 1, 1992, pp. 52-56
- M. A. Lodhi, G. N. Ye, N. F. Weeden and B. I. Reisch, “A Simple and Efficient Method for DNA Extraction from Grapevine Cultivars and vitis Species,” Plant Molecular Biology Reporter, Vol. 12, No. 1, 1994, pp. 6-13. doi:10.1007/BF02668658
- A. B. Iandolino, F. Goes da Silva, H. Lim, H. Choi, L. E. Williams and D. R. Cook, “High-Quality RNA, cDNA, and Derived EST Libraries from Grapevine (Vitis vinifera L.),” Plant Molecular Biology Reporter, Vol. 22, No. 3, 2004, pp. 269-278. doi:10.1007/BF02773137
- S. E. Denman and C. S. Mcsweeney, “Quantitative (RealTime) PCR,” In: H. P. S. Makkar and C. S. McSweeney, Eds., Methods in Gut Microbial Ecology for Ruminants, CSIRO Livestock Industries, Queensland, 2005, pp. 105- 115. doi:10.1007/1-4020-3791-0_8
- M. W. Pfaffl, “A New Mathematical Model for Relative Quantification in Real-Time RT-PCR,” Nucleic Acids Research, Vol. 29, No. 9, 2001, pp. 2002-2007. doi:10.1093/nar/29.9.e45
- M. P. Arvy, “Selenate and Selenite Uptake and Translocation in Bean Plants (Phaseolus vulgaris),” Journal of Experimental Botany, Vol. 44, No. 6, 1993, pp. 1083- 1087. doi:10.1093/jxb/44.6.1083
- M. Montes-Bayón, D. L. LeDuc, N. Terry and J. A. Caruso, “Selenium Speciation in Wild-Type and Genetically Modified Se Accumulating Plants with HPLC Separation and ICP-MS/ES-MS Detection,” Journal of Analytical Atomic Spectrometry, Vol. 17, No. 8, 2002, pp. 872-879.
- P. Cartes, L. Gianfreda and M. L. Mora, “Uptake of Selenium and Its Antioxidant Activity in Ryegrass When Applied as Selenate and Selenite Forms,” Plant and Soil, Vol. 276, No. 1-2, 2005, pp. 359-367. doi:10.1007/s11104-005-5691-9
- T. Leustek, M. N. Martin, J. A. Bick and J. P. Davies, “Pathways and Regulation of Sulfur Metabolism Revealed through Molecular and Genetic Studies,” Annual Review of Plant Physiology and Plant Molecular Biology, Vol. 51, 2000, pp. 141-165. doi:10.1146/annurev.arplant.51.1.141
- J. W. Anderson and A. R. Scarf, “Selenium and Plant Metabolism,” In: D. A. Robb and W. S. Pierpoint, Eds., Metals and Micro Nutrients: Uptake and Utilization by Plants, Academic, London, 1983, pp. 241-275.
- G. L. Dilworth and R. S. Bandurski, “Activation of Selenate by Adenosine 5’-Triphosphate Sulfurylase from Saccharmoyces Cereviseae,” Biochemical Journal, Vol. 163, No. 3, 1977, pp. 521-529.
- T. J. McCluskey, A. R. Scarf and W. Anderson, “Enzyme-Catalyzed αβ-Elimination of Selenocystathionine and Selenocystine and Their Sulfur Isologues by Plant Extracts,” Phytochemistry, Vol. 25, No. 9, 1986, pp. 2063-2068. doi:10.1016/0031-9422(86)80067-X
- Y. Gavel and G. V. Heijne, “A Conserved Cleavage-Site Motif in Chloroplast Transit Peptides,” FEBS Letters, Vol. 261, No. 2, 1990, pp. 455-458. doi:10.1016/0014-5793(90)80614-O
- F. Renosto, H. C. Patel, R. L. Martin, C. Thomassian, G. Zimmerman and I. H. Segel, “ATP Sulfurylase from Higher Plants: Kinetic and Structural Characterization of the Chloroplast and Cytosol Enzymes from Spinach Leaf,” Archives of Biochemistry, Biophysics, Vol. 307, No. 2, 1993, pp. 272-285. doi:10.1006/abbi.1993.1590
- A. Zayed, C. M. Lytle and N. Terry, “Accumulation and Volatilization of Different Chemical Species of Selenium by Plants,” Planta, Vol. 206, No. 2, 1998, pp. 284-292. doi:10.1007/s004250050402
- D. C. Eustice, I. Foster and F. J. Kull, “In Vitro Incorporation of Selenomethionine into Protein by Vigna Radiata Polysomes,” Plant Physiology, Vol. 66, No. 1, 1980, pp. 182-186. doi:10.1104/pp.66.1.182