Advances in Computed Tomography
Vol.2 No.2(2013), Article ID:33345,8 pages DOI:10.4236/act.2013.22011
Association of Renal Volume with the Degree of Aortic Contrast Enhancement in Abdominal CT
1Department of Diagnostic Radiology, Hokkaido University Hospital, Sapporo, Japan
2Faculty of Health Science, Hokkaido University, Sapporo, Japan
3Department of Clinical Support for Medical Practice, Hokkaido University Hospital, Sapporo, Japan
4Department of Radiation Medicine, Hokkaido University Graduate School of Medicine, Sapporo, Japan
5Department of Radiology, University of Pittsburgh School of Medicine, Pittsburgh, USA
Email: ktamotamo2@yahoo.co.jp
Copyright © 2013 Natalia S. Muto et al. This is an open access article distributed under the Creative Commons Attribution License, which permits unrestricted use, distribution, and reproduction in any medium, provided the original work is properly cited.
Received November 28, 2012; revised January 2, 2013; accepted January 12, 2013
Keywords: Dynamic CT; Renal Volumetry; Contrast Enhancement; Contrast Material Dose
ABSTRACT
To assess the correlation of renal volume measured on CT with aortic contrast enhancement on the hepatic arterial phase of dynamic CT, 64 consecutive patients (34 men, 30 women) were retrospectively examined. Renal volumes were measured on CT. The aortic contrast enhancement was inversely correlated with renal medullary volume (r = −0.52, p < 0.0001), and renal cortical volume (r = −0.3, p = 0.02). Renal volume may have inverse correlation with aortic contrast enhancement on the hepatic arterial phase of dynamic CT. This might call for adjustment of contrast material dose based in part on renal volume in the future.
1. Introduction
Multiphasic computed tomography (CT) of the liver, including the hepatic arterial phase has played a fundamental role in detecting and differentiating hepatic tumors such as hepatocellular carcinoma and metastatic hypervascular tumors [1]. In the interest of performing highquality studies that optimize assessment of hepatic lesions while minimizing cost, a tailored approach to intravenous administration of contrast material is desirable. Contrast enhancement at CT is affected by numerous interacting factors [2-5]. These factors may be divided into three categories: patient, contrast medium, and CT scanning [6]. Among patient related factors, the most important one affecting the magnitude of vascular and parenchymal contrast enhancement is body weight [7-11]. This effect can be best described on the basis of the association of the body weight with the blood volume. Because large patients have larger blood volumes than small patients, contrast medium administered into the blood compartment dilutes more in a large patient than in a small patient. The result is a reduced iodine concentration in the blood and lower contrast enhancement [12]. In consideration of the other patient related factors affecting the magnitude of vascular and parenchymal contrast enhancement, the kidney may be the organ to be investigated, because it is a highly vascular organ composing an important part of the blood vessel volume of the body [13]. Also, the renal blood flow represents one important regulatory system with the cardiac output [14], which is also known to have association with the degree of contrast enhancement effect of the vessels and vascular organs [2]. In addition, renal medulla, although it is not as vascular as renal cortex, is directly related with contrast material excretion from the blood pool. Since the renal volume and function are part of this system, these may represent another important factors influencing contrast enhancement in addition to body weight. Therefore, in this study, we aimed to assess the correlation of renal volume (renal cortical volume, renal medullary volume, and total renal volume) and function with aortic contrast enhancement on hepatic arterial phase of dynamic CT. Total renal volume was measured using unenhanced CT data as well as enhanced CT data, so that we can examine the hypothesis that renal volume estimated using unenhanced CT data can be used for determination of contrast dose in dynamic CT of the liver. Time required to estimate the renal volume using different volumetry methods was also compared.
2. Materials and Methods
2.1. Patients
From October to December 2007, sixty-four consecutive patients (34 men, 30 women), with age ranging from 19 to 79 years old, average 58.5 ± 13.9 standard deviation (SD), were evaluated in this study. Patients were scanned for diagnosis or follow-up of hepatocellular carcinoma, undergoing contrast enhanced dynamic CT of the liver with no relation to renal disease. Patients with known vascular disease, hypertension, diabetes mellitus or renal disease were excluded from the study. Informed consents were waived and the study was approved by the ethics committee of the hospital. The age and body weight (kg) of each patient were recorded at the time of physical examination. We used “non-ionic” iodine contrast material in this study, where we didn’t experience any severe side effect.
2.2. Contrast Material Injection and Scan Protocol
Dynamic CT scans were performed with patients in the supine position. Breath hold CT examinations of the abdomen were performed with a 64-section multi-detector Aquilion 64 Scanner (Toshiba Medical Systems Corporation, Otawara, Tochigi, Japan). The following scan parameters were used: tube current via automatic exposure control; voltage of 120 kV; collimation of 64 × 0.5 mm; reconstructed slice thickness of 5 mm; and reconstruction increment of 5 mm. Scans of the abdomen were performed in the craniocaudal direction with protocol including hepatic arterial and late phase with scan timing adjusted by the bolus tracking system. The dynamic CT was started automatically 20 seconds after the contrast enhancement reached a predefined threshold of 200 HU in the abdominal aorta at the level of the porta hepatis. This phase was determined as hepatic arterial phase. The late phase was adjusted at 180 seconds post initiating contrast injection.
This protocol was achieved using the dosage of contrast material tailored according to the patient’s body weight. The dosage of the contrast material was 450 mgI/kg of body weight of iodine contrast agent. Under these circumstances, the variation caused by different body weights in the degree of contrast enhancement in the aorta can be cancelled [15,16]. It is important to emphasize that the usage of fixed injection duration of 30 seconds in the injection protocol of the present study was selected rather than fixed injection rate to establish an optimal contrast-enhanced dynamic CT protocol of the liver because the injection duration has been considered the most important and the only technical factor capable of predicting the scan timing for each phase [16].
2.3. Image Analysis
Images from the CT scans were transferred to the image viewer equipped with medical display software (Voxbase, J-mac system, Sapporo, Japan) and all attenuation measurements of the abdominal aorta were performed, by a radiologist with more than 15 years of experience in abdominal radiology, at the level of celiac artery branching on the monitor using a circular region-of-interest cursor ranging in size from 10 - 30 mm in diameter to include as much area of the aorta. Measurements were taken on the unenhanced and the hepatic arterial phase, one time for each subject. Contrast enhancement of aorta was calculated as the absolute difference in the attenuation value of abdominal aorta on unenhanced scans and hepatic arterial phase of CT scan, in Hounsfield units (HU).
2.4. Renal Volume Measurement
1) Semi-automated method (contrast enhanced CT)
For the renal volume measurements, the images transferred to the workstation were evaluated using a recently developed contouring program [13]. This software makes an automatic contour of the renal cortex and the renal parenchyma and calculates renal volume in cubic centimeters (cm3). In this study, a CT slice thickness of 5 mm was used and the calculations for renal cortical and total renal volumes were done in cubic centimeters. Renal cortical volume was measured on the hepatic arterial phase (Figure 1(a)) and total renal volume was measured in the late phase (Figure 1(b)). Renal medullary volume was calculated later as the difference between the total renal volume and renal cortical volume. This method was named semi-automated method, which work only on contrast enhanced CT data. All renal volumetry via semiautomated method was performed by a non-radiologist observer. In order to ensure the accuracy of kidney volume measurement applied, a phantom study was performed and the detailed description of the method has been described in the previous article [13].
Two additional methods were used to measure the renal volumes using plain CT data: the ellipsoid method and the manual method.
2) Ellipsoid method (unenhanced CT)
For the ellipsoid method, unenhanced CT images were analyzed using image viewer equipped with medical display software (Vox-base, J-mac system, Sapporo, Japan). Measurements of right and left kidneys were performed by an experienced radiologist and by a non-radiologist physician. Time spent on each kidney was tracked. Width, thickness, and length were measured on the coronal and sagittal images (Figures 1(c) and (d)). The cranio-caudal length was measured from the most superior margin to the most inferior margin of the kidney on coronal or sagittal images. We attempted to make these measurements as perpendicular to each other as possible. After measurements, the right and left renal volumes were calculated with following formula: volume = π/6 × length × width × depth. Total renal volume is the sum of right and left kidney [13].
3) Manual method (unenhanced CT)
On the manual method, the same images used to calculate the renal volume with the ellipsoid method were analyzed (Figure 1(e)). Renal borders were manually delineated using a cursor by an experienced radiology technologist, voxels were counted by the sotware and then renal volume calculated (ZioSystem 1000; Zio Software, Tokyo, Japan). A voxel represents a quantity of 3D data just as a pixel represents a point or cluster of points in 2D data.
2.5. Statistical Analysis
The results were assessed by MedCalc for Windows, version 9.3.9.0 (MedCalc Software, Mariakerke, Belgium) and JMP™ for windows, version JMP9 (SAS Institute Inc., Japan). Correlation coefficient and regression analysis were calculated to evaluate the relationship between renal volumes and aortic contrast enhancement. Pearson’s correlation coefficient was classified as weak (r < 0.3), moderate (0.3 ≤ r < 0.5) or strong (0.5 ≤ r). Statistical significance was considered when p < 0.05 [17]. To ensure the accuracy of ellipsoid and manual methods, both were compared to each other and to the semimethod using the intraclass correlation coefficient (ICC). Bland and Altman plot was made for between the manual and the semi-automated method.
3. Results
Age, anthropometric parameters such as body weight, height, BMI, BSA, as well as eGFR and renal volumes measured by 3 different methods with respective units are shown on Table 1 with range, mean and SD. The aortic attenuation averages were 44.6 ± 4.9 SD on unenhanced phase and 269.5 ± 53.7 SD on hepatic arterial maximum enhancement. The mean contrast enhancement obtained was 222.6 ± 52.8 SD, which represents the difference in attenuation between hepatic arterial maximum enhancement and unenhanced phases in HU. The range (mean ± SD) of injection rate was 570 - 1470 (923 ± 203.2) mgI/s and there was no correlation of the injection rate with contrast-enhancement value (r = −0.09, p = 0.43).
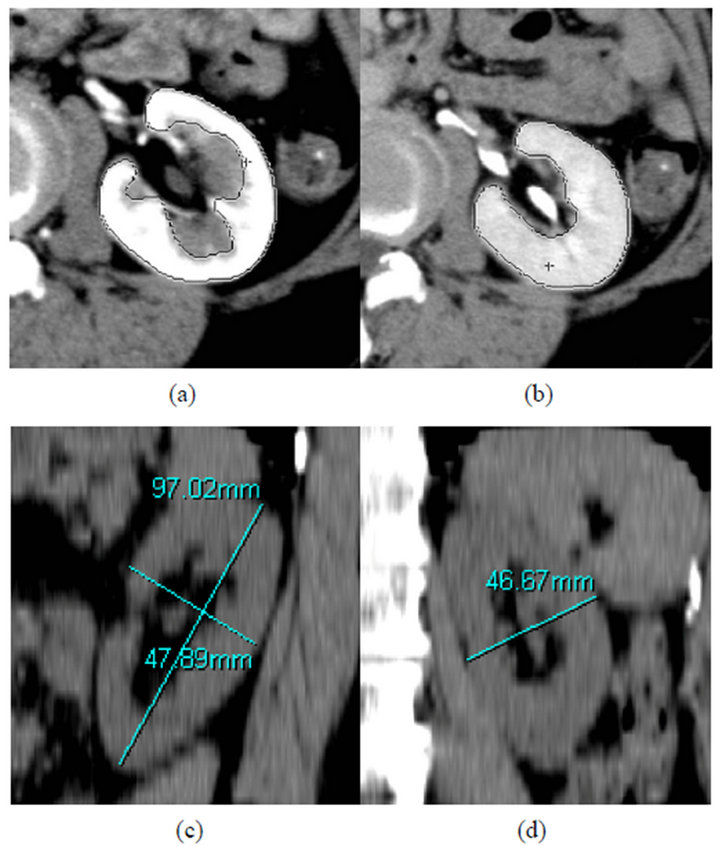
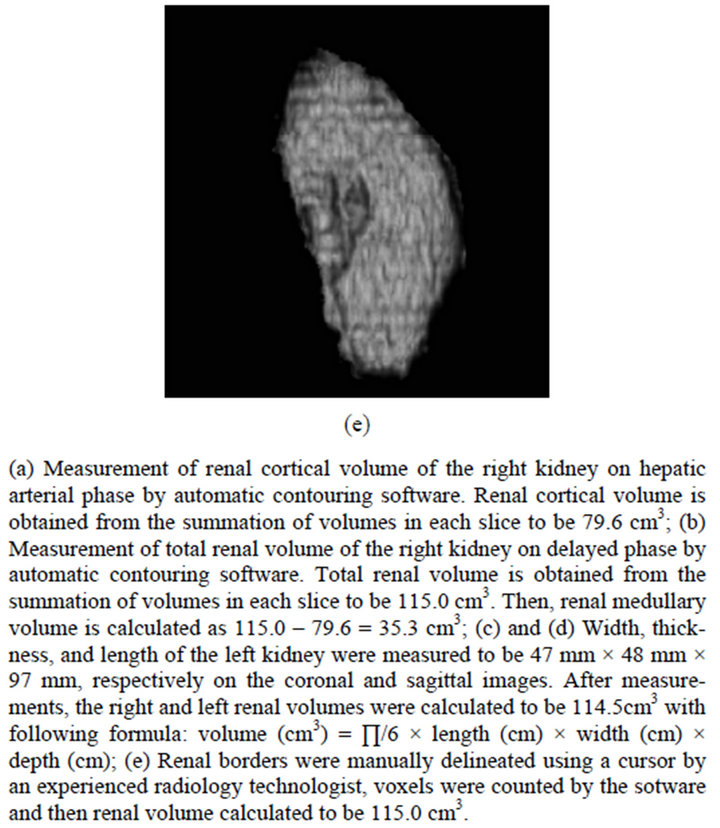
Figure 1. Three different methods of renal volumetry in a 70-year-old female.
In assessing the correlations between age, anthropometric parameters, and renal function and aortic contrast enhancement, height and eGFR presented week correlations with r = −0.2812 (p = 0.0192) and r = −0.2969 (0.0155), respectively. There was no statistically significant correlation between aortic contrast enhancement and age, body weight, BMI and BSA.
Among the renal volumes (total renal. renal cortical, and renal medullary volumes) measured via semi-automated method, renal medullary volume showed the strongest correlation with aortic contrast enhancement (r = −0.52) (Table 1).
As for correlations between total renal volume measured by 3 different methods (the semi-automated, the ellipsoid, and the manual method) and aortic enhancement, all three presented equivalent results of moderate correlations (Table 1). Regression analysis between aortic contrast enhancement and renal volume/function are shown in Figure 2.
To ensure the accuracy of the ellipsoid and the manual methods, both were compared to each other and to the semi-automated method. The ICC between ellipsoid method and manual method was 0.77 (p = 0.83), while the ICC between the manual and semi-automated method was 0.9. And for the comparison between semi-automated and ellipsoid method, ICC was 0.75. This last comparison is shown on Bland and Altman plot (Figure 3). There was a pattern of decreasing accuracy observed on ellipsoid method when renal volumes are larger due to deviation from standard of reference method (semi-automated method) values according to the observation of Blant and Altman plot (Figure 3).
Time spent for renal volume measurement was tracked on manual (observer 1) and ellipsoid methods (observers 2 and 3) for the right kidney. Observer 1 had time ranging from 86 to 328 seconds (159 ± 50.8 SD). Observer 2 had time ranging from 30 to 62 seconds (average of 39 ± 6.7 SD). Observer 3 had time ranging from 52 to 169.5 seconds (average of 71.2 ± 23.4 SD). The comparisons between observer 1 and 2 (p < 0.0001), observers 2 and 3 (p < 0.0001) and observer 1 and 3 (p < 0.0001) were all statistically significant.
We investigated the correlation coefficients between aortic enhancement and renal volume derived from ellipsoid formula setting variable threshold of renal volume. We found the correlation coefficient was maximum at −0.6 (p = 0.005) in the groups with smaller renal volume when we set a threshold at 270 cm3 (Table 2). Then, we calculated the regression analysis between aortic enhancement and renal volume measured by ellipsoid method, represented by the formula: aortic enhancement (HU) = 507.0687 − [1.1686 × total renal volume (Ellipsoid method) (cm3)] (Figure 4).
4. Discussion
In our study, the aortic contrast enhancement on the hepatic arterial phase had a moderate inverse correlation with total renal volume, weak inverse correlation with renal cortical volume and strong inverse correlation with renal medullary volume. This may suggest that renal me-
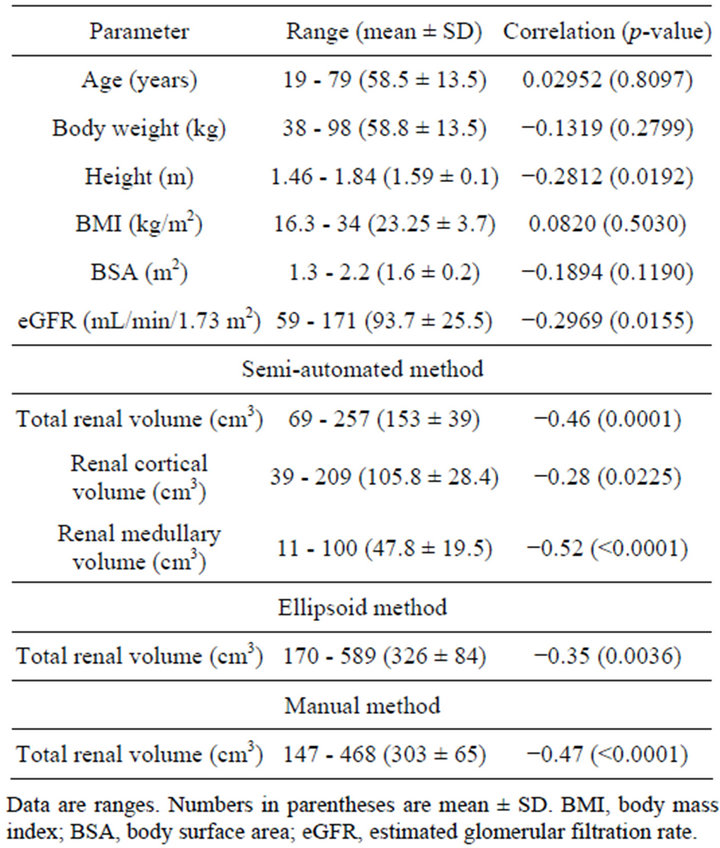
Table 1. Anthropometric parameters, eGFR, and renal volumes measured by 3 different methods and correlation with aortic contrast enhancement on hepatic arterial phase (HU).
dulla serving as an organ to excrete contrast material from blood pool has more impact on decreasing aortic contrast enhancement effect than renal cortex contributing as a diluter of contrast by consisting certain part of vascular compartment.
This result might prompt us to prospectively examine if it is possible to introduce renal volume to adjust contrast dose in dynamic CT of the liver. However, as we obtained this result using renal volume derived from contrast-enhanced CT, we definitely have to confirm if the result is also applicable using the renal volume estimated before contrast administration. Therefore, we needed a method capable of measuring renal volume before contrast-enhanced CT was performed. Then, we firstly adapted the ellipsoid formula, which has been widely used on ultrasound images and applied the same principle on unenhanced CT images, which was called the ellipsoid method in this study. The second method, also on unenhanced CT but with a manual contouring of kidneys borders using volume pixels summation by computer software, was examined, which was called manual method in this study. Both methods were compared to our “standard of reference” method, with measurements on contrast enhanced CT images, which was called semi-automated method in this study. Time spent for ellipsoid method either by inexperienced and experienced observer was shorter than that spent for manual
Table 2. Correlation coefficients between aortic enhancement on the hepatic arterial phase and renal volume measured by ellipsoid formula grouped by variable renal volume threshold.
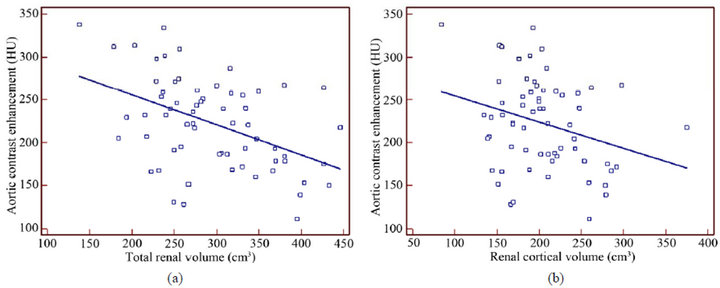
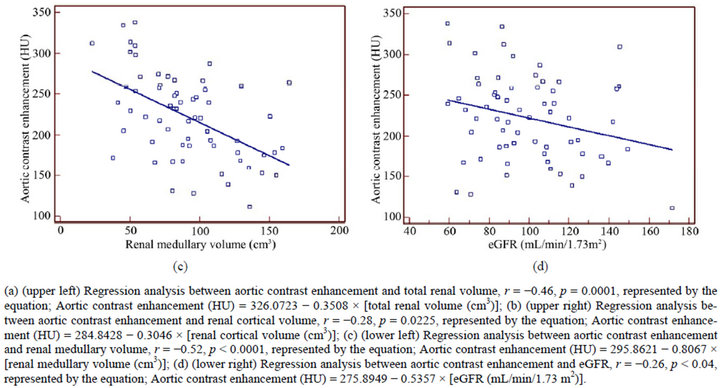
Figure 2. Regression analyses between aortic contrast enhancement and renal volume and function.
method by experienced observer. It is very important in busy daily practice to choose a fast method to maintain the throughput of the examination.
We analyzed the correlation between renal volumes measured by the ellipsoid method and aortic enhancement, according to the different renal volume range. We found that absolute value of correlation coefficient was maximum at 0.6 (p = 0.005) in the groups with smaller renal volume when we set a threshold at 270 cm3. Then, we recalculated the correlation among the patients under
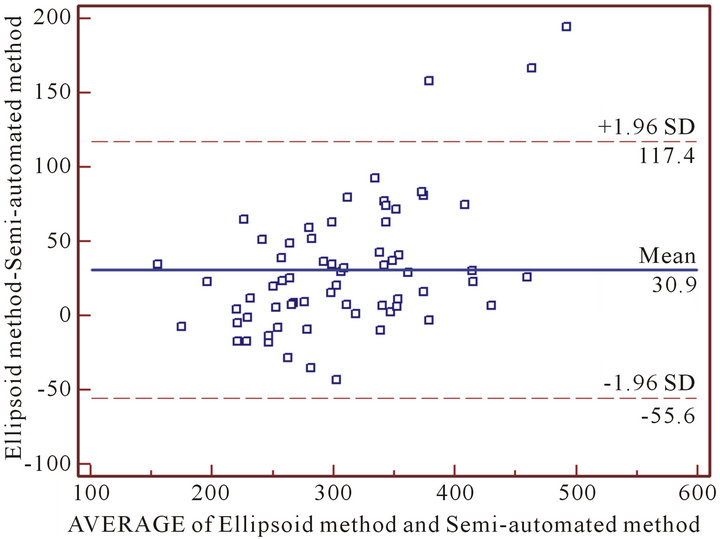
Figure 3. Bland and Altman plot for semi-automated and ellipsoid methods comparison.
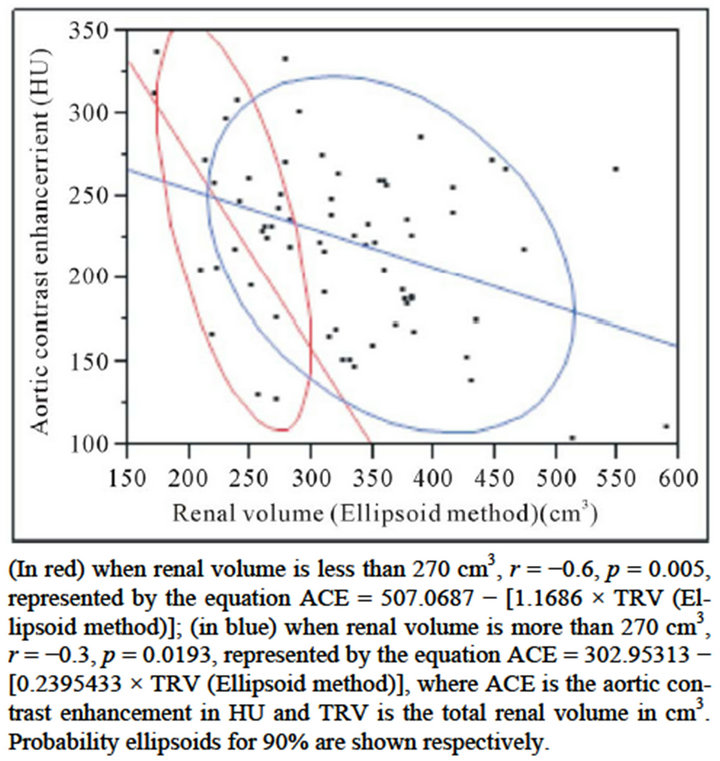
Figure 4. Regression analysis of aortic contrast enhancement and total renal volume measured by ellipsoid method.
this threshold as well as regression analysis and it resulted in a formula representing the variation of renal volume equivalent to that of aortic enhancement. We tried to estimate how much it would correspond to contrast material dose variation.
We used as reference a previous study, where Yanaga et al. divided the patients in three contrast injection protocols, with respective contrast dose of 450, 525 and 600 mgI/kg of body weight [18]. The mean ACEs on HAP were 224.5 ± 50.3, 264.4 ± 47.3 and 291 ± 42.7 HU respectively and the differences between three protocols were statistically significant (p < 0.01). If a linear regression analysis is performed, the dose capable to cause the variation of 1 HU on the ACE on HAP would be 2.226 mgl/kg of body weight, represented by the equation: Contrast dose variation (mgI/kg of body weight) = 2.226 × [aortic contrast enhancement variation (HU)] − 53.675.
Because this study [18] used similar variables to ours (ex. fixed injection duration of 30 seconds and scan timing after contrast administration), we could extrapolate the results and compare the dose of contrast material per body weight capable of producing a variation of 1 HU on the aortic contrast enhancement, based on the correlation of aortic contrast enhancement and total renal volume.
Once the initial dose of contrast material dose is determined based on patient’s body weight (Initial dose: D0 in mgI/kg, which may range from 450 to 600 mgI/kg in our clinical experience), additional adjustments of the dose (D1 in mgI/kg) could be able to reduce patient-topatient enhancement variability without affecting satisfactory aortic contrast enhancement. The resulting dose (D) would be the difference between the initial dose (D0) and the adjusted dose (D1) represented in the formula: D = D0 − D1. Based on Yanaga et al.’s and our results, the adjusted dose (D1) is calculated using aortic contrast enhancement and represented by the fomula: D1 (mgI/kg of body weight) = 2.226 × [aortic contrast enhancement variation (HU)] − 53.675. And for the calculation of aortic contrast enhancement proposed in this study, total renal volume must be obtained in advance, what may be performed on unenhanced CT images. Then, aortic contrast enhancement variation would be calculated through the formula: aortic contrast enhancement variation (HU) = 507.0687 − [1.1686 × total renal volume variation (cm3)].
On a simple estimation, a variation of 100 cm3 of total renal volume would produce a variation of 116.86 HU on aortic contrast enhancement. Comparing this estimation with above, it equals to a variation of 260.13 mgl/kg, which means that an increase of 100 cm3 of the total renal volume would require around 58% more of iodine contrast material dose per body weight used in our protocol (450 mgI/kg). Therefore, we suggest that an estimation of contrast material dose tailored by total renal volume could be performed in order to adapt the ideal amount of contrast material to each patient.
The results of this study might bring a new variable that has not being entirely investigated among the factors influencing contrast enhancement magnitude. This does not have any direct significance in the treatment of hepatocellular carcinoma; however, adequate adjustment of the dose of contrast material might have positive economic effect and reduce risks for nephrotoxicity by reducing excess amount of contrast given to patients. Most of the studies concerning contrast material dose adjustment take into consideration cardiac output, contrast material dose, injection rate, dose concentration and so on, but there have been no report about dose calculation based on the renal volume. However, there is a concern that modification of contrast material dose according to the relationship between aortic contrast enhancement and renal volume may cause inadequate effect on hepatic parenchymal enhancement on later phases. We attached as an appendix to show that renal volume has likewise inverse effect on hepatic parenchymal enhancement on later phase. In order to confirm the application of this study in clinical practice, a prospective study with intravenous contrast material calculated based on renal volume should be performed.
5. Conclusion
In conclusion, renal volume can be rapidly measured by ellipsoid formula on unenhanced CT. Our study demonstrated that renal volume on unenhanced CT may have correlation with aortic enhancement, especially when small kidneys are assessed. This result might be used to customize contrast material dose according to the patient’s individual renal volume in addition to other patient-related factors such as body weight in clinical settings.
6. Acknowledgements
This study was accomplished with a contribution from the FUJIFILM Corporation who provided the new software for renal volume measurements tested and analyzed in this study. Thanks to Kazuo Ito, MD, PhD, Department of Radiology, Keiyukai Sapporo Hospital, Sapporo, Japan for the support in scientific discussions.
REFERENCES
- M. Tsurusaki, K. Sugimoto, M. Fujii and K. Sugimura, “Multi-Detector Row Helical CT of the Liver: Quantitative Assessment of Iodine Concentration of Intravenous Contrast Material on Multiphasic CT—A Prospective Randomized Study,” Radiation Medicine, Vol. 22, No. 4, 2004, pp. 239-245.
- K. T. Bae, J. P. Heiken and J. A. Brink, “Aortic and Hepatic Contrast Medium Enhancement at CT. Part II. Effect of Reduced Cardiac Output in a Porcine Model,” Radiology, Vol. 207, No. 3, 1998, pp. 657-662.
- L. L. Berland, “Slip-Ring and Conventional Dynamic Hepatic CT: Contrast Material and Timing Considerations,” Radiology, Vol. 195, No. 1, 1995, pp. 1-8.
- F. Cademartiri, A. Van der Lugt, G. Luccichenti, P. Pavone and G. P. Krestin, “Parameters Affecting Bolus Geometry in CTA: A Review,” Journal of Computer Assisted Tomography, Vol. 26, No. 4, 2002, pp. 598-607. doi:10.1097/00004728-200207000-00022
- J. K. Han, A. Y. Kim, K. Y. Lee, J. B. Seo, T. K. Kim, B. I. Choi, C. S. Lhee and M. C. Han, “Factors Influencing Vascular and Hepatic Enhancement at CT: Experimental Study on Injection Protocol Using a Canine Model,” Journal of Computer Assisted Tomography, Vol. 24, No. 3, 2000, pp. 400-406. doi:10.1097/00004728-200005000-00008
- K. T. Bae, “Intravenous Contrast Medium Administration and Scan Timing at CT: Considerations and Approaches,” Radiology, Vol. 256, pp. 32-61. doi:10.1148/radiol.10090908
- K. T. Bae, “Peak Contrast Enhancement in CT and MR Angiography: When Does It Occur and Why? Pharmacokinetic Study in a Porcine Model,” Radiology, Vol. 227, 2003, pp. 809-816. doi:10.1148/radiol.2273020102
- J. K. Han, B. I. Choi, A. Y. Kim and S. J. Kim, “Contrast Media in Abdominal Computed Tomography: Optimization of Delivery Methods,” Korean Journal of Radiology, Vol. 2, No. 1, 2001, pp. 28-36. doi:10.3348/kjr.2001.2.1.28
- J. P. Heiken, J. A. Brink, B. L. McClennan, S. S. Sagel, T. M. Crowe and M. V. Gaines, “Dynamic Incremental CT: Effect of Volume and Concentration of Contrast Material and Patient Weight on Hepatic Enhancement,” Radiology, Vol. 195, No. 2, 1995, pp. 353-357.
- M. Kormano, K. Partanen, S. Soimakallio and T. Kivimaki, “Dynamic Contrast Enhancement of the Upper Abdomen: Effect of Contrast Medium and Body Weight,” Investigative Radiology, Vol. 18, No. 4, 1983, pp. 364- 367. doi:10.1097/00004424-198307000-00013
- J. F. Platt, K. A. Reige and J. H. Ellis, “Aortic Enhancement during Abdominal CT Angiography: Correlation with Test Injections, Flow Rates, and Patient Demographics,” American Journal of Roentgenology, Vol. 172, No. 1, 1999, pp. 53-56. doi:10.2214/ajr.172.1.9888738
- K. T. Bae, “Intravenous Contrast Medium Administration and Scan Timing at CT: Considerations and Approaches,” Radiology, Vol. 256, 2010, pp. 32-61. doi:10.1148/radiol.10090908
- N. S. Muto, T. Kamishima, A. A. Harris, F. Kato, Y. Onodera, S. Terae and H. Shirato, “Renal Cortical Volume Measured Using Automatic Contouring Software for Computed Tomography and Its Relationship with BMI, Age and Renal Function,” European Journal of Radiology, Vol. 78, No. 1, 2011, pp. 151-156. doi:10.1016/j.ejrad.2009.10.005
- J. A. Oliver, R. R. Sciacca, J. Pinto and P. J. Cannon, “Participation of the Prostaglandins in the Control of Renal Blood Flow during Acute Reduction of Cardiac Output in the Dog,” Journal of Clinical Investigation, Vol. 67, No. 1, 1981, pp. 229-237. doi:10.1172/JCI110018
- K. Awai, K. Hiraishi and S. Hori, “Effect of Contrast Material Injection Duration and Rate on Aortic Peak Time and Peak Enhancement at Dynamic CT Involving Injection Protocol with Dose Tailored to Patient Weight,” Radiology, Vol. 230, 2004, pp. 142-150. doi:10.1148/radiol.2301021008
- T. Ichikawa, S. M. Erturk and T. Araki, “Multiphasic Contrast-Enhanced Multidetector-Row CT of Liver: Contrast-Enhancement Theory and Practical Scan Protocol with a Combination of Fixed Injection Duration and Patients’ Body-Weight-Tailored Dose of Contrast Material,” European Journal of Radiology, Vol. 58, No. 2, 2006, pp. 165-176. doi:10.1016/j.ejrad.2005.11.037
- W. E. Brant and C. A. Helms, “Fundamentals of Diagnostic Radiology,” Williams & Wilkins, Philadelphia, 2007.
- Y. Yanaga, K. Awai, T. Nakaura, T. Namimoto, S. Oda, Y. Funama and Y. Yamashita, “Optimal Contrast Dose for Depiction of Hypervascular Hepatocellular Carcinoma at Dynamic CT Using 64-MDCT,” American Journal of Roentgenology, Vol. 190, No. 4, 2008, pp. 1003-1009. doi:10.2214/AJR.07.3129
Appendix
Because of the concern that modification of contrast material dose according to the relationship between aortic enhancement on HAP and renal volume may cause inadequate effect on hepatic parenchymal enhancement on later phases, we tried to assess the influence of renal volume on the hepatic contrast enhancement in subjects undergoing late phase CT with contrast material dose tailored by body weight. This is a retrospective study of forty-five consecutive donor candidates (21 men, 24 women) for renal transplantation, mean age of 54.4 ± 11.5 years old. Dynamic CT protocol included arterial and late phase with dose of 450 mgI/kg of iodine. Renal volume was measured semi-automated program. Correlation coefficient and multiple regression analysis were used in the statistical analysis. The results were that total renal volume was (average ± SD) 132.7 ± 25 cm3. Hepatic contrast enhancement on late phase was 38 ± 7.1 HU. Multiple regression analysis showed correlation of hepatic contrast enhancement with total renal volume (r = −0.37, p < 0.05) and with renal medullary volume (r = −0.46, p < 0.05). There was no statistically significant correlation between hepatic enhancement and renal cortical volume (r = −0.22, p = 0.15). Therefore, renal volume presented moderate negative correlation with hepatic contrast enhancement on late phase CT in subjects with normal renal function, indicating that body weight used as the only determinant to contrast material dose calculation may lead to excessive amount in subjects with small kidneys.