Computational Water, Energy, and Environmental Engineering
Vol.06 No.02(2017), Article ID:75105,13 pages
10.4236/cweee.2017.62014
Image Processing System for Air Classification Using Linear Discriminant Analysis
Atsunori Tayaoka1,2*, Eriko Tayaoka1, Tsuyoshi Hirajima2, Keiko Sasaki2
1Department of Electronics & Control Engineering, Kitakyushu National College of Technology, Kitakyushu, Japan
2Department of Earth Resources Engineering, Kyushu University, Fukuoka, Japan

Copyright © 2017 by authors and Scientific Research Publishing Inc.
This work is licensed under the Creative Commons Attribution International License (CC BY 4.0).
http://creativecommons.org/licenses/by/4.0/


Received: February 16, 2017; Accepted: March 28, 2017; Published: March 31, 2017
ABSTRACT
An air classifier is used in the recycling process of covered electric wire in the recycling factories, in which the covered electric wires are crushed, sieved, and classified by the air classifier, which generates wastes. In these factories, operators manually adjust the air flow rate while checking the wastes discharged from the separator outlet. However, the adjustments are basically done by trial and error, and it is difficult to do them appropriately. In this study, we tried to develop the image processing system that calculates the ratio of copper (Cu) product and polyvinyl chloride (PVC) in the wastes as a substitute for the operator’s eyes. Six colors of PVC (white, gray, green, blue, black, and red) were used in the present work. An image consists of foreground and background. An image’s regions of interest are objects (Cu particles) in its foreground. However, the particles having a color similar to the background color are buried in the background. Using the difference of two color backgrounds, we separated particles and background without dependent of background. The Otsu’ thresholding was employed to choose the threshold to maximize the degree of separation of the particles and background. The ratio of Cu to PVC pixels from mixed image was calculated by linear discriminant analysis. The error of PVC pixels resulted in zero, whereas the error of Cu pixels arose to 4.19%. Comparing the numbers of Cu and PVC pixels within the contour, the minority of the object were corrected to the majority of the object. The error of Cu pixels discriminated as PVC incorrectly became zero percent through this correction.
Keywords:
Covered Electric Wire, Air Classification, Recycling, Image Processing, Linear Discriminant Analysis

1. Introduction
Over the past years, several studies have been made on recycling copper from wasted covered wire [1] [2] [3] . The covered electric wires are recycled in recycling factories, in which the covered electric wires are crushed, sieved, and classified by using the air classifier. This recycling process generates wastes which are disposed at some expense. However, since the wastes contain reusable copper (Cu) and polyvinyl chloride (PVC), the extraction of those valuable materials is desired. In these factories, the operator manually adjusts the control parameters of the classifier while observing the wastes discharged from the separator outlet. Normally, however, these adjustments have to be made on a trial and error basis, and hence, are very difficult to perform. Therefore, it is necessary to apply the automatic control in order to improve the performance of the classifier. In addition, there is a growing expectation of the sensor system which is the important element of control technology [4] [5] [6] [7] . Using such sensors, we have studied the improvement of the air classifier [8] [9] . USB camera can be used as a sensor in the air classifier to monitor the mixture ratio of the wastes. Moreover, it is possible to construct the system that controls the separation yield by the installation of USB camera in the air classifier. The system control can be done by transforming the airflow rate with the mixture ratio of the wastes. In this study, we tried to develop the image processing system that calculates the ratio of Cu and PVC in the wastes as a substitute for the operator’s eyes [10] . This image processing method can also be applied to the evaluation of discri- mination results in samples of different colors and is expected to be widely used in the recycling field.
2. Experimental
2.1. Experimental Procedures
A schematic diagram of the experimental setup is illustrated in Figure 1. The experimental setup consists of a sealed inner-circulation type air classifier (Matsuoka Engineering Co. Ltd.), image capturing units with USB cameras, and an image processing unit by PC, which is used for monitoring and control [3] . The air classifier has a vibrating feeder and a centrifugal fan. The mixed Cu-PVC particles were supplied into the classifier by using the vibrating feeder, and the wind in the classifier was generated by the centrifugal fan. The computer sent a set frequency for determining the rotational speed of the fan to the AC servo amplifier (Yaskawa Corp. Junma). The wind generated from the centrifugal fan blew off the light particles into overflow box, and the heavy particles fell into underflow box (see Figure 1). The image capturing unit consists of an USB camera (Logicool Co., Ltd. HD Pro Webcam C920t), dome-like light source (Aitec System Co., Ltd. TD102x20-60W-4), and a constant-current power supply (Aitec System Co., Ltd. TPDC2-2430NCW). USB cameras were placed at the underflow and the overflow boxes, and the images of recovered particles were captured continuously. In this study, pre-processing and discrimination were investigated in order to calculate the ratio of Cu and PVC in the image automatically. The pre-processing consists of background subtraction and background removal. In pre-processing, the object (foreground) is extracted from background.
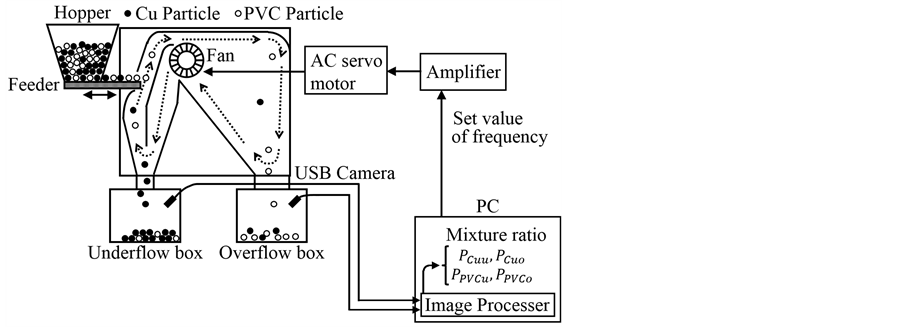
Figure 1. Schematic diagram of the experimental setup.
The discrimination was carried out using linear discriminant analysis. In discrimination, the ratio of Cu and PVC in the wastes was calculated.
2.2. Otsu’s Thresholding
An image histogram plots the number of pixels in the image (vertical axis) with a particular value (horizontal axis). Using the histogram for a specific image, we can observe the entire tonal distribution. In image processing, it is important to select an adequate threshold of gray level for extracting the foreground from their background. Image histograms can be analyzed for peaks and valleys which can be used to determine a threshold value.
Figure 2 shows image histograms for ideal and actual cases. In an ideal case (a), the histogram has a deep and sharp valley between two peaks representing object and background, respectively, so that the threshold can be chosen at the bottom of this valley. However, for most actual pictures (b), it is often difficult to detect the threshold because the valley bottom is fuzzy. Otsu’s thresholding is widely used in order to overcome this difficulty [11] . In this method, the distance of both groups is represented by the degree of separation. In Otsu’s method, we change the candidate threshold from one end to the other to find the best threshold where the degree of separation is maximum. In this study, Otsu’s thresholding was employed to extract the objects from the background.
2.3. Linear Discriminant Analysis
Figure 3 shows the outline of the discrimination analysis. This figure shows an example when two groups are discriminated. Figure 3(a) illustrates the example of discrimination using two feature values,  and
and , independently. Figure 3(b) shows the case of discrimination by the linear discriminant analysis (LDA) [12] [13] [14] [15] . The simplest method of discrimination is the thresholding method. If the feature value
  of sample is greater than or equal to some fixed constant
 , which is thresholding value, this method discriminates the sample to group one. On the other hand, if the feature value
  of sample is less than
 , this method discriminates the sample to group two. The example in

Figure 2. Image histogram.

Figure 3. Linear discriminant analysis.
Figure 3(a) shows that 3 errors occur by using only feature value , while only 1 error occur if using feature value
 . Linear discriminant analysis is used in pattern recognition to separate two or more groups of objects. In LDA, we introduce the new variable Z which combined a feature value of
  and
and  as the following equation:
 , (1)
, (1)
where  and
and  are the standard scores converted from the features
  and
and  to make the scores have a distribution with a mean of zero and a standard deviation of one. These coefficients are obtained by learning using the test image whose correct answer is known. In LDA, if the value of the function Z of the sample is non-negative, the sample is discriminated to group one, otherwise the sample is discriminated to group two. In Figure 3(b), it can be observed that LDA has no error. In this study, the LDA was used to discriminate Cu pixels and PVC pixels from a mixed image.
3. Results and Discussions
Figure 4 shows the weight ratio of each diameter of Cu and PVC in a raw material obtained by sieving. The image shown in Figure 4(a) is a mixture of Cu and PVC particles. The six colors of PVC (i.e., white, gray, green, blue, black,

Figure 4. Sample of crushed covered electric wires.

Figure 5. Histogram of value image with two backgrounds.
and red) were used in this study. It can be observed that the black PVC particle is buried in a black background. In this way, the particles having a color similar to the background color are buried in the background. Therefore, a new method to extract the particles from the background without dependent on the color of objects is proposed in this work. Hereinafter, the method is explained in the case of the black PVC particles. Usually, an image captured by a camera is repre- sented in the RGB color space. In image processing, RGB color space is converted to HSV color space because HSV color space is well suited to the human senses. HSV color space is composed of a hue (H), saturation (S) and value (V). H has a value from 0 to 360, S has a value from 0 to 255, and V has a value from 0 to 255.
Figure 5 shows the histograms of value (V) of black PVC particles (a) with white background and (b) with black background, along with the original images. The horizontal axis represents value, and the vertical axis represents the frequency. In the white background (Figure 5(a)), the black PVC particles can be seen clearly. However, the black PVC particles cannot be seen clearly due to the particles colors buried in the black background (Figure 5(b)). It can be seen that the value distribution of object and background are completely separated in Figure 5(a). The value distribution of the particles was 35 - 70 and the value distribution of the white background was 130 - 160, therefore, the object pixels are easily extracted from the background. In contrast, there is only one value distribution (25 - 60) in Figure 5(b). This result indicates that the value distributions of the black PVC particles and the background overlapped each other, therefore, it is difficult to extract the object pixels from the background. The similar results were obtained from bright or white particles with white or bright background. Based on these results, the discrimination method of particles and background regardless of color of particles was investigated by using two different background colors.
Figure 6 shows a method of obtaining a value difference. The value image with black background is subtracted from the value image with white background to obtain a difference. While the value difference between is relatively large for the background area, the value difference is relatively small for the object area (see Figure 6(a) and Figure 6(b)). Therefore, in the value difference of the two kinds of background images, shown in Figure 6(c), the difference in value of the particles and of the background is large.
Figure 7(a) shows the image of value difference and Figure 7(b) shows its histogram.

Figure 6. Difference between black PVC images with white and with black backgrounds in value.

Figure 7. Image and histogram of value difference.
It can be observed that there are two distribution peaks, the lower distribution (0 to 16) corresponds to the objects of the image, and the upper one (60 to 75) corresponds to the background. There is pronounced gap between the value distributions for the objects and the background, therefore, it is possible to extract objects from background. The Otsu’s method was adopted to find the threshold between two value distributions, and for the image presented in Figure 7, the threshold was 42.
The procedure for background removal is shown in Figure 8. Figure 8(a), which is the image as presented in Figure 6(c), is the value difference image. Figure 8(b) is the result of thresholding by Otsu’s method and Figure 8(c) is the inverted image of Figure 8(b). The inverted image in Figure 8(c) creates a mask image for the background removal, where the object areas value are converted into one (or white), and the background areas value are converted into zero (or black). Figure 8(e) is the product of the original image of black PVC particles and black background (see Figure 8(d)) with the mask image (see Figure 8(c)). Through this procedure, black PVC objects are extracted from black background as shown in Figure 8(e).
Figure 9 shows the value histogram of the removed background image of black PVC particles shown in Figure 8(e).
It can be observed that the foreground and the background are well separated into two value distributions. The value distribution of background was zero and the value distribution of the black PVC objects was distributed from 23 to 69.
Subsequently to the successful of background removal, the discrimination of Cu and PVC particles for the pre-processed images was executed. First, the pixels of Cu particles were set as group one and the pixels of six-color PVC particles were set as group two. Afterwards, the learning for LDA was executed. The learning derived constant terms for Equation (1) and determined the LDA function (Z). Discrimination using the obtained LDA function resulted in large errors, 83.85% for Cu particles and 2.23% for PVC particles. In order to reduce the error, instead of using one LDA learning, the pixels of single-color PVC particles

Figure 8. Background removal of black PVC.

Figure 9. Histogram of black PVC background removed.
were set as group two and six LDA learnings were executed, respectively.
As an example of LDA learning, Figure 10 shows the LDA learning results for pre-processed images of Cu and black PVC particles. LDA learning results for Cu image and black PVC particles images are shown in Figure 10(a) and Figure 10(b), respectively. The following LDA function is obtained from discrimination process:
 , (2)
, (2)
where,  ,
,  , and
, and  are the standard scores converted from the features H, S, and V to make scores have a distribution with a mean of zero and a standard deviation of one. Figure 10(b) shows the pixels were discriminated as Cu correctly, and Figure 10(c) shows the pixels were discriminated as PVC incorrectly. Figure 10(e) shows the pixels was discriminated as PVC correctly, and Figure 10(f) shows the pixels were discriminated as Cu incorrectly. The error of discriminated image was 0.782% and 0.014% for Cu and PVC particles, respectively.
Figure 11 shows the results of LDA learning using Cu and each single-color PVC.
The color of PVC used on each LDA learning is described on the horizontal axis, and the learning error is presented on the vertical axis. The area enclosed with dashed lines corresponds to the results presented in Figure 10. The error varied as the combination of features for LDA function changed. Therefore, all the combinations of the features were tested and the LDA function was selected based on the best combination whose error was minimum. The best combination was shown below the name of PVC color on horizontal axis in Figure 11. The LDA function containing only feature hue (H) minimized the error for white and blue PVC particles. The combined features H and saturation (S) minimized the error for gray PVC particles, and the combination of H, S, and value (V) minimized the error for green, black, and red PVC particles. From Figure 11, it can be observed that the highest error of the pixels of Cu particles (3.976%) was obtained when the pixels were incorrectly discriminated as gray PVC. The pixels of white and red PVC particles were incorrectly discriminated as Cu.
The discrimination between Cu and PVC pixels was carried out for the image

Figure 10. LDA learning results for Cu and black PVC.

Figure 11. LDA learning results for Cu and PVC.
of mixed Cu and six-color PVC particles. The image of mixed Cu and six-color PVC particles is shown in Figure 12(a). The image then pre-processed with the mask image shown in Figure 12(b). The result of pre-processed image is shown in Figure 12(c) in which the image background was removed. The correct discriminated image was created for the image shown in Figure 12(c) by manually setting the correct Cu and PVC pixels using GNU image manipulation program (GIMP). The Cu pixels and PVC pixels are discriminated from the Figure 12(c) by LDA method.
Figure 13 shows the result of linear discrimination analysis. First, LDA function was derived in LDA learning to discriminate the Cu and white PVC particles. Afterwards, the LDA function was applied for the image shown in Figure 12(c). The discriminant analysis was continued by applying LDA function for the discrimination of Cu and gray PVC particles. Consecutively, the LDA functions for green, blue, black, and red PVC particles were applied on the previous pixels discriminated image in similar step as the previous discriminant analysis.
Figure 14 shows the image resulted from each discrimination stage. The black and white pixels show that the pixel was discriminated as Cu and PVC, respectively. It can be observed that the PVC pixels incorrectly discriminated as Cu in

Figure 12. Background removal of mixed PVC.

Figure 13. LDA results in stages for Cu and PVC.
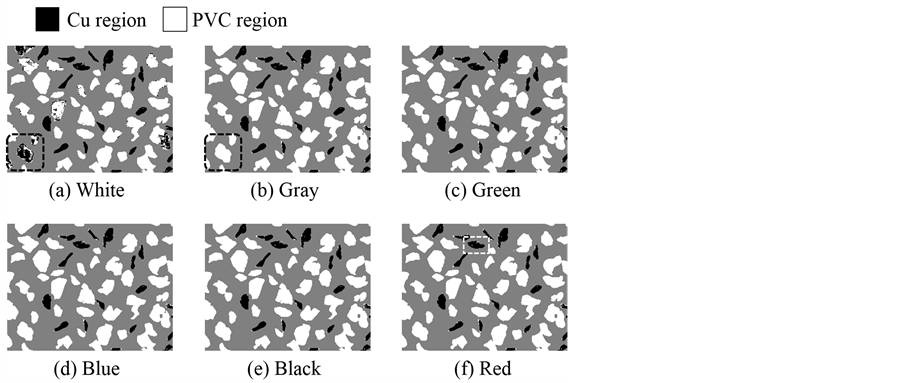
Figure 14. LDA results in stages.
the initial stage was corrected as PVC as the stage progressed. For example, the black-white pixels enclosed with black dashed lines in Figure 14(a) turned into white pixels in Figure 14(b). After the last discrimination using LDA function for red PVC, the error of PVC pixels was zero, whereas the error of Cu pixels increased to 4.190%.
Figure 15(a) shows after LDA results and Figure 15(c) shows after images correction using object contours. The enlarged views of Figure 15(a) and Figure 15(c) are shown in Figure 15(b) and Figure 15(d), respectively. The pixel errors

Figure 15. LDA correction using contour.
after discriminant analysis were then corrected using contours of objects to minimize the error. As shown in Figure 15(b), most of the pixels in the object were correctly discriminated as Cu, however a few pixels were discriminated as PVC. The incorrect discrimination generated 4.2% error of Cu pixels. After the object contours correction, the incorrectly discriminated pixels were corrected to Cu as shown in Figure 15(d). The correction was done by comparing the numbers of Cu and PVC pixels within the object contour. The pixels which is minority within object boundary, in this case the PVC pixels, were converted into the majority pixels within the object boundary, in this case the Cu pixels. The error of Cu pixels became zero through this object contours correction.
4. Conclusion
In this study, we tried to develop the image processing system that calculates the ratio of Copper (Cu) and polyvinyl chloride (PVC) in the wastes as a substitute for the operator’s eyes. PVC consisted of six colors (white, gray, green, blue, black, and red) were used as particle model. By applying the difference of two color backgrounds, the particles and the background image could be separated without depending on the background. The Otsu’s thresholding was employed to select the threshold that maximizes the degree of particle-background separation. The ratio of Cu and PVC pixels was calculated from the mixed image by leaner discriminant analysis. The error of PVC pixels resulted in zero, whereas the error of Cu pixels increased to 4.19%. By using the contours of particles, the incorrect pixel discriminants were corrected. By comparing the numbers of Cu and PVC pixels within the particle contours, the PVC pixels, which was the minority of the object, were corrected into the Cu pixels, which was the majority of the object. The error of Cu pixels became zero through this object contours correction. Therefore, with this image processing system using linear discriminant analysis, it becomes possible to evaluate the discrimination result of air classification of copper and PVC which the operator has done so far, and it can be used for wind power control in air classification. Though discrimination between Cu and fixed six colors PVC was made in this experiment, when a new color sample appears, it can be dealt with by relearning with the sample. This image pro- cessing method can also be applied to the evaluation of discrimination results in samples of different colors, such as PET and labels, and is expected to be widely used in the recycling field.
Acknowledgements
This work was supported by a Grant-in-Aid for Science Research (JSPS KAKENHI Grant No. 16K14523) from the Japan Society for the Promotion of Science (JSPS).
Cite this paper
Tayaoka, A., Ta- yaoka, E., Hirajima, T. and Sasaki, K. (2017) Image Processing System for Air Classification Using Linear Discriminant Analysis. Computational Water, Energy, and Environ- mental Engineering, 6, 192-204. https://doi.org/10.4236/cweee.2017.62014
References
- 1. Kapur, J.N., Sahoo, P.K. and Wong, A.K.C. (1985) A New Method for Gray-Level Picture Thresholding Using the Entropy of the Histogram. Computer Vision, Graphics, and Image Processing, 29, 273-285.
https://doi.org/10.1016/0734-189X(85)90125-2 - 2. Park, C., Subasinghe, N. and Jeon, H. (2015) Separation of Covering Plastics from Particulate Copper in Cable Wastes by Induction Electrostatic Separation. Materials Transactions, 56, 1140-1143.
https://doi.org/10.2320/matertrans.M2015138 - 3. Tayaoka, A., Nagao, S., Hirajima, T. and Sasaki, K. (2009) Recovery of Cu and PVC from the Tailings of Covered Electric Wire Using the Air Classification. Proceedings of International Symposium on Earth Science and Technology, December 2009, 555-558.
- 4. Koyanaka, S. (2013) Recent Trends of Sensor Based Sorting Technology in Resources Recycling. Journal of MMIJ, 129, 615-625.
https://doi.org/10.2473/journalofmmij.129.615 - 5. Bonifazi, G., Serranti, S., Volpe, F. and Zuco, R. (2001) Characterisation of Flotation Froth Colour and Structure by Machine Vision. Computers & Geosciences, 27, 1111-1117.
https://doi.org/10.1016/S0098-3004(00)00152-7 - 6. Ri, S., Numayama, T., Saka, M., Nanbara, K. and Kobayashi, D. (2012) Noncontact Deflection Distribution Measurement for Large-Scale Structures by Advanced Image Processing Technique. Materials Transactions, 53, 323-329.
https://doi.org/10.2320/matertrans.I-M2011852 - 7. Supriadi, S., Fukushima, T. and Manabe, K. (2012) Real-Time Process Control System of Dieless Tube Drawing with an Image Processing Approach. Materials Transactions, 53, 862-869.
https://doi.org/10.2320/matertrans.MF201118 - 8. Tayaoka, A., Kuwata, M., Hirajima, T. and Sasaki, K. (2010) Identification of Air Classifier Using AE Sensor. Proceedings of International Symposium on Earth Science and Technology, December 2010, 189-192.
- 9. Tayaoka, A., Kuwata, M., Hirajima, T. and Sasaki, K. (2011) Improvement of Control System of Air Classification Using AE Sensor. Proceedings of International Symposium on East Asian Resources Recycling Technology, November 2011, 776-779.
- 10. Tayaoka, A., Tayaoka, E., Hirajima, T. and Sasaki, K. (2013) Development of Image Processing System for Air Classification. Proceedings of International Symposium on East Asian Resources Recycling Technology, November 2013, 452-455.
- 11. Otsu, N. (1979) A Threshold Selection Method from Gray-Level Histograms. IEEE Transaction on Systems, Man, and Cybernetics, 9, 62-66.
https://doi.org/10.1109/TSMC.1979.4310076 - 12. Baba, N., Kobayashi, K. and Shinozaki, T. (2006) Indicators for Risk Assessment of Deteriorated Reservoir Break/Washout by Applying Multivariate Analysis. Journal of the Agricultural Engineering Society, Japan, 74, 329-334.
- 13. Xu, Y., Yang, J. and Jin, Z. (2004) A Novel Method for Fisher Discriminant Analysis. Pattern Recognition, 37, 381-384.
https://doi.org/10.1016/S0031-3203(03)00232-2 - 14. Novell, C.G., Marin, D.P., Amigo, J.M., Novales, J.F., Guerrero, J.E. and Varo, A.G. (2012) Grading and Color Evolution of Apples Using RGB and Hyperspectral Imaging Vision Cameras. Journal of Food Engineering, 113, 281-288.
https://doi.org/10.1016/j.jfoodeng.2012.05.038 - 15. Tayaoka, A., Tayaoka, E., Hirajima, T. and Sasaki, K. (2016) Classification of the Waste Fluorescent Lamps Using Signal Processing and Discriminant Analysis. Journal of MMIJ, 132, 53-58.
https://doi.org/10.2473/journalofmmij.132.53