Pharmacology & Pharmacy
Vol.5 No.1(2014), Article ID:41741,5 pages DOI:10.4236/pp.2014.51004
The Adenosine Receptor Agonist 5’-N-Ethylcarboxamide-Adenosine Increases Glucose 6-Phosphatase Expression and Gluconeogenesis
![]()
Faculty of Nutrition, Kobe Gakuin University, Kobe, Japan.
Email: *sfsakata@nutr.kobegakuin.ac.jp
Received November 1st, 2013; revised December 6th, 2013; accepted December 16th, 2013
ABSTRACT
Intraperitoneal administration of the non-selective adenosine receptor agonist 5’-N-ethylcarboxamide-adenosine (NECA) (0.1 or 0.3 mg/kg) increased fasting serum glucose levels in mice. To clarify the mechanism responsible for this, the expression of liver glucose 6-phosphatase (G6Pase: a gluconeogenic enzyme) was analyzed, and it was found that G6Pase mRNA was increased by NECA treatment. Administration of 0.3 mg/kg NECA resulted in elevated serum glucose levels at 1 h and were further elevated at 6 h. Administration of 0.1 mg/kg NECA increased serum glucose levels at 1 h and had returned to control levels by 6 h. The increase in fasting serum glucose levels induced by NECA are thought to be caused, in part, by elevated G6Pase expression.
Keywords:5’-N-Ethylcarboxamide-Adenosine; Glucose 6-Phosphatase; Gluconeogenesis
1. Introduction
Adenosine receptor blockade has been linked to the reversal of insulin resistance [1]. Adenosine is an important metabolite that is released from cells following cellular insults or inflammation. Basal adenosine levels in interstitial fluid are normally between 30 and 300 nM, and increase 10-fold during hypoxia and 100- to 1000-fold during ischemia [2,3]. Extracellular adenosine is able to bind to four different receptor subtypes. The A1 and A3 receptors mediate the inhibition of adenylatecyclase (AC), while the A2a and A2b receptors stimulate AC [2,4]. In general, the A1, A2a and A3 receptors have a high affinity for adenosine, while A2b has a low affinity for adenosine [2]. The A2b receptor is expected to be stimulated only when adenosine levels are highly elevated [2]. Adenosine plays roles in a variety of processes such as inflammation and immune responses via A2-type receptors [5,6]. In addition to the regulation of inflammation, adenosine and adenosine receptors have been found to be involved in glucose homeostasis [7,8]. Adenosine contributes to cyclic AMP (cAMP) production and glycogenolysis in rat hepatocytes through the A2b receptor [9]. The treatment of mice with the non-selective adenosine receptor agonist 5’-N-ethylcarboxamide-adenosine (NECA) increases fasting blood glucose levels and slows glucose clearance, according to glucose tolerance tests [7]. Consistent with expectations, these responses were inhibited by deletion of the A2b receptor [7]. While adenosine receptors are involved in NECA-induced insulin resistance during feeding [7,10], there are no reports describing the effects of NECA on gluconeogenesis during fasting.
In our previous study, we found that in fasting mice treated with NECA for 6 h, serum glucose levels increased and serum alanine levels decreased [11]. Glucose is produced by the glucose-alanine cycle, and because serum alanine levels are decreased by NECA, it is thought that NECA stimulates gluconeogenesis. In this study, to clarify the mechanism by which NECA increases serum glucose levels in fasting mice, NECAinduced alterations in liver glucose 6-phosphatase (G6Pase: a gluconeogenic enzyme) expression were analyzed and compared with the effects of NECA on serum glucose levels.
2. Materials and Methods
2.1. Reagents
All reagents were of analytical grade and were purchased from NacalaiTesque Ltd. (Kyoto, Japan), unless otherwise stated. 5’-N-ethylcarboxamide-adenosine (NECA) was purchased from Sigma-Aldrich Co. (Tokyo, Japan). [α-32P]dCTP was purchased from PerkinElmer Japan Co., Ltd (Yokohama, Japan).
2.2. Animals and NECA Treatment
Male mice (ddY strain, 4-week-old, 20 - 25 g) were purchased from Japan SLC and maintained for a 1-week acclimation period prior to the start of the experiments under the following conditions: laboratory food (MF, Oriental Yeast Co., Ltd., Japan), water provided ad libitum, under a 12 hr light:dark cycle (8:00 to 20:00 light/20:00 to 8:00 dark). In all experiments, food was withheld from the animals starting at 18:00 for 16 h prior to the administration of NECA. The NECA doses chosen were based on the findings of previous studies [7,12]. In experiment 1, after the fasting period, mice were intraperitoneally (i.p.) administered NECA (0.1 mg/kg in 1 mL saline/100g body weight: NECA0.1 group) and their blood and livers were collected 1 h later. Blood was obtained under ether anesthesia, and allowed to clot for 15 min at room temperature and for a further 30 min at 4˚C. Serum was then prepared by centrifugation at 5,000 rpm for 10 min and stored at −80˚C until used for analysis. Tissue samples were collected, immediately frozen in liquid nitrogen, and stored at −80˚C until analysis. In experiments 2 and 3, mice were administered (i.p.) NECA (0.1 mg/kg in 1 mL saline/100g body weight: NECA0.1 group) and their blood and livers were collected 3 or 6 h later. In experiment 4, 5 and 6, mice were administered (i.p.) NECA (0.3 mg/kg in 1 mL saline/100g body weight: NECA0.3 group) and their blood and livers were collected 1, 3 or 6 h later. In all experiments, the control mice were administered an equivalent volume of saline (1 mL saline per 100 g body weight). All procedures were performed in accordance with the Kobe Gakuin University Guidelines for the Care and Use of Laboratory Animals, based on the Act on Welfare and Management of Animals.
2.3. Northern Hybridization
Total RNA was extracted using the acid guanidine thiocyanate-phenol-chloroform method [13]. Details of the northern hybridization procedure have been previously described [14]. A glucose 6-phosphatase (G6Pase) cDNA fragment spanning nucleotides 164 to 819 of the mouse mRNA sequence (GenBank accession No. U00445) was used as a probe. After hybridization, membranes were washed and autoradiography performed with Fuji RX film at −70˚C using intensifying screens. The expression of G6Pase mRNA was quantified using an imaging analyzer (FLA 2000, Fuji Film Co., Ltd., Japan).
2.4. Other Analytical Methods
Serum glucose levels were measured using the glucose C2 test (Wako Pure Chemicals, Japan), serum corticosterone levels were determined using a YK240 corticosterone EIA kit (Yanaihara, Japan), and liver glycogen levels were assessed using the phenol-sulfuric acid reaction [15].
2.5. Statistical Analysis
Data are expressed as the mean ± SE. The unpaired Student’s t-test was used to assess differences between group means. All statistical analyses were performed using the statistical software package Prism (Ver. 4.0, GraphPad Software, Inc., USA).
3. Results and Discussion
As shown in Figure 1, administering a low dose of NECA (NECA0.1 group) induced a significant increase in serum glucose levels compared to the control group at 1 h (Experiment 1). At 3 h, serum glucose levels were also significantly elevated (Experiment 2), while at 6 h, glucose levels were not different from the control group (Experiment 3). Administration of a high dose of NECA (NECA0.3 group) resulted in serum glucose levels that were significantly higher than the control group at 1 h, 3 h, and 6 h (Experiments 4, 5 and 6).
G6Pase is a liver-specific gluconeogenic enzyme. As shown in Figure 2, administration of a low dose of NECA caused significant increases in G6Pase mRNA expression compared to control at 1 and 3 h (Experiments 1 and 2). However, G6Pase expression returned to control levels by 6 h (Experiment 3). High dose NECA administration resulted in significantly elevated G6Pase expression that persisted throughout the 6 h duration of the experiment (Experiment 4, 5 and 6).
One hour after NECA administration, the concentration of liver glycogen in the NECA0.1 and NECA0.3 groups had decreased to below the detection limit of the assay. To determine the stress levels of the NECA treated mice, serum corticosterone concentrations were measured. It was found that serum corticosterone levels in the
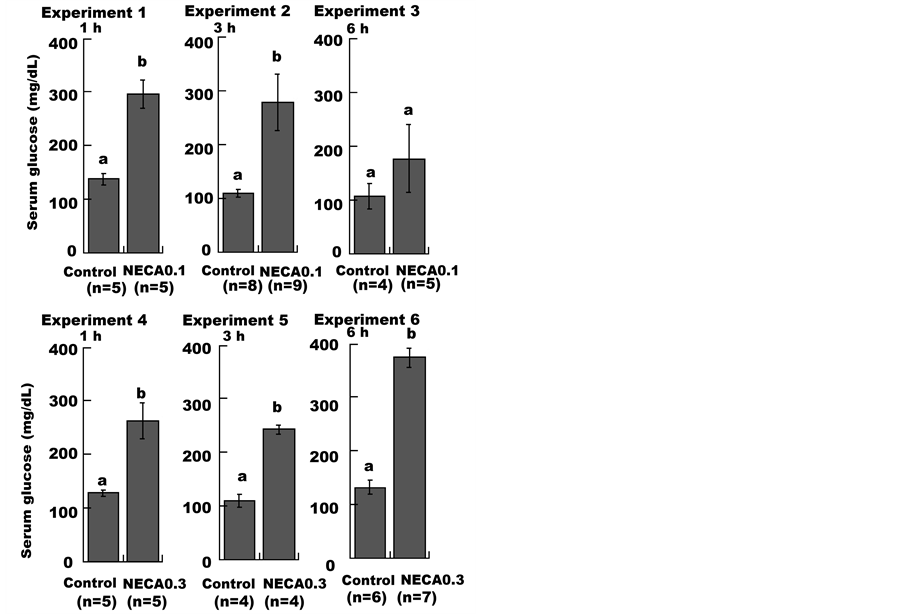
Figure 1. Effect of NECA on the serum glucose level in mice. Mice were administered (i.p.) saline (1 mL/100g body weight; Control), 0.1 mg/kg or 0.3 mg/kg NECA. Each data point represents the mean ± SE. Unpaired Student’s t-tests were used to compare the NECA-treated groups with the control groups. Values without a common lowercase letter are significantly different (p < 0.05).
NECA0.1 and NECA0.3 groups did not differ from those of the control groups (Table 1).
Serum glucose levels are maintained through a balance of dietary intake, hepatic release resulting from glycogen degradation, gluconeogenesis, and the peripheral clearance of glucose from other tissues. The activation of adenosine A2 receptors increases cAMP levels, which are thought to mediate NECA-induced increases in serum glucose levels [7] because increases in cAMP production activate glycogen degradation [16]. However, in this study, the amount of glycogen in the liver 1 h after NECA administration was below the detection limit of the assay. The increase in serum glucose levels occurring 3 to 6 h after NECA administration was not due to the degradation of glycogen because glycogen stores had been depleted by 1 h after NECA administration (Table 1). Hepatic expression of G6Pase was increased 1 h after NECA administration and exhibited a post-NECA treatment time-course similar to that of serum glucose (Figures 1 and 2). In addition, serum alanine levels were reduced in 22 h-fasting mice, and further decreased in
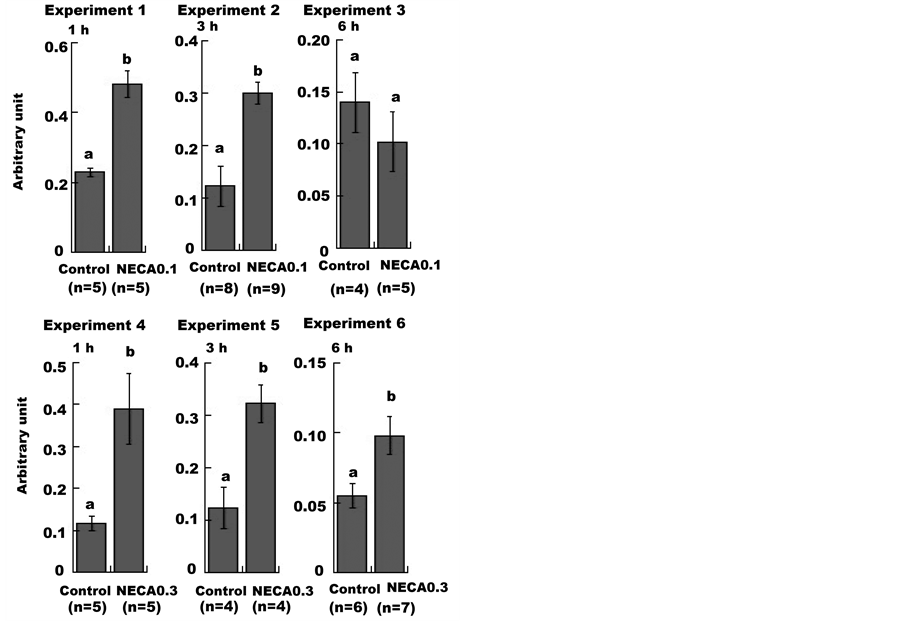
Figure 2. Effect of NECA on glucose 6-phosphatase mRNA expression in mouse liver. Mice were administered (i.p.) saline (1 mL/100g body weight; Control), 0.1 mg/kg or 0.3 mg/kg NECA. Northern hybridization was performed using liver RNA samples. The mean ± SE values of the ratio of the G6Pase mRNA level to that of 18S rRNA are shown in arbitrary units. Unpaired Student’s t-tests were used to compare the NECA-treated groups with the control groups. Values without a common lowercase letter are significantly different (p < 0.05).

Table 1. The content of the liver glycogen and the serum corticosterone in the mouse treated by NECA for 1 h.
The data are presented as mean ± SE. Unpaired Student’s t-tests were used to compare the NECA-treated groups to the control groups. Values with a common lowercase letter are not significantly different (p < 0.05). The mark “-” indicates that the amounts below the detection limit of the assay.
NECA-treated mice; serum branched-chain amino acid levels increased in 22 h-fasting mice and were further increased in NECA-treated mice [9]. This may be an indication of elevated gluconeogenesis from alanine sources supplied by liver protein degradation. This is due to the transamination of the majority of amino acids taking place largely in the liver, except for the three branched-chain amino acids (leucine, isoleucine, and valine), which are transaminated mainly in skeletal muscle [17]. Measurement of G6Pase enzymatic activity in crude liver extract is difficult due to the presence of non-specific phosphatases in the liver. However, according to the reasons stated above, the increase in serum glucose levels observed 3 to 6 h after the NECA administration were thought to have been caused by elevated G6Pase expression.
G6Pase expression is induced by glucocorticoids [18]. Therefore, the serum concentration of corticosterone, the major glucocorticoid in rodents [19], was measured to determine if NECA administration would cause stress in the animals, thereby leading to elevated glucocorticoid levels. However, serum corticosterone levels in the NECA0.1 and NECA0.3 groups were similar to those of their respective control groups 1 h after NECA administration (Table 1).
Thus, glucocorticoids were not involved in increasing G6Pase expression following NECA administration. Rather, a direct result of adenosine receptor activation is the likely cause. Further experiments are needed to clarify the effect of adenosine on G6Pase expression.
REFERENCES
- R. A. Challis, L. Budohoski, B. McManus and E. A. Newsholme, “Effects of an Adenosine-Receptor Antagonist on Insulin-Resistance in Soleus Muscle from Obese Zucker Rats,” Biochemical Journal, Vol. 221, No. 3, 1984, pp. 915-917.
- B. B. Fredholm, E. Irenius, B. Kull and G. Schulte, “Comparison of the Potency of Adenosine as an Agonist at Human Adenosine Receptors Expressed in Chinese Hamster Ovary Cells,” Biochemical Pharmacology, Vol. 61, No. 4, 2001, pp. 443-448. http://dx.doi.org/10.1016/S0006-2952(00)00570-0
- H. Hagberg, P. Andersson, J. Lacarewicz, I. Jacobson, S. Butcher and M. Sandberg, “Extracellular Adenosine, Inosine, Hypoxanthine, and Xanthine in Relation to Tissue Nucleotides and Purines in Rat Striatum during Transient Ischemia,” Journal of Neurochemistry, Vol. 49, No. 1, 1987, pp. 227-231. http://dx.doi.org/10.1111/j.1471-4159.1987.tb03419.x
- B. B. Fredholm, A. P. Ijzerman, K. A. Jacobson, K.-N Klotz and J. Linden, “International Union of Pharmacology. XXV. Nomenclature and Classification of Adenosine Receptors,” Pharmacological Reviews, Vol. 53, No. 4, 2001, pp. 527-552.
- C. St. Hilaire, S. H. Carroll, H. Chen and K. Ravid, “Mechanisms of Induction of Adenosine Receptor Genes and Its Functional Significance,” Journal of Cellular Physiology, Vol. 218, No. 1, 2009, pp. 35-44. http://dx.doi.org/10.1002/jcp.21579
- M. R. Blackburn, C. O. Vance, E. Morschl and C. N. Wilson, “Adenosine Receptors and Inflammation,” Handbook of Experimental Pharmacology, Vol. 193, 2009, pp. 215-269.
- R. A. Figler, G. Wang, S. Srinivasan, D. Y. Jung, Z. Zhang, J. S. Pankow, K. Ravid, B. Fredholm, C. C. Hedrick, S. S. Rich, J. K. Kim, K. F. LaNoue and J. Linden, “Links between Insulin Resistance, Adenosine A2B Receptors, and Inflammatory Markers in Mice and Humans,” Diabetes, Vol. 60, No. 2, 2011, pp. 669-679. http://dx.doi.org/10.2337/db10-1070
- H. Johnston-Cox, M. Koupenova, D. Yang, B. Corkey, N. Gokce, M. G. Farb, N. LeBrasseur and K. Ravid, “The A2b Adenosine Receptor Modulates Glucose Homeostasis and Obesity,” PLoS One, Vol. 7, No. 7, 2012, Article ID: e40584. http://dx.doi.org/10.1371/journal.pone.0040584
- N. Yasuda, T. Inoue, T. Horizoe, K. Nagata, H. Minami, T. Kawata, Y. Hoshino, H. Harada, S. Yoshikawa, O. Asano, J. Nagaoka, M. Murakami, S. Abe, S. Kobayashi and I. Tanaka, “Functional Characterization of the Adenosine Receptor Contributing to Glycogenolysis and Gluconeogenesis in Rat Hepatocytes,” European Journal of Pharmacology, Vol. 459, No. 2-3, 2003, pp. 159-166. http://dx.doi.org/10.1016/S0014-2999(02)02832-7
- C. A. Lalli, J. R. Pauli, P. O. Prada, D. E. Cintra, E. R. Ropelle, L. A. Velloso and M. J. Saad, “Statin Modulates Insulin Signaling and Insulin Resistance in Liver and Muscle of Rats Fed a High-fat Diet,” Metabolism, Vol. 57, No. 1, 2008, pp. 57-65. http://dx.doi.org/10.1016/j.metabol.2007.07.021
- S. F. Sakata, M. Fujino, K. Matsuda, M. Maeda, H. Ohira, K. Kawasaki and N. Tamaki, “Mechanism of Liver Tyrosine Aminotransferase Increase in Ethanol-Treated Mice and Its Effect on Serum Tyrosine Level,” Journal of Nutritional Science and Vitaminology, Vol. 53, No. 6, 2007, pp. 489-495. http://dx.doi.org/10.3177/jnsv.53.489
- M. Sharifzadeh, M. R. Zarrindast and M. Samini, “Effects of Adenosine Analogues on Apomorphine-Induced Penile Erection in Rats,” General Pharmacology, Vol. 26, No. 8, 1995, pp. 1785-1790. http://dx.doi.org/10.1016/0306-3623(95)00114-X
- P. Chomczynski and N. Sacchi, “Single-Step Method of RNA Isolation by Acid Guanidinium Thiocyanate-Phenolchloroform Extraction,” Analitical Biochemistry, Vol. 162, No. 1, 1987, pp. 156-159. http://dx.doi.org/10.1016/0003-2697(87)90021-2
- S. F. Sakata, S. Okumura, K. Matsuda, Y. Horikawa, M. Maeda, K. Kawasaki, J. Y. Chou and N. Tamaki, “Effect of Fasting on Methionine Adenosyltransferase Expression and the Methionine Cycle in the Mouse Liver,” Journal of Nutritional Science and Vitaminology, Vol. 51, No. 2, 2005, pp. 118-123. http://dx.doi.org/10.3177/jnsv.51.118
- M. Dubois, K. A. Gilles, J. K. Hamilton, P. A. Rebers and F. Smith, “Colorimetric Method for Determination of Sugars and Related Substances,” Analitical Chemistry, Vol. 28, No. 3, 1956, p. 350. http://dx.doi.org/10.1021/ac60111a017
- H. G. Hers, “The Control of Glycogen Metabolism in the Liver,” Annual Review of Biochemistry, Vol. 45, 1976, pp. 167-189. http://dx.doi.org/10.1146/annurev.bi.45.070176.001123
- J. S. Garrow, W. P. T. James and A. Ralph, “Human Nutrition and Dietetics,” Churchill Livingstone, Edinburgh, 2000, p. 82.
- R. C. Garland, “Induction of Glucose 6-Phosphatase in Cultured Hepatoma Cells by Dexamethasone,” Biochemical Biophysical Research Communications, Vol. 139, No. 3, 1986, pp. 1130-1134. http://dx.doi.org/10.1016/S0006-291X(86)80295-9
- W. M. van Weerden, H. G. Bierings, G. J. van Steenbrugge, F. H. de Jong and F. H. Schroder, “Adrenal Glands of Mouse and Rat Do Not Synthesize Androgens,” Life Science, Vol. 50, No. 12, 1992, pp. 857-861.
NOTES
*Corresponding author.