Advances in Breast Cancer Research
Vol.2 No.2(2013), Article ID:30482,12 pages DOI:10.4236/abcr.2013.22007
Increased Cellular Invasion and Proliferation via Estrogen Receptor after 17-β-Estradiol Treatment in Breast Cancer Cells Using Stable Isotopic Labeling with Amino Acids in Cell Culture (SILAC)
1Department of Cancer Biology, Kimmel Cancer Center, Thomas Jefferson University, Philadelphia, USA
2Department of Biomedical Engineering, Drexel University, Philadelphia, USA
3American Association of Cancer Research, Philadelphia, USA
Email: andrew.quong@jefferson.edu
Copyright © 2013 Alimatou M. Tchafa et al. This is an open access article distributed under the Creative Commons Attribution License, which permits unrestricted use, distribution, and reproduction in any medium, provided the original work is properly cited.
Received January 23, 2013; revised February 26, 2013; accepted March 6, 2013
Keywords: 17-β-Estradiol; Breast Cancer; Estrogen Receptor; Mass Spectrometry; SILAC
ABSTRACT
17-β-estradiol (estrogen) is a steroid hormone important to human development; however, high levels of this molecule are associated with increased risk of breast cancer primarily due to estrogen’s ability to bind and activate the estrogen receptor (ER) and initiate gene transcription. Currently, estrogen mechanisms of action are classified as genomic and non-genomic and occur in an ER-dependent and ER-independent manner. In this study, we examine estrogen signaling pathways, by measuring changes in protein expression as a function of time of exposure to estrogen in both ER-positive (MCF-7) and ER-negative (MDA-MB-231) cell lines. Using a robust experimental design utilizing isotopic labeling, two-dimensional LC-MS, and bioinformatics analysis, we report genomic and non-genomic ER regulated estrogen responsive proteins. We find a little over 200 proteins differentially expressed after estrogen treatment. Cell proliferation, transcription, actin filament capping and cell to cell signaling are significantly enriched in the MCF-7 cell line alone. Translational elongation and proteolysis are enriched in both cell lines. Subsets of the proteins presented in this study are for the first time directly associated with estrogen signaling in mammary carcinoma cells. We find that estrogen affected the expression of proteins involved in numerous processes that are related to tumorigenesis such as increased cellular division and invasion in an ER-dependent manner. Moreover, we identified negative regulation of apoptosis as a non-genomic process of estrogen. This study complements gene expression studies and highlights the need for both genomic and proteomic analyses in unraveling the complex mechanisms by which estrogen affects progression of breast cancer.
1. Introduction
Estrogens are members of the family of steroid hormones that stimulate the development and maintenance of female characteristics and sexual reproduction. 17-β-estradiol (E2) is the most abundant estrogen in the human body [1,2]. Estrogen circulates through the bloodstream and targets organs containing estrogen receptors (ER). Higher levels of estrogen exposure are associated with increased breast cancer risk [3] and the expression of estrogen receptor varies in breast cancer subtypes.
The well established classical pathway of E2 signal transduction is genomic and ERα-dependent. Once E2 binds to ERα located mainly in the cytoplasm, the activated receptor complex moves to the nucleus where it dimerizes and binds to specific DNA sequences called estrogen response elements (ERE) via the DNA binding domain of ER [4]. The activated EREs are able to regulate the expression of specific genes located downstream of the sequence [5] and with the help of other activators, impact transcription of genes involved in cell proliferation and differentiation. The ligand-bound ERα also binds to DNA indirectly through protein-protein interactions with other transcription factors such as AP-1 and Sp1 [6,7].
In addition to activating genomic pathways, E2 has also been shown to activate its receptor present on the cell surface and to participate in the activation of other membrane bound receptors leading to the mitogen-activated protein kinase (MAPK) signaling cascade [8], a process that occurs non-genomically within minutes of stimulation [9]. These non-genomic protein processes occur independently of gene transcription and in the case of E2, are assumed to take place through steroid-induced modulation of membrane-bound regulatory proteins. Estrogen has been linked to additional pathways that are ER-independent such as the regulation of angiotensin II type 1 to activate early cell survival mechanisms [8] and growth inhibition of some ER negative breast cancer cells [10]. In-depth knowledge of these pathways will enable us to better understand estrogen mediated breast cancer.
Several laboratories have studied the effects of E2 using gene expression microarrays, identifying specific genes affected by estrogen [11-21]. While genomic analysis provides valuable information about the transcriptional effects of estrogen, its impact on cell signaling is only inferred by the assumed correlation of gene to protein expression. There is growing evidence however, showing that this relationship is not always correlated [22]. Moreover, the fast non-genomic activity of E2 mentioned above occurs well before transcription, and therefore cannot be detected using gene microarrays. Protein profiling through mass spectrometry gives additional important information to gene expression profiling along with information on post-translational modifications (e.g. phosphorylation and acetylation). Other laboratories have focused on global protein levels after E2 treatment [22-26]. Although these studies have increased our current knowledge on E2 responsiveness, much work is still required in understanding the differences associated with short versus prolonged E2 exposures on protein level and its impact on cell signaling.
Using a reciprocal flipped design and Stable Isotope Labeling by Amino Acids in Cell Culture (SILAC), proteins involved in regulating estrogen-induced cell growth and alteration in breast cancer cells were identified by measuring changes in protein levels resulting from E2 treatment of the ER-positive MCF-7 breast cancer cell line. In a parallel study, changes in the protein level induced by estrogen in the ER negative cell line MDAMB-231 were identified. Cells were grown in amino acid deficient media supplemented with labeled amino acids, allowing for the total incorporation of the label into the cells proteome [27]. The reciprocal flipped design permits a more robust validation of the results by increasing confidence in the expression of proteins identified and decreasing errors associated with isotopic conversion of arginine to proline detected in SILAC-heavy media [28].
The aim of this parallel study using ER positive and ER negative cell lines was to identify unique non-genomic ER-dependent and ER-independent biological processes altered by estrogen in breast cancer cells.
2. Materials and Methods
2.1. Reagents
Chemicals used in this study included 17-β-estradiol (E2) (MP Biomedicals); SILACTM media, all supplements and dialyzed fetal bovine serum (Invitrogen); Dulbecco’s Modified Eagle’s Medium (DMEM), penicillin and streptomycin (Fisher Scientific); fetal bovine serum (Tissue Culture Biological); MTT (3-(4,5-Dimethylthi-azol-2-yl)- 2,5-diphenyltetrazolium bromide) reagent (Research Products International corp.); DMSO (Sigma).
2.2. Cell Culture
All cells were grown at 37˚C in a humidified incubator with 5% CO2. The MCF-7 (ER positive) and MDAMB-231 (ER negative) human breast cancer cell lines were obtained from the American Type Culture Collection (ATCC) and maintained in DMEM supplemented with 10% fetal bovine serum, 1% penicillin and streptomycin. SILACTM medium was prepared according to the manufacturer’s instructions. In brief, glucose, L-glutamine, sodium pyruvate, penicillin, and streptomycin were added to phenol red free flex medium lacking the essential amino acids L-Lysine and L-Arginine. [U-13C6]-LLysine and [U-13C6, 15N4]-L-Arginine were added to form the “Heavy” medium; normal L-Lysine and L-Arginine were added to form the “Light” media. Once normal cell growth was established in DMEM, both cell types were moved to Heavy or Light SILAC media supplemented with 10% dialyzed fetal bovine serum and grown for at least six passages before the start of experiments to allow for complete incorporation of the labeled amino acids into the entire proteome.
2.3. Estrogen Treatment and MTT Assay
We performed MTT colorimetric proliferation assay to determine cell proliferation. The cells were grown in phenol-free DMEM containing 5% dialyzed FBS for 48 hours prior to E2 treatment. Cells were plated in 96-well plates (2500 - 5000 cells/well). Twenty-four hours after cell plating (day 0), E2 was added to the medium (final concentrations of 5 nM, 10 nM and 20 nM), and an equal volume of ethanol was used as vehicle-control (0 nM of E2). Following the appropriate stimulation period, MTT reagent was added to each well and incubated for 4 hours. DMSO was used to dissolve the crystals and optical density readings at 570 nm were obtained using a spectrophotometer.
For the proteomics experiment, the MCF-7 cells were treated with 10 nM E2 or ethanol control for 15 minutes, 4 hours, 8 hours, 24 hours, 48 hours, and 72 hours, 4 plates per time point. We performed the experiment in duplicate with light-label serving as control in the first case, and heavy-label in the second. The flipped label control allowed us to run the same biological sample twice: Heavy treated combined with light control and light treated combined with heavy control. The MDAMB-231 cells were treated similarly with 10 nM E2 or ethanol (vehicle control) for 24 hours only. At the end of each treatment period, the cells were washed twice with Tris-buffered saline, scraped with 500 µl of 8 M urea in 50 mM tris-HCl buffer pH 8.3 supplemented with protease inhibitors (Roche Complete Mini), then incubated on ice for 15 minutes. Using cell disruption by pressure cycling technology [29], samples were processed through a pressure barocyclerTM (Pressure Biosciences Inc.) for 15 cycles (30 seconds at 35 kpsi and 20 seconds at atmospheric pressure (0 kpsi)) then centrifuged for 15 minutes at 12,000 × g and the supernatant was collected. Protein concentration was determined using BCA assay kit (Pierce). This harvest was performed at approximately 70% cell confluence.
2.4. Protein Preparation and Digestion
For each stimulation period, a 1:1 (200 µg total) mixture of protein lysate from heavy and light sample was combined and digested with trypsin as follows: 10 mM DTT in 50 mM Tris-HCl buffer, pH 8.3 incubation for 1 hour at 37˚C followed by 20 mM iodoacetamide in 50 mM Tris-HCl buffer, pH 8.3, incubation for 1 hour at room temperature in the dark. The protein solution was diluted by a factor of 4 with 50 mM Tris-HCl pH 8.3. Trypsin was then added at ratio of 1:50 (trypsin: protein) by weight and incubated overnight at 37˚C (16 hours).
2.5. Peptide Analysis
The digested peptide mixtures were desalted using Supelco ENVI-18 cartridges. The dried peptides were resuspended in 250 µl 90% ACN/0.1% TFA and fractionated by hydrophilic-interaction liquid chromatogramphy (HILIC) through a 4.6 × 250 mm TSKamide-80 HILIC column (Tosoh Bioscience LLC). All reagents for the mobile phases were of HPLC grade (Sigma). Buffer phase A contained 2% ACN and 0.1% TFA; buffer phase B contained 98% ACN and 0.1% TFA. Peptides were eluted at 0.5 ml/min total flow through a linear gradient of mobile phase B from 90% to 85% in 5 minutes, then from 85% to 70% in 15 minutes. Fractions were collected every 2 minutes.
From the 60 collected fractions, 12 were determined to contain peptide fractions based on the absorbance. The fractions were transferred to 1.5 ml microcentrifuge tubes and speed-vacuumed to dryness, then resuspended in 18 µl of 0.1% TFA in water. The mass spectrometry analysis was performed using LC/MS/MS on a ThermoElectron ProteomeX LC/MS workstation, consisting of a LCQ DecaXP Plus Ion-Trap mass spectrometer equipped with a nanospray ion source and an LC system with two Surveyor HPLC pumps and Surveyor auto-sampler. One third of each fraction was loaded onto a trap column (Agilent Zorbax SB-C18, 5 µm, 5 × 0.3 mm) by 3% acetonitrile/0.1% formic acid at a flow rate of 15 µl/min. Peptides were eluted from the trap onto an in-house packed reverse phase capillary column (3 µm C18, 300 Å pore size particles slurry-packed in a 12 cm long 75 µm ID PicoTip from New Objectives) in the nanospray source for separation. The elution gradient was 3% - 40% acetonitrile/0.1% formic acid in 46 min, at a flow rate of 180 µl/min. The nanospray source spray voltage was 1.8 keV. The LCQ DecaXP Plus Ion-Trap mass spectrometer was set to acquire one full MS scan from 380 - 1600 m/z, followed by three data-dependent MS/MS scans of the top 3 most intense ions, using a normalized collision energy of 35% and an isolation width of 2.3 m/z. To ensure adequate coverage of co-eluting peptides, dynamic exclusion was used with a repeat count of 2, repeat duration of 0.5 min, and exclusion duration of 2 min.
2.6. Protein Identification and Quantification
The peptide mass spectra acquired in “.RAW” format were converted to “.mzXML” and then to Mascot Generic files (.mgf) using the Trans-Proteomic Pipeline (TPP) web interface (Institute for Systems Biology, version 3.4). The individual “.mgf” files from each fraction were searched against the SwissProt database using Mascot Daemon (Matrix Science version 2.1.6). The searches were performed with a peptide tolerance of 1.2 dalton and MS/ MS tolerance of 0.8 dalton; peptide charge of “2+ and 3+”; fixed modification at carbamidomethyl (C); variable modifications to account for the 6 and 10 dalton shift of Lysine (K) and Arginine (R) respectively, methionine oxidation (M), and a maximum of 2 missed cleavages.
Mascot files containing the identified proteins were converted to “pepXML” files using TPP. Protein identification was determined using TPP tools PeptideProphet and ProteinProphet. Only protein identification established with a p < 0.05 were used for downstream analysis. The relative expression levels of each protein was determined by Automated Statistical Analysis on Protein Ratio (ASAPRatio) that specifically quantifies ratios of the differentially labeled proteins and return a value light/ heavy with their corresponding confidence intervals [30]. The biological processes and KEGG pathways were obtained from a web-based Database for Annotation, Visualization and Integrated Discovery (DAVID) [31, 32].
3. Results
3.1. Estrogen Increases the Rate of Cell Division in ER Positive Cells Grown in SILAC Media but Not That of ER Negative Cells
To verify the proliferative effect of E2 on both cell lines (MCF-7 and MDA-MB-231) cultured in SILAC media, we treated them with varying concentrations of E2 (0 - 20 nM), and cell proliferation was measured using the MTT assay. The range of E2 concentration used was derived from an estimation of our MCF-7 responsiveness to E2 and concentrations used in similar studies [8,9, 11-13,20,31]. There was a sustained proliferation difference in MCF-7 over time depending on the E2 dosage. No difference was observed in MDA-MB-231 cells. At day 3 (Figure 1), MCF-7 E2 treated cells differed from the 0 nM treatment (p = 0.04, using two samples student t-test assuming equal variances). The difference between E2 treatment and no treatment was also significant at other time points (data not shown). We chose a saturating dose of 10 nM for the protein expression studies. The same dose was also used in several gene and protein expression studies [8,9,11-13,20,33].
3.2. 214 Proteins Are Significantly Differentially Expressed after Estrogen Treatment
MCF-7 cells were treated with ethanol vehicle control and 10 nM E2 for 0.25-, 4-, 8-, 24- 48- and 72-hours. MDA-MB-231 cells were treated with ethanol vehicle control and 10 nM E2 for 24 hours. The incorporated amino acids are isotopically distinct and can be easily distinguished by mass spectrometry. This allows for pro-
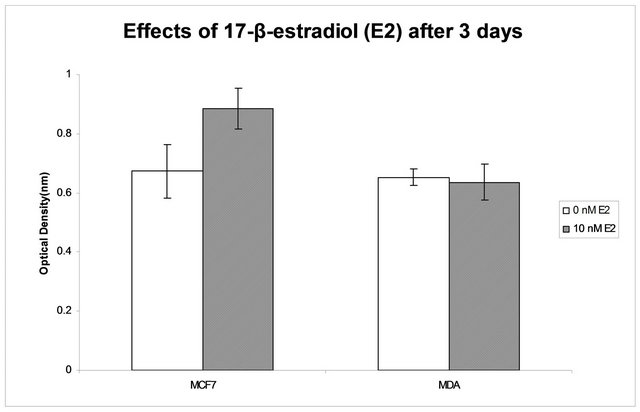
Figure 1. Cells grown in 5% dialyzed FBS and treated with 0 and 10 nM E2 for 3 days. MTT assay was performed to quantify the number of viable cells in 96 well plates. Y axis represents Optical Density readings obtained from an observance reading 570 nm on a spectrophotomer. The error bars represent the standard deviation between quadruplet wells. Estrogen treatment has no effect on the observed growth of the estrogen receptor negative cell line (MDAMB-231) but does affect the growth of the estrogen receptor positive cell line (MCF-7).
tein expression between treated and control cells to be quantified based on the relative peak intensities of the isotopic peptide pairs. A light-to-heavy ratio was obtained by contrasting the light and heavy isotopic versions of arginine (10 Da shift) and lysine (6 Da shift).
Close to 1500 proteins were significantly identified (p < 0.05) with a false discovery rate less than 4%. We defined differentially expressed proteins as those (a) appearing in both replicates, (b) whose expression pattern occurred in the same direction (i.e. X identified protein was up-regulated in treated-light to control-heavy and upregulated in treated-heavy to control-light and vice versa) and (c) at least one of the log 2 transformed expression values was >0.5 or <−0.5.
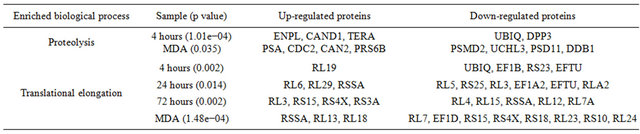
We categorized the identified significant proteins based on enriched biological processes (p < 0.05) as defined by Gene Ontology using DAVID [31,32] (see method) to expose those genomic and ER-dependent processes that are affected by E2. Table 1 lists all enriched biological processes at each treatment period and the expressions of the proteins involved.
3.3. Time Dependent Changes on Protein Levels after Estrogen Treatment
3.3.1. 15 Minutes MCF-7
36 proteins are differentially expressed after 15 minutes of estrogen treatment. DAVID analysis of these proteins shows protein folding (p = 0.013) and response to temperature stimulus (p = 0.033) are enriched biological processes at this time point. Four proteins that assist the folding of other proteins, namely that of cytoskeletal proteins such as actin and tubulin upon ATP hydrolysis and prevent aggregation of misfolded protein, were upregulated at this time point (T-complex protein 1 subunit zeta, beta, gamma, Protein disulfide-isomerase A6). However, two proteins with similar functions were downregulated (T-complex protein 1 subunit delta and RuvBlike 2). It was shown that the E2-ERα complex associates with microtubules to modulate rapid estrogen signaling in MCF-7 cells [34]. This association directly leads to phosphorylation of AKT and activation of MAPK and occurs within minutes of treatment in order for subsequent cell signaling to occur. Our data shows that estrogen (possibly in conjunction with its receptor) regulates the expression of proteins responsible for proper folding of microtubule proteins. This regulation probably occurs via the activation of protein translational or degradation machinery. Proteins involved in translation elongation were differentially expressed at this time point and so were members of proteolytic complex although this process was not enriched.
Three proteins were grouped into the response to temperature stimulus process. The expression of Latexin and Superoxide dismutase was up-regulated and ATPTable 1. Enriched biological process. (a) Genomic processes; (b) Non-genomic processes; (c) ER-independent processes.
(a)
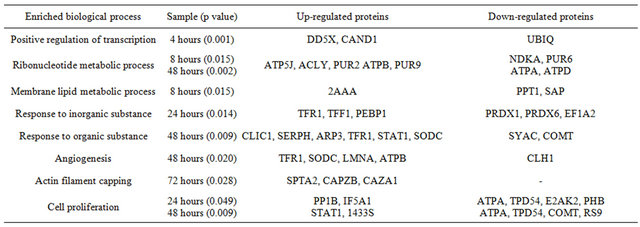
(b)
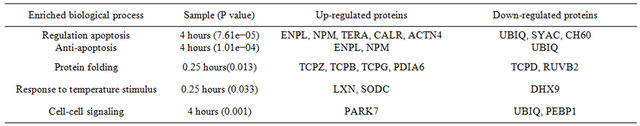
(c)
dependent RNA helicase A was down-regulated.
3.3.2. 4 Hours MCF-7
35 proteins are differentially expressed after 4 hours of E2 treatment. As enriched biological processes at this time point, we found regulation of apoptosis (p = 7.61e− 05), positive regulation of transcription (p = 0.001), cell to cell signaling (p = 0.001), translational elongation (p = 0.002) and proteolysis (p = 1.01e−04). Five proteins are present in the translation elongation process and these are different proteins then were found at 15 minutes. Within apoptosis, negative regulation of apoptosis was significantly enriched (p = 1.01e−04). In this category are proteins such as endoplasmin (also known as heat shock protein 90) and nucleophosmin that negatively regulate apoptosis and both proteins were significantly upregulated at this time point. Endoplasmin is a chaperone protein to the estrogen receptor. It is important for the proper post-translational folding and stability of proteins, and its inhibition leads to the degradation of key oncogenes [35]. Nucleophosmin is an estrogen-regulated nucleolar phosphoprotein whose expression is induced by estrogen, however its expression is highest in MCF-7 cells that became estrogen independent and resistant to anti-estrogen treatment [36] implying a role in the acquired resistance known to take place in treated breast cancer cells. This protein inhibits p53 and prevents DNA binding to interferon regulatory transcription factor 1 (IRF1) decreasing its tumor suppression activity. Other proteins with known functions in apoptosis including actinin alpha 4 calreticulin and valosin-containing-protein were also up-regulated. It was recently demonstrated that actinin alpha 4 enhance transcription activity of ERα in MCF-7 [37]. Taken together this data shows the potential pathways used by estrogen to prevent cell death and increase cell survival.
Furthermore, cell to cell signaling included the downregulation of ubuquitin, and Phosphatidylethanolaminebinding protein 1. The latter protein is a known inhibitor of raf-1 kinase activity and MAP kinase signaling [38,39]. It directly binds to raf-1 and disrupts its interaction with MEK-1, a kinase that activates the extracellular signal regulated kinases (ERK) [39]. This protein also inhibits NF-κB and AP-1 signaling. The fact that estrogen is able to negatively regulate the expression of this protein further links at its role in early activation of MAPK signaling. Protein DJ-1 was up-regulated and categorized in this process. It functions as a transcription factor and translocates to the nuclei from cytoplasm in response to mitogens [40]. It has also been implicated in PI3K survival pathway as a negative regulator of PTEN-mediated tumor suppression [41]. The fact that this process is enriched at this time, points to the cytoplasmic signaling of E2 and the proteins directly involved. This signaling either probably precedes or occurs independently of the transcriptional (genomic) activities of estrogen.
Positive regulation of transcription was also enriched (p = 0.01) at this time point with the increased expression of proteins such as Probable ATP-dependent RNA helicase DDX5, Cullin-associated NEDD8-dissociated protein 1 that enhance transcription.
3.3.3. 8 Hours MCF-7
46 proteins are differentially expressed after 8 hours of E2 treatment with two biological processes enriched that are related to metabolism (ribonucleotide metabolic process, p = 0.013; membrane lipid metabolic process, p = 0.015). Proteins present in these categories serve as scaffolding molecules that coordinate the assembly of catalytic subunits, proton transport across mitochondrial membrane, Acetyl CoA synthesis, ATP production, and degradation. This suggests an increase in protein synthesis and glycolysis, processes enriched during active cell development and growth and preparation for mitosis.
3.3.4. 24 Hours MCF-7
60 proteins are differentially expressed after 24 hours of estrogen treatment and the processes enriched are translation elongation (p = 0.014), response to inorganic substance (p = 0.014), angiogenesis (p = 0.048) and regulation of cell proliferation (p = 0.049).
Three proteins are present in the angiogenesis process: nucleolin (up), myosin 9 (up) and Beta F1 AT-Pase (down). The adhesion molecule nucleolin functions in conjunction with myosin 9 to regulate migration, invasion and tubule formation in endothelial cells [42]. It is found on the cell surface of MCF-7 cells but not of normal epithelial cells [43]. Beta F1 ATPase is a mitochondria protein that drives ATP synthesis. It is downregulated in multiple cancers and this reduction leads to tumor progression [44]. Its translation and localization is regulated by the mitochondria and it was found that its expression is repressed post-transcriptionally by breast carcinoma extracts [45]. The regulation of angiogenic proteins in our data agrees with previous studies and highlights the global effects of E2 even on mitochondrial proteins.
3.3.5. 48 Hours MCF-7
39 proteins are differentially expressed after 48 hours of estrogen treatment and the processes enriched are: regulation of cell proliferation (p = 0.009), ribonucleotide metabolic process (0.002), response to protein stimulus (p = 0.031) and inorganic substance (p = 0.009).
Most of the proteins involved in the regulation of cellular uptake of ion and membrane mediated endocytosis were up-regulated. Chloride intracellular channel protein 1 transitions from cytoplasmic monomer to form membrane chloride channels via oxidation [46]. Serpin H1 is a molecular chaperone involved in the maturation and stabilization of collagen [47]. Actinrelated protein 3 (up) is an ATP-binding component of a complex involved in actin polymerization that leads to increased cell motility [48]. Transferrin receptor protein 1 is responsible for cellular uptake of iron through the plasma membrane. Signal transducer and activator of transcription 1-alpha/beta activates transcription after serine and tyrosine phosphorylation by kinases and/or growth factors [49]. Other proteins responsible for cellular uptake of iron through the plasmamembrane, destruction of toxic radicals produced within the cell, chromatin organization and ATP hydrolysis were also up-regulated. Among the down-regulated proteins were Clathrin heavy chain 1, a major cell and vesicle membrane protein and Catechol O-methyltransferase, disturb microtubule dynamics and inhibits estrogen signaling [50-52]. The data from this time point give details of specific proteins targeted by E2 to increase cellular transport which lead to proliferation.
3.3.6. 72 Hours MCF-7
46 proteins are differentially expressed after 72 hours of estrogen treatment and the processes enriched were translation elongation (p = 0.002) and actin filament capping (p = 0.028). Spectrin alpha chain, F-actincapping protein subunit alpha-1, and F-actin-capping protein subunit beta were all up-regulated and are involved in actin filament capping, a crucial step for actin cytoskeleton remodeling. Dysregulation in actin based processes is a factor in cell motility and transformation [53]. The changes to the cytoskeleton after estrogen treatment could be linked to increased migration and invasion.
3.3.7. 24 Hours MDA-MB-231
50 proteins are differentially expressed after 24 hours of estrogen treatment in the estrogen receptor negative cells (MDA-MB-231). The processes enriched are translational elongation (p = 1.48e−04), proteolysis (p = 0.035), cell cycle checkpoint (p = 0.007).
Translation elongation usually occurs in the cytoplasm and is regulated by ribosomes, which consist of two subunits that work as one to create a polypeptide chain from mRNA during protein biosynthesis, and each subunit is comprised of a set of proteins (ribosomal proteins) whose functions expand beyond protein synthesis [54]. We identified as up and down regulated proteins that primarily aid at stabilizing both subunits during protein translation. Subunits of the 26S proteasome, involved in controlling the concentration of proteins in diverse regulatory pathways by post-translational ubiquitination and degradation, led to the enrichment of the proteolysis process in these cells. Cell cycle check point was enriched at this time point and it included three proteins: DNA damage-binding protein 1 (down), cell division protein kinase 1 (up), and 60S ribosomal protein L24 (down). These proteins hint the E2 induced changes in cell cycle in ER negative cells. It is known that E2 treatment causes cell death and/or decreases the proliferation rate of ER negative cells [10]. We did not however observe a difference in growth between E2 treated MDA-MB-231 cells and control (Figure 1), and this could be due to the dose of estrogen used and treatment period.
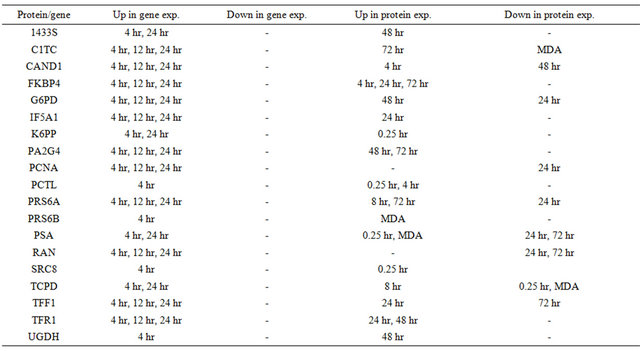
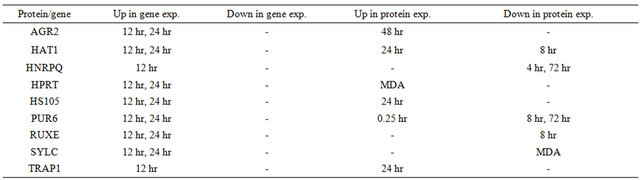
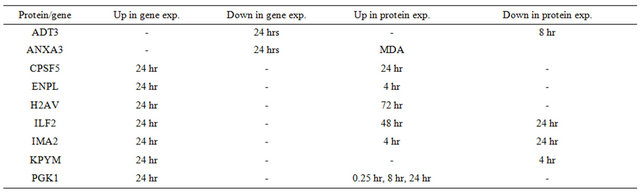
3.4. Comparison with Known Estrogen Responsive Genes
40 published E2 responsive genes are present in our data as differentially expressed E2 proteins. These include known oncoenes like AGR2, IF5A1, and PA2G4 all exhibiting similar expression patterns. The mRNA of FK506-binding protein 4, involved in protein binding, is up-regulated after 4, 12 and 24 hours of E2 treatment [18]; in our data, the protein FK506-binding protein 4 is up-regulated after 4, 24 and 72 hours. Interestingly, changes in gene expression over time do not always correlate with changes in protein levels. Endoplasmin plays a role in estrogen signaling in cells through the estrogen receptor and we found that its protein level is upregulated at an earlier time point (4 hours) than its gene expression (24 hours) (see Table 2). Although the expression of more than 85% of these proteins/genes agreed in at least one time point, we noticed that protein expression followed an up-down pattern over-time. This observation was somewhat expected given that proteins are continuously being produced and degraded depending on their role in the specific regulatory pathway taking place. For this reason, amount of mRNA transcripts are not always direct indicators of the level of their corresponding protein. Our data demonstrates the increased transcriptional-induced expression of E2 proteins already known through gene expression studies and provides the expression patterns of proteins regulated by rapid E2 signaling processes and those that are posttranscriptionally regulated.
4. Discussion
It is well known that E2 is able to increase the rate of cellular transcription in mammary cells primarily through the ERα receptor, the most abundant ER in mammary cells. MCF-7 cells are ER positive; MDA-MB-231 cells are ER negative [55,56]. We first verified the mitogenic effects of estrogen by treating both cells lines with E2 and observed changes on cell proliferation. We found increased proliferation only in the cell line expressing ER. We next examined the effects of E2 on global protein expression over multiple time points in ER cells, as well as compared protein changes in an ER-positive system to that of an ER-negative system.
Our proteomic approach combines the in-culture labeling techniques (SILAC) with two-dimensional peptide separation (HILIC and reverse-phase) and allows for direct comparison between treated and control samples with minimized variations caused by sample preparation. SILAC media has been shown to have no effect on cell morphology and rate of proliferation [27,57]. We used dialyzed fetal bovine serum (FBS) supplement rather than charcoal stripped FBS that is usually used in estrogen studies as a supplement to the cell culture media. In dialyzed FBS, most molecules below a molecular weight of 10,000 are removed; this includes a low but uncontrollable amount of steroid hormones like E2 and free unlabeled amino acids that can alter the labeling efficiency. A cell proliferation assay (MTT) allowed us to verify that the cells remained estrogen responsive with the dialyzed FBS.
The importance of the flipped label design is illustrated by the discovery that the number of significant differentially expressed proteins identified in the same sample differed from one experiment run to another. This is potentially caused by recent mentions of problematic conversion of isotopic arginine to proline in cells grown in SILAC-heavy media [28]. The resulting conversion causes inaccuracies when comparing heavy peptide ion signals to their light counterparts. Our flipped replicate design helped in decreasing these errors affecting protein quantification.
4.1. Genomic Biological Processes
The well described classical genomic pathway of estrogen
Table 2. Comparisons of genomic data and proteomic data. (a) Estrogen responsive genes at 4 hours; (b) Estrogen responsive genes at 12 hours; (c) Estrogen responsive genes at 24 hours.
(a)
(b)
(c)
We found that estrogen affects cancer specific processes required for metastasis such as increased cell migration and invasion through regulation of different stages of cell cycle and changes in cytoskeletal dynamics. The present analysis suggests that this only occurs in the presence of the estrogen receptor and is a result of the classical genomic pathway. MDA-MB-231 cells do not express ER but this receptor is expressed in MCF-7 cells. ER is responsible for most of the proliferative effects of estrogen on cells and is the primary target of selective estrogen receptor modulator therapies used in women with estrogen receptor positive breast cancers. The cancer specific processes mentioned above were only observed in the MCF-7 cells. Phenotypic (increase cell proliferation Figure 1), genomic (published E2 responsive genes [18]), and proteomic (enriched biological processes Table 1) data support our hypothesis.
Our data agrees with previous genomic studies. Gadal et al. [11] stimulated MCF-7 cells with 10 nM E2 for 15 hours and identified E2-inducible genes whose functions include cytoskeletal and ECM remodeling, cell-cycle progression, and catechols/quinone synthesis regulation. Inoue et al. also used 10 nM E2 to stimulate MCF-7 cells for 6, 12, 24, and 72 hours using a custom-made microbarray to measure the gene expression levels of 138 genes [12]. A comparison of the differentially expressed proteins identified in our studies and the genes reported in these previous studies show correlation between gene and protein expression. In addition, our data allowed us to identify E2 proteins whose expression is only altered posttranscriptionally and E2 mitochondrial proteins.
Our data also agrees with previous proteomic studies. One such study compared the tryptic peptide ion intensities of E2 treated and control whole cell lysates after 1-D SDS PAGE band fractionation [25]. Another study used 2-D PAGE gels [24] and yet another relied on isobaric tags [23]. These studies report proteins such as FK506- binding protein 4 that also appear in our data displaying similar levels. Although slightly different E2 doses were used in the other studies, all studies utilized a saturating dose of E2 so the results should be comparable. The overall agreement is fairly good, but unfortunately, there was only a limited overlap in the proteins that were identified in the various studies. This is not unexpected with the different methods employed in the studies. Our data reveals proteins involved in some non-genomic and ERindependent processes not previously associated with estrogen.
4.2. Non-Genomic Biological Processes
At earliest time point after treatment with E2, mRNA transcription is not expected to change substantially, but protein production can be post-transcriptionally regulated through phosphorylation of initiation/elongation factors and response to iron levels [58]. The increased expression of proteins found at early time point (15 minutes) is due to this mechanism and cannot be a result of transcription activation (genomic effects of E2). Similarly, the rapid degradation of proteins can also occur. Hence, estrogen appears to regulate rapid signaling pathways through increased translation of key proteins.
Apoptosis, protein folding and cell-cell signaling all appear to be regulated via non-genomic processes. They were all enriched after 15 minutes and/or 4 hours of estrogen treatment. There are known non-genomic pathways described as occurring within minutes of estrogen treatment via activation of MAPK signaling through membrane bound ER that lead to anti-apoptosis. This process may involve proteins such as ubiquitin and nucleophosmin 1 that negatively regulate apoptosis and were differentially expressed after 4 hours in our data. Furthermore, microtubule associated proteins are linked to these early non-genomic actions of estrogen as modulators [34]. We found at our earliest time point (15 minutes), protein folding was enriched. The proteins present in this category aid in the folding of microtubule proteins (actin and tubulin).
4.3. ER-Independent Biological Processes
Biological processes enriched specifically after 24 hours of estrogen treatment in both cell lines are those we represent here as ER-independent processes since their regulation occurred regardless of the presence of the estrogen receptor. 50 proteins were differentially expressed in the estrogen receptor negative systems. Estrogen is able to alter the expression of these proteins while relying on increased translation of specific already-present mRNA and protein degradation. These regulations take place independent of transcription activation. Translation elongation was enriched after 24 hours of E2 treatment in both cell lines but also after 4 and 72 hours in MCF-7 cells. It is interesting to note that translational elongation enriched in the MDA-MB-231 cells did not lead to increased cell proliferation. Proteolysis was enriched after 24 hours in MDA-MB-231 cells and 4 hours in MCF-7 cells. Taken together, we infer that estrogen affects the post-transcriptional regulation of protein expression using translation elongation and protein degradation in an ER-independent manner.
Other ER-independent pathways of estrogen have been described as occurring through membrane receptors namely G-protein coupled receptors, epidermal and insulin growth factor receptors [59,60]. The expression level of some proteins were similar in both cell lines however key proteins needed for increased cell division were either differentially expressed in different directions or only different in the MCF-7 cells.
5. Conclusion
In conclusion, we present biological processes perturbed after estrogen treatment and hypothesize the pathways involved. Estrogen negatively regulates apoptosis through non-genomic pathways, and we present the proteins involved. Increased translation elongation and proteolytic activity occur independently of the estrogen receptor. Estrogen causes an increase in cell proliferation, and molecular analysis suggests that it also increases cell motility, which could lead to invasion and metastasis only in the presence of the estrogen receptor. This data supports and complements gene expression studies and implies the need for a combination of gene and protein expression analysis to determine the response elicited by cellular stimulants such as hormones. Together they highlight the intricate mechanisms of actions of estrogen and its role in breast cancer onset and development. Taken together, our data increases our knowledge of estrogen signaling in cells and reveals targets that could be used to block the estrogen induced progression of breast cancer.
6. Acknowledgements
This study was made possible by grants to A.A.Q. from the Breast Cancer Research Foundation and the Pennsylvania Breast Cancer Coalition.
REFERENCES
- D. T. Baird and I. S. Fraser, “Blood Production and Ovarian Secretion Rates of Estradiol 17β and Estrone in Women throughout the Menstrual Cycle,” Journal of Clinical Endocrinology and Metabolism, Vol. 38, No. 6, 1974, pp. 1009-1017. doi:10.1210/jcem-38-6-1009
- C. Flood, J. H. Pratt and C. Longcope, “The Metabolic Clearance and Blood Production Rates of Estriol in Normal, Non Pregnant Women,” Journal of Clinical Endocrinology and Metabolism, Vol. 42, No. 1, 1976, pp. 1-8. doi:10.1210/jcem-42-1-1
- J. G. Liehr, “Is Estradiol a Genotoxic Mutagenic Carcinogen?” Endocrine Reviews, Vol. 21, No. 1, 2000, pp. 40-54. doi:10.1210/er.21.1.40
- C. J. Gruber, et al., “Mechanisms of Disease: Production and Actions of Estrogens,” New England Journal of Medicine, Vol. 346, No. 5, 2002, pp. 340-352. doi:10.1056/NEJMra000471
- B. W. O’Malley, et al., “Studies on the Mechanism of Steroid Hormone Regulation of Synthesis of Specific Proteins,” Recent Progress in Hormone Research, Vol. 25, 1969, pp. 105-160.
- W. Wang, et al., “Transcriptional Activation of E2F1 Gene Expression by 17β-Estradiol in MCF-7 Cells Is Regulated by NF-Y-Sp1/Estrogen Receptor Interactions,” Molecular Endocrinology, Vol. 13, No. 8, 1999, pp. 1373- 1387. doi:10.1210/me.13.8.1373
- Y. Umayahara, et al., “Estrogen Regulation of the Insulin-Like Growth Factor I Gene Transcription Involves an AP-1 Enhancer,” Journal of Biological Chemistry, Vol. 269, No. 23, 1994, pp. 16433-16442.
- K. T. Lim, et al., “Nongenomic Oestrogen Signalling in Oestrogen Receptor Negative Breast Cancer Cells: A Role for the Angiotensin II Receptor AT1,” Breast Cancer Research, Vol. 8, No. 3, 2006, p. R33. doi:10.1186/bcr1509
- T. Improta-Brears, et al., “Estrogen-Induced Activation of Mitogen-Activated Protein Kinase Requires Mobilization of Intracellular Calcium,” Proceedings of the National Academy of Sciences of the United States of America, Vol. 96, No. 8, 1994, pp. 4686-4691. doi:10.1073/pnas.96.8.4686
- D. A. Zajchowski, R. Sager and L. Webster, “Estrogen Inhibits the Growth of Estrogen Receptor-Negative, but Not Estrogen Receptor-Positive, Human Mammary Epithelial Cells Expressing a Recombinant Estrogen Receptor,” Cancer Research, Vol. 53, No. 20, 1993, pp. 5004- 5011.
- F. Gadal, et al., “Integrative Analysis of Gene Expression Patterns Predicts Specific Modulations of Defined Cell Functions by Estrogen and Tamoxifen in MCF7 Breast Cancer Cells,” Journal of Molecular Endocrinology, Vol. 34, No. 1, 2005, pp. 61-75. doi:10.1677/jme.1.01631
- A. Inoue, et al., “Development of cDNA Microarray for Expression Profiling of Estrogen-Responsive Genes,” Journal of Molecular Endocrinology, Vol. 29, No. 2, 2002, pp. 175-192. doi:10.1677/jme.0.0290175
- J. Frasor, et al., “Profiling of Estrogen Upand DownRegulated Gene Expression in Human Breast Cancer Cells: Insights into Gene Networks and Pathways Underlying Estrogenic Control of Proliferation and Cell Phenotype,” Endocrinology, Vol. 144, No. 10, 2003, pp. 4562- 4574. doi:10.1677/jme.0.0290175
- H. Watanabe, et al., “Genome-Wide Analysis of Changes in Early Gene Expression Induced by Oestrogen,” Genes to Cells, Vol. 7, No. 5, 2002, pp. 497-507. doi:10.1046/j.1365-2443.2002.00535.x
- K. R. Coser, et al., “Global Analysis of Ligand Sensitivity of Estrogen Inducible and Suppressible Genes in MCF7/ BUS Breast Cancer Cells by DNA Microarray,” Proceedings of the National Academy of Sciences of the United States of America, Vol. 100, Suppl. 2, 2003, pp. 13994- 13999. doi:10.1073/pnas.2235866100
- A. M. Soto and C. Sonnenschein, “Mechanism of Estrogen Action on Cellular Proliferation: Evidence from Indirect and Negative Control on Cloned Breast Tumor Cells,” Biochemical and Biophysical Research Communications, Vol. 122, No. 3, 1984, pp. 1097-1103. doi:10.1016/0006-291X(84)91204-X
- J. T. Papendorp, et al., “On the Role of 17 Alpha-Estradiol and 17 Beta-Estradiol in the Proliferation of MCF7 and T47D-A11 Human Breast Tumor Cells,” Journal of Cellular Physiology, Vol. 125, No. 3, 1985, pp. 591-595. doi:10.1002/jcp.1041250331
- S. Tang, et al., “Computational Method for Discovery of Estrogen Responsive Genes,” Nucleic Acids Research, Vol. 325, No. 21, 2004, pp. 6212-6217. doi:10.1093/nar/gkh943
- S. Tang, et al., “KBERG: Knowledge Base for Estrogen Responsive Genes,” Nucleic Acids Research, Vol. 35, Suppl. 1, 2007, pp. D732-736.
- D. Y. Wang, et al., “Identification of Estrogen-Responsive Genes by Complementary Deoxyribonucleic Acid Microarray and Characterization of a Novel Early Estrogen-Induced Gene: EEIG1,” Molecular Endocrinology, Vol. 18, No. 2, 2004, pp. 402-411. doi:10.1210/me.2003-0202
- C. J. Creighton, et al., “Genes Regulated by Estrogen in Breast Tumor Cells in Vitro Are Similarly Regulated in Vivo in Tumor Xenografts and Human Breast Tumors,” Genome Biology, Vol. 7, No. 4, 2006, p. R28. doi:10.1186/gb-2006-7-4-r28
- J. Zhao, et al., “Proteomic Analysis of Estrogen Response of Premalignant Human Breast Cells Using a 2-D Liquid Separation/Mass Mapping Technique,” Proteomics, Vol. 6, No. 13, 2006, pp. 3847-3861. doi:10.1002/pmic.200500195
- J. M. Armenta, I. Hoeschele and I. M. Lazar, “Differential Protein Expression Analysis Using Stable Isotope Labeling and PQD Linear Ion Trap MS Technology,” Journal of the American Society for Mass Spectrometry, Vol. 20, No. 7, 2009, pp. 1287-1302. doi:10.1016/j.jasms.2009.02.029
- L. Malorni, et al., “Proteomic Analysis of MCF-7 Breast Cancer Cell Line Exposed to Mitogenic Concentration of 17β-Estradiol,” Proteomics, Vol. 6, No. 22, 2006, pp. 5973- 5982. doi:10.1002/pmic.200600333
- Z. Zhu, A. R. Boobis and R. J. Edwards, “Identification of Estrogen-Responsive Proteins in MCF-7 Human Breast Cancer Cells Using Label-Free Quantitative Proteomics,” Proteomics, Vol. 8, No. 10, 2008, pp. 1987- 2005. doi:10.1002/pmic.200700901
- Z. Zhu, R. J. Edwards and A. R. Boobis, “Increased Expression of Histone Proteins during Estrogen-Mediated Cell Proliferation,” Environmental Health Perspectives, Vol. 117, No. 6, 2009, pp. 928-934.
- S. E. Ong, et al., “Stable Isotope Labeling by Amino Acids in Cell Culture, SILAC, as a Simple and Accurate Approach to Expression Proteomics,” Molecular & Cellular Proteomics: MCP, Vol. 1, No. 5, 2002, pp. 376-386. doi:10.1074/mcp.M200025-MCP200
- S. C. Bendall, et al., “Prevention of Amino Acid Conversion in SILAC Experiments with Embryonic Stem Cells,” Molecular and Cellular Proteomics, Vol. 7, No. 9, 2008, pp. 1587-1597. doi:10.1074/mcp.M800113-MCP200
- R. T. Schumacher, et al., “An Automated Sample Preparation Solution for Nucleic Acid and Protein Extraction from Cells and Tissues,” American Laboratory, Vol. 34, No. 16, 2002, p. 38.
- X. J. Li, et al., “Automated Statistical Analysis of Protein Abundance Ratios from Data Generated by Stable-Isotope Dilution and Tandem Mass Spectrometry,” Analytical Chemistry, Vol. 75, No. 123, 2003, pp. 6648-6657. doi:10.1021/ac034633i
- G. Dennis Jr., et al., “DAVID: Database for Annotation, Visualization, and Integrated Discovery,” Genome Biology, Vol. 4, No. 5, 2003, p. P3. doi:10.1186/gb-2003-4-5-p3
- D. W. Huang, B. T. Sherman and R. A. Lempicki, “Systematic and Integrative Analysis of Large Gene Lists Using DAVID Bioinformatics Resources,” Nature Protocols, Vol. 4, No. 1, 2009, pp. 44-57. doi:10.1038/nprot.2008.211
- H. Nawata, et al., “Estradiol-Independent Growth of a Subline of MCF-7 Human Breast Cancer Cells in Culture,” Journal of Biological Chemistry, Vol. 256, No. 13, 1981, pp. 6895-6902.
- B. Manavathi, et al., “An Inherent Role of Microtubule Network in the Action of Nuclear Receptor,” Proceedings of the National Academy of Sciences of the United States of America, Vol. 103, No. 43, 2006, pp. 15981-15986. doi:10.1073/pnas.0607445103
- U. Banerji, “Heat Shock Protein 90 as a Drug Target: Some Like It Hot,” Clinical Cancer Research, Vol. 15, No. 1, 2009, pp. 9-14. doi:10.1158/1078-0432.CCR-08-0132
- T. C. Skaar, et al., “Two-Dimensional Gel Electrophoresis Analyses Identify Nucleophosmin as an Estrogen Regulated Protein Associated with Acquired Estrogen-Independence in Human Breast Cancer Cells,” Journal of Steroid Biochemistry and Molecular Biology, Vol. 67, No. 5-6, 1998, pp. 391-402. doi:10.1016/S0960-0760(98)00142-3
- S. Khurana, et al., “The Actin-Binding Protein, Actinin Alpha 4 (ACTN4), Is a Nuclear Receptor Coactivator That Promotes Proliferation of MCF-7 Breast Cancer Cells,” The Journal of Biological Chemistry, Vol. 286, No. 3, 2010, pp. 1850-1859.
- G. Odabaei, et al., “Raf-1 Kinase Inhibitor Protein: Structure, Function, Regulation of Cell Signaling, and Pivotal Role in Apoptosis,” Advances in Cancer Research, Vol. 94, 2004, pp. 169-200.
- K. Yeung, et al., “Suppression of Raf-1 Kinase Activity and MAP Kinase Signalling by RKIP,” Nature, Vol. 401, No. 6749, 1999, pp. 173-177. doi:10.1038/43686
- D. Nagakubo, et al., “DJ-1, a Novel Oncogene Which Transforms Mouse NIH3T3 Cells in Cooperation with ras,” Biochemical and Biophysical Research Communications, Vol. 231, No. 2, 1997. pp. 509-513. doi:10.1006/bbrc.1997.6132
- R. H. Kim, et al., “DJ-1, a Novel Regulator of the Tumor Suppressor PTEN,” Cancer Cell, Vol. 7, No. 3, 2005, pp. 263-273. doi:10.1016/j.ccr.2005.02.010
- Y. Huang, et al., “The Angiogenic Function of Nucleolin Is Mediated by Vascular Endothelial Growth Factor and Nonmuscle Myosin,” Blood, Vol. 107, No. 9, 2006, pp. 3564-3571. doi:10.1182/blood-2005-07-2961
- S. Soundararajan, et al., “The Nucleolin Targeting Aptamer AS1411 Destabilizes Bcl-2 Messenger RNA in Human Breast Cancer Cells,” Cancer Research, Vol. 68, No. 7, 2008, pp. 2358-2365. doi:10.1158/0008-5472.CAN-07-5723
- J. M. Cuezva, et al., “The Biogenetic Signature of Cancer: A Marker of Tumor Progression,” Cancer Research, Vol. 62, No. 22, 2002, pp. 6674-6681.
- I. M. Willers, et al., “Selective Inhibition of β-F1-ATPase mRNA Translation in Human Tumours,” Biochemical Journal, Vol. 426, No. 3, 2010, pp. 319-326. doi:10.1042/BJ20091570
- D. R. Littler, et al., “The Intracellular Chloride Ion Channel Protein CLIC1 Undergoes a Redox-controlled Structural Transition,” Journal of Biological Chemistry, Vol. 279, No. 10, 2004, pp. 9298-9305. doi:10.1074/jbc.M308444200
- E. F. Rocnik, et al., “Functional Linkage Between the Endoplasmic Reticulum Protein Hsp47 and Procollagen Expression in Human Vascular Smooth Muscle Cells,” Journal of Biological Chemistry, Vol. 277, No. 41, 2002, pp. 38571-38578. doi:10.1074/jbc.M206689200
- M. D. Welch, A. Iwamatsu and T. J. Mitchison, “Actin Polymerization Is Induced by Arp2/3 Protein Complex at the Surface of Listeria Monocytogenes,” Nature, Vol. 385, No. 6613, 1997, pp. 265-269. doi:10.1038/385265a0
- Z. Wen, Z. Zhong and J. E. Darnell, “Maximal Activation of Transcription by Stat1 and Stat3 Requires Both Tyrosine and Serine Phosphorylation,” Cell, Vol. 82, No. 2, 1995, pp. 241-250. doi:10.1016/0092-8674(95)90311-9
- J. A. Lavigne, et al., “The Effects of Catechol-O-Methyltransferase Inhibition on Estrogen Metabolite and Oxidative DNA Damage Levels in Estradiol-Treated MCF-7 Cells,” Cancer Research, Vol. 61, No. 20, 2001, pp. 7488- 7494.
- H. C. Guldberg and C. A. Marsden, “Catechol-O-Methyl Transferase: Pharmacological Aspects and Physiological Role,” Pharmacological Reviews, Vol. 27, No. 2, 1975, pp. 135-206.
- L. C. Zacharia, et al., “2-Hydroxyestradiol Is a Prodrug of 2-Methoxyestradiol,” Journal of Pharmacology and Experimental Therapeutics, Vol. 309, No. 3, 2004, pp. 1093- 1097. doi:10.1124/jpet.103.062505
- J. Kassis, et al., “Tumor Invasion as Dysregulated Cell Motility,” Seminars in Cancer Biology, Vol. 11, No. 2, 2001, pp. 105-117. doi:10.1006/scbi.2000.0362
- I. G. Wool, “Extraribosomal Functions of Ribosomal Proteins,” Trends in Biochemical Sciences, Vol. 21, No. 5, 1996, pp. 164-165.
- R. Comitato, et al., “A Novel Mechanism of Natural Vitamin E Tocotrienol Activity: Involvement of ERβ Signal Transduction,” American Journal of Physiology—Endocrinology and Metabolism, Vol. 297, No. 2, 2009, pp. E427- E437. doi:10.1152/ajpendo.00187.2009
- S. Mann, et al., “Estrogen Receptor Beta Expression in Invasive Breast Cancer,” Human Pathology, Vol. 3, No. 1, 2001, pp. 113-118. doi:10.1053/hupa.2001.21506
- P. A. Everley, et al., “Enhanced Analysis of Metastatic Prostate Cancer Using Stable Isotopes and High Mass Accuracy Instrumentation,” Journal of Proteome Research, Vol. 5, No. 5, 2006, pp. 1224-1231. doi:10.1021/pr0504891
- W. C. Merrick, “Mechanism and Regulation of Eukaryotic Protein Synthesis,” Microbiological Reviews, Vol. 56, No. 2, 1992, pp. 291-315.
- E. R. Levin, “Integration of the Extranuclear and Nuclear Actions of Estrogen,” Molecular Endocrinology, Vol. 19, No. 8, 2005, pp. 1951-1959. doi:10.1210/me.2004-0390
- [61] R. X. D. Song and R. J. Santen, “Membrane Initiated Estrogen Signaling in Breast Cancer,” Biology of Reproduction, Vol. 75, No. 1, 2006, pp. 9-16. doi:10.1095/biolreprod.105.050070