Open Journal of Air Pollution
Vol.07 No.01(2018), Article ID:82999,46 pages
10.4236/ojap.2018.71004
Climatology of Air Quality in Arctic Cities―Inventory and Assessment
Nicole Mölders1, Gerhard Kramm2
1Department of Atmospheric Sciences, Geophysical Institute, University of Alaska Fairbanks, Fairbanks, AK, USA
2Engineering-Meteorology-Consulting, Fairbanks, AK, USA

Copyright © 2018 by authors and Scientific Research Publishing Inc.
This work is licensed under the Creative Commons Attribution International License (CC BY 4.0).
http://creativecommons.org/licenses/by/4.0/


Received: November 30, 2017; Accepted: March 11, 2018; Published: March 14, 2018
ABSTRACT
Freely available data of sulfur dioxide (SO2), ammonia (NH3), nitrogen dioxide (NO2), ozone (O3), and particulate matter (PM) observed in Arctic cities (north of 59.99 N) between 1972 and 2016 were compiled into an air-quality inventory of samples taken for limited periods. For cities with multiple years of data, air-quality climatology was determined in terms of daily means in the annual course. Mean urban air-quality climatology was calculated for regions of similar insolation, emission standards, topography, Köppen-Geiger classification, and city size. Urban concentrations of PM precursors (SO2, NH3, NO2), PM2.5 and PM10 (PM with diameter less than 2.5 and 10 μm) were assessed in the sense of climatology with evidence from current knowledge. Typically, annual SO2 and NO2 means were lower for small than large Arctic cities, but can vary more than an order of magnitude over short distance. Cities seeing seasonal sea-ice had W-shaped mean annual courses of daily O3, while other cities had a spring maximum. Typically, annual means of urban pollutants in North America exceeded those in Scandinavia except for O3, where the opposite was true. Annual mean urban PM2.5 and PM10 concentrations varied from 1.6 to 21.2 μg∙m−3 and 2 to 18.2 μg∙m−3, respectively. Since PM10 encompasses PM2.5, annual PM10 means must be at least 21.2 μg∙m−3. According to rural-to-urban ratios of species, seasonal transport of pollutants from wildfires, shipping, and the Kola Peninsula mining area occurred at some sites in Interior Alaska, western and northern Norway, respectively. Concurrent SO2 and PM or NO2 and PM measurements revealed combustion or traffic as major contributors to urban concentrations. Recommendations for potential future measurements of Arctic urban air quality were given based on the assessments of climatology and inventory.
Keywords:
Air Pollution in Arctic Cities, Urban Air Quality in the Arctic, Air-Quality Climatology in the Arctic, Arctic Air-Quality Inventory, Arctic Cities

1. Introduction
Urban air quality in the Arctic is not well understood for various reasons. First, meteorological and chemical measurements are challenging. Network maintenance to keep instruments functional is high due to low temperatures and icing. Energy supply for the sites must come from the electricity grid; batteries freeze in the extremely cold conditions; low or even the lack of insolation prohibits solar energy. Fossil-fuel consuming transportable generators, as often applied during special field campaigns, are unsuitable for long-term monitoring. Such generators would also affect air-quality measurements by their own emissions. Second, in the North American Arctic, many communities are off the road network requiring expensive travel by boat or small aircraft for network maintenance [1] . Third, population density is low. Cities are small and often the only anthropogenic emission source in a wide radius [2] . Only few taxpayers would benefit from research. Therefore, securing funding is difficult, and pollutant monitoring is sparse along the Arctic Ocean [3] . In the Arctic, most observational data were collected in protected areas like natural reserves, National Parks, wilderness areas, or at low populated research stations (e.g. [4] ) where remote pristine air for reference and/or changes therein have been of interest.
Given these challenges, it is no surprise that most urban air quality, environmental exposure and health outcome studies have focused on large urban centers and megacities [5] . They revealed that major urban health adverse pollutants are particulate matter (PM), mainly inhalable in the micron- to sub-micron fractions, ozone (O3) and volatile organic compounds (VOC) [6] [7] . Particulate matter increases the risk of respiratory, allergic and oncological diseases due to its toxic compounds (e.g. polyaromatic hydrocarbons (PAH), heavy metals, microorganisms) [8] . Exposure to high PM concentrations causes about 30% of respiratory diseases [9] . A systematic study on non-occupational exposure to wildfire smoke―a major air-quality issue in Boreal forest―linked wildfire smoke with increased risks of respiratory disease, cardiovascular diseases and mortality [10] . A 1995-2000 study at Drammen, Norway (60,145 inhabitants, 59.7441N, 10.2045E) related PM of diameter less than 10 mm (PM10), nitrogen dioxide (NO2), sulfur dioxide (SO2), O3, benzene, formaldehyde, and toluene with acute hospital admissions for respiratory diseases [11] . Data of observed PM of diameter less than 2.5 μm (PM2.5), NO2 and carbon monoxide (CO) and hospital emergency-room visits in Helsinki (1,231,595 inhabitants, 60.1699N, 24.9384E) revealed that respiratory impacts of air pollution differed by age group; children showed symptoms later than elderly people did [12] .
Results from urban air-quality studies in mid and low latitudes are difficult to transfer to Arctic cities because of the quite different physical and chemical environmental conditions. In winter, for instance, low or the lack of solar insolation limits or excludes photochemical activity. Thus, nighttime chemical processes become dominant. In summer, daytime chemistry dominates due to the midnight sun. Solar radiation is also a key factor needed for PM formation [13] .
In winter, radiative cooling and subsidence in high-pressure systems cause frequently inversions [14] . Valleys and fjords often experience inversions under weak synoptic forcing [15] [16] [17] . The resulting stable stratifications suppress vertical mixing of the polluted air close to the ground with the usually cleaner air aloft. Consequently, primary and secondary pollutants accumulate in the urban atmospheric boundary layer (ABL) [16] [17] [18] .
Extremely low temperatures mean high per-capita energy consumption, large numbers of heating-degree days, motor-vehicle inefficiencies, high vehicle emissions due to cold-engine starts, and driving of short distances. Due to limited or lack of solar insolation, trace gases like dinitrogen pentoxide (N2O5), NO2, or O3, which would photo-dissociate under sufficient light conditions, accumulate in the urban ABL. The relative long residence time enables transport over hundreds of kilometers even in the ABL.
Gas-phase and aqueous-phase chemistry, aerosol physics and chemistry, and contaminant removal processes (e.g. wet and dry deposition) depend on temperature, humidity, precipitation, and actinic fluxes. Due to the even in summer often low temperatures, peroxyacyl nitrates (PAN) serve as reservoir for nitrogen oxides (NOx = NO + NO2, where NO is nitric oxide). PAN can be transported over long distances, until the air warms up and PAN transfers to NOx [19] . Then, chemical processes may occur in pristine areas far away from emission sources [20] . Indirect impacts of the harsh weather conditions exist due to the temperature-dependency of biogenic emission fluxes, as well as the frequency of wildfires, windy or stagnant situations, and convection that lifts pollutants in the free troposphere.
In summer, many Arctic cities experience seasonal exposure to smoke from Boreal wildfires; in late summer/early fall, Arctic shipping contributes to coastal Arctic communities’ air pollution [3] . According to WRF/Chem simulations, ship emissions along the Norwegian coast, for instance, enhanced the 15-day-averaged near-surface concentrations of SO2, NOx, O3, and PM2.5 about 80%, 80%, 5%, and 10% at coastal sites [21] .
In spring and fall, O3 precursors (e.g. CO, NOx, PAN), VOC, and aerosols emitted in mid latitudes are transported into the Arctic [22] [23] [24] . This transport causes a peak of total aerosol mass concentrations in winter/spring―known as Arctic haze [22] [25] . Arctic haze forms from swelling of sub-micrometer non-sea-salt sulfate particles and sea salt with small amounts of ammonium, nitrate, dust, trace elements of combustion, and residuals of particulate organic matter. From a thermodynamic aspect, fog and ice-fog formation weaken the strength of surface-based inversions. However, at high latitudes, ice fog often lacks the sufficient thickness to destroy the inversion [26] .
Regional climate and weather differ among Arctic cities depending on their location with respect to the semi-permanent high-pressure systems, major storm tracks, elevation above sea level, local topography, distance to the coast, the presence or absence of temperate ocean streams and/or seasonal sea-ice. During daylight hours, the high solar albedo of sea-ice, snow and Arctic haze may enhance actinic fluxes thereby triggering photochemistry [20] . During summer, high Sun elevation, long daylight periods, and dark surfaces favor shortwave forcing of local weather under weak synoptic conditions; in winter, snow/ice covered surfaces and low solar insolation, or even darkness favor the longwave exchange between the ground and atmosphere, and radiative forcing governs local weather under calm wind conditions [14] .
Despite of these substantial differences of chemistry and meteorological conditions compared to mid or low latitude cities, only few studies addressed Arctic urban air quality; typically they focused on issues of one individual city and species. For instance, in Fairbanks (32,751 inhabitants, 64.843611N, 147.723056W) observed daily means of PM2.5 concentrations are higher during the wildfire season than in the shoulder seasons [27] . Between November and February observed daily means frequently exceeded the United States (US) 24-h National Ambient Air Quality Standard (NAAQS) of 35 μg∙m−3 under calm wind, extremely low temperature (≤−20˚C) and moisture (water-vapor pressure < 2 h Pa) conditions during multiday inversions [17] . Mobile measurements in the broader Fairbanks metropolitan area revealed appreciable differences in PM2.5 concentrations between residential neighborhoods, downtown, and business districts as well as neighborhoods with wood and diesel oil as major heating fuels [28] .
Some Arctic urban air-quality studies assessed the potential benefits from local emission-control measures. According to WRF/Chem results for the Fairbanks nonattainment area, replacing wood-burning by gas or exchanging old wood-stoves by more efficient ones would reduce the 5-year center-year averaged annual 98th percentile 24-h average PM2.5 concentrations by 13%, and 5% [29] . Use of low-sulfur fuel in oil-fired furnaces and facilities would reduce total SO2 and PM2.5-emissions by 23 and 15%, respectively, and reduce PM2.5 concentrations by 4%. Concurrent exchange of woodstoves and introduction of low-sulfur fuel would reduce SO2 and PM2.5-emissions by 36 and 19%, respectively, and PM2.5 concentrations by 12%. Emission-control measures reducing precursor gases are most sensitive to meteorological conditions. Air-quality benefits of multiple emission-control measures fail to add up as the sum of benefits gained by the respective single emission-control measures [29] . At Kuopio, Finland (112,158 inhabitants, 62.8980N, 27.6782E), increased use of biofuels in traffic, local heat and power plants, increased residential wood heating, and improved energy efficiency of residences could reduce annual mean PM2.5 concentrations by 4% [30] .
The goals of our study are: 1) to establish an urban air-quality inventory for the Arctic based on public available data of SO2, ammonia (NH3), NO2, O3, PM2.5 and PM10 on the internet; 2) identify air-quality climatology for regions of common features; as well as 3) analyze and assess Arctic urban air-quality based on current knowledge. Such air-quality climatology and air-quality inventory are necessary steps towards understanding of Arctic urban air-quality related health issues.
2. Experimental Design and Methodology
2.1. Data Sources and Processing
Data of SO2, NH3, NO2, O3, PM2.5 and PM10 from 92 sites north of 59.99N were downloaded from the European Monitoring and Evaluation Program database (EMEP) [31] , Global Monitoring Division (GMD) database, Interagency Monitoring of Protected Visual Environments (IMPROVE) network, National Air Pollution Surveillance (NAPS) network, and Canadian Aerosol Baseline Measurement (CABM) Program. Hereafter, this area and the cities therein are called Arctic and Arctic cities, respectively. Between 1972 and 2016, SO2 was measured at 20 urban and 29 rural sites. NH3 was observed at 16 sites, seven of them were urban. NO2 data exist for 17 urban and 12 rural sites. Ozone was recorded at 24 urban, five research stations, and 12 rural sites. There were 11, 12, 8, and 8 sites with concurrent NO2 and PM10, NO2 and PM2.5, SO2 and PM10, and concurrent SO2 and PM2.5 observations, respectively.
Canada, Russia, Norway, Denmark, Finland, Iceland and Sweden use mass per volume, while the US reports gases in parts billion (ppb). Since at most sites, the measurements of gaseous and particulate matter were not accompanied by adequate meteorological observations, standard conditions (ppb∙molecular mass (in g∙mol−1) per molar volume (L) = 2.62, 1.88 and 1.96 μg∙m−3 for SO2, NO2, and O3, respectively, at 1 atm and 25˚C) were assumed to convert data reported in ppb to μg∙m−3. Error propagation analysis showed that the error for 1 ppb due to this approximation remains less than 0.002 μg∙m−3 at temperatures above −50˚C and air pressures between 960 and 1040 hPa. In this pressure range, errors are less than 0.0002 μg∙m−3 at temperatures between 15˚C and 35˚C. This means uncertainty due to the above approximation is less than the typical measurement accuracy, even at high concentrations.
Since the data were collected with different purposes in mind, data cover periods of varying lengths and at different periods of time. Some data, for instance, were collected to assess violations of national ambient air quality standards. Often, data were recorded only during the season of NAAQS violation; at rural Arctic sites, various species were measured for different short periods within the framework of research projects or field campaigns. For many cities, data exist only for two years or less during 1972 to 2016. At various sites, monitoring resolution and/or equipment changed over time. Some data were available as weekly means, 3-in-1 data, daily means, and even hourly means.
Unfortunately, many databases still use the practice to just leave out dates of days, for which no observations are available instead of listing the date and indicating that all data are missing. Leaving out days without observations can provide wrong impressions on the representativeness of the observations for the period as it under-reports the actual amount of missing data. However, like for model-evaluation applications, establishing climatology requires a continuous dataset in time to determine means. Thus, an important aspect of our data processing encompassed examination of measurements for being in continuous daily order to ensure comparison of data from different sites and of different species at the same site. We converted all data to continuous datasets marking days with missing data as such. We discarded corrupt or bad quality data and marked them as missing. No interpolation was made for missing data.
We aggregated/disaggregated the observations to daily means; i.e. daily means were calculated from hourly data, and the values of weekly means were assigned to all days of the week, for which the mean was given. Analogously, 3-in-1 data were assigned to their respective period.
2.2. Compilation of an Arctic Urban Air Quality Inventory
Obviously, the overall data situation prohibits investigations of air quality at the process scale, discussions of individual events and/or changes in air quality at scales larger than a year. Between 1972 and 2016, emission standards changed [32] . The consequent changes in emission amounts as well as shifts in the ratios of emitted species altered the concentrations. Due to altered concentration ratios, different paths of reactions may be favored with further impact on concentrations. Consequently, observed concentrations have changed with changes in emission standards. Since many emissions, chemical reactions, transport, and atmospheric removal of pollutants are sensitive to the meteorological conditions, variations within a climatology period always occur [33] . Too few observations exist in Arctic cities to construct two independent climatology periods that would permit change analysis.
To establish an Artic urban air-quality inventory, and baseline climatology under various aspects, we considered the available data as a sample following [34] . For each site and all species, we calculated annual means, and their standard deviations. For sites with more than one year of observations, we calculated the mean annual course based on all available data for each day in the annual course. Following [35] , the temporal standard deviations were assumed as interannual variability.
2.3. Determination of Arctic Regional Urban Air-Quality Climatology
Hydro-meteorological, geographic, and other conditions affect urban air quality. Therefore, we grouped the available data by city size (number of inhabitants), Köppen-Geiger climate classification, elevation, insolation (function of latitude), and emission standards (Scandinavia vs. North America). We calculated daily and annual means, mean annual courses, and their standard deviations based on data of all sites belonging to the same group. In the following, cities with less than 1000, 1000 to 10,000, and more than 10,000 inhabitants are called small, mid-size and large cities, respectively.
2.4. Assessment of Arctic Urban Air-Quality
In analyzing the Arctic urban air-quality inventory, we focused on identifying common features in the (mean) annual courses, (mean) daily concentrations and annual means among sites. Analysis of Arctic urban air-quality climatology focused on elaborating differences in urban air quality among groups.
Exceedance limits have differed among the eight Arctic countries (Canada, Denmark, Finland, Iceland, Norway, Russia, Sweden, US), and changed over time [32] due to regular re-evaluation. Currently, most NAAQSs are more restrictive in the EU than in the US [32] . In the EU, for instance, current daily mean SO2 concentrations are not to exceed 125 μg∙m−3 on more than 3 d/yr, while annual means of NO2 must not exceed 40 μg∙m−3; O3 is not to exceed a maximum daily 8-h mean of 120 μg∙m−3 on more than 25 d/yr. Annual mean PM2.5 must not exceed 25 μg∙m−3; daily mean PM10 must not exceed 50 μg∙m−3 on more than 35 d/yr.
An overall assessment of Arctic urban air quality requires common pan-Arctic air-quality standards. Therefore, we used the World Health Organization [36] guidelines for annual means in the assessment of Arctic urban air quality. For the same reasons, we examined concentration-frequency distributions to assess overall urban air quality rather than the number of exceedances.
We calculated the distance between cities and their closest rural site. When this distance was less than 150 km, the rural site was considered as the city’s proxy for “background concentrations”. Note that the rural site is not necessarily upwind of the closest city all the time. The distance threshold was chosen because of the sparse data availability in the North American Arctic. In Scandinavia, the closest rural site was typically within much less than 100 km of the city.
For cities having their closest rural site within 150 km, we determined the background (B) to urban (U) ratios of daily mean concentrations (B/U) for periods with concurrent observations of the same species. These ratios can provide insight in the contributions from local sources Clocal [37] [38] . Under the assumptions U ≥ B and U = B + Clocal, the fraction from local emission is Clocal/U =1 − B/U. Multiplication with 100% gives the percentage. For U < B, it is assumed that the rural site is in the downwind of major sources. In this case, the equation provides a negative value. Multiplied by −100%, it gives the percentage by which rural daily means exceeded those observed in the city.
We analyzed these ratios in their annual courses to assess the impact of urban emissions. Low ratios of background-to-urban PM10 concentration indicate strong contribution of local urban sources to the urban pollution and vice versa. Differences between urban and background concentrations were examined for statistical significance at the 95% confidence level using a two-tailed t-test [39] . We used the word “significant” only within this context.
Particulate matter has natural (e.g. sea spray, desert and soil dust), and anthropogenic sources, and can form in air by gas-to-particle conversion from precursor gases [20] . Thus, PM is a composite of different species of different mass. On the contrary, SO2 is a specific marker of pollution from coal combustion. NO emitted by traffic and other combustion processes may oxidize in the atmosphere to NO2. To further assess sources, we examined the correlations between NO2 and PM, as well as SO2 and PM at sites with concurrent measurements of these species. Again, we tested results for statistical significance.
Near-surface O3 can stem from downward transport of stratospheric O3 or by photochemistry. In the presence of sunlight and chemical precursors like NOx and VOC, photochemical processes form O3 in the atmosphere; reactions with NO, NO2 and O3 photolysis, deposition on the ground, and aqueous chemistry are sinks for O3. In the lower troposphere, photolysis of NO2 produces NO and ground state oxygen atoms (O). Reaction of O with two-atomic oxygen molecules and a third molecule M leads to O3 and M. In the presence of NO, O3 reacts with NO to rebuild NO2. In the absence of CO or organic compounds, O3 is recycled (Null cycle), i.e. concentrations remain constant (photo-stationary state). Photolysis of O3 produces additional radicals which react with CO or organic species to produce additional O3. One of the O3 photolysis processes produces an excited oxygen atom of which most are deactivated by collisions and contribute to O3 formation. The remaining excited oxygen atoms react with hydroxyl (HO) radicals, the “detergents” of the atmosphere. Reactions of HO with CO and organic compounds produce peroxy radicals. Peroxy radicals compete with O3 in oxidizing NO to NO2. The initial reaction of an organic chemical and a HO produces two O3 molecules and a carbonyl species under high enough NOx concentrations. The carbonyl compounds may react with HO or photolyze thereby leading to more peroxy radicals, which further react to produce more O3. Formation of peroxides removes NO2 and HO to form nitric acid (HNO3). Since HNO3 reacts slowly and is rapidly removed by dry and wet deposition, NOx returns are marginal. Peroxides and HNO3 may photolyze to recycle HOx radicals.
To assess the origin of urban O3, we examined the ozone budget in its simplest expression (Ox = NO2 + O3) for sites with concurrent NO2 and O3 observations. Typically, O3 accounts for over 90% of Ox, for which the budgets of O3 and Ox can be viewed as equivalent [40] . Over short time periods, Ox is a conservative quantity due to the fast interconversion of O3, NO, and NO2 as described above. Thus, frequency distributions of Ox can serve to examine the representativeness of a site. Comparison of the distributions permits assessment of the amount of O3 loss from NO titration [41] . Large differences between the O3 and Ox distributions would indicate local NOx emissions.
Unfortunately, at many sites, only PM or one species was observed during a period (cf. Table A1). Consequently, impacts of chemical reactions on observed concentrations cannot be quantified, but still can be discussed qualitatively under consideration of knowledge from the literature and model studies performed in some areas using WRF/Chem. Similar is true for pollutant removal and emissions. Therefore, we discussed mean annual courses of daily species and PM concentrations in the sense of climatology using existing knowledge of atmospheric, physical and chemical processes, as well as human and technical behavior (e.g. heating, cold start emissions, low load engine behavior).
Since at many sites, no meteorological measurements were available, we used the Köppen-Geiger climate classification [42] and composites of National Centers of Environmental Prediction (NCEP) reanalysis [43] as proxy for discussion of local weather climatology related impacts on air quality.
3. Results and Discussion
In the following, we discussed the compiled urban air-quality inventory, site air-quality climatology, and urban air-quality climatology determined for the aforementioned groups concurrently to avoid redundancies. Since only few sites have concurrent measurements of various species and PM, we discussed our results by species and PM-size. Analysis of concurrently observed species followed after both species were discussed.
Figure 1 shows the solar insolation at the top of the atmosphere in the annual course as a function of latitude; the Köppen-Geiger classification, the mean summer and winter climatology as determined for 1972 to 2016 from NCEP reanalysis data, and the site locations. Table A1 lists species and years of availability at the sites. In the following, we use the symbol of the trace gas X instead of the trace gas concentration [X] for ease of readability.
3.1. Arctic Weather Regimes
The Köppen-Geiger classification uses a three-letter coding except for polar tundra (ET) and forest (EF) climates. Besides polar climates, warm temperate (C), and snow (D) climates exist in our study area (Figure 1(b)). These climates are subdivided according to their annual precipitation (second letter) and temperature (third letter) characteristics. The letters f, s, and w, stand for fully humid, dry summer, and dry winter, respectively. Furthermore, b, c, and d indicate warm summer, cool summer, and extremely continental conditions. Figure 2 shows examples of the conditions in Arctic cities for the most frequent climate classes.
In the North American Arctic, seasonal sea-ice exists along the coasts of the Bering Sea, Arctic Ocean, and Hudson Bay. The Aleutian low and Canadian high govern Alaska’s weather. East of the Rocky Mountains, the Canadian High governs the weather in the Canadian Arctic (Figure 1(c), Figure 1(d)). In spring, fall and winter under conditions governed by lows, moist and warm maritime air flows into Alaska bringing heavy precipitation along the upwind coasts. Such humid conditions favor aerosol formation, while precipitation removes contaminants from the atmosphere [14] . Occasionally, fall storms enter Interior Alaska via the Bering Sea with strong snowfall and winds. A cold high-pressure

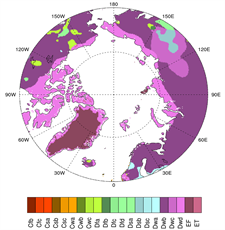
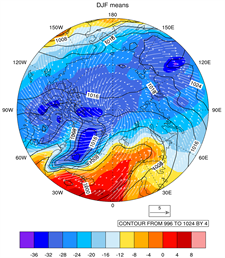
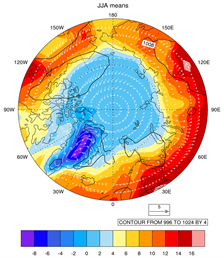
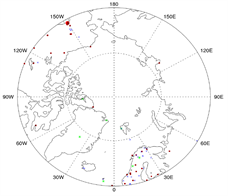
Figure 1. Study area and air-quality related characteristics: (a) Annual evolution of incoming solar radiation at the top of the atmosphere (TOA); (b) Köppen-Geiger classification; Reanalysis data based 1972-2016 climatology of mean near-surface air temperature (color shades), sea-surface pressure (contour lines), wind speed and direction (curly arrows) for (c) June-July-August (JJA), and (d) December-January-February (DJF); (e) Location of sites considered in this study. Red, green and blue symbols indicate cities, research stations/labs and background sites. For discussion of Köppen-Geiger classification see Section 3.1.

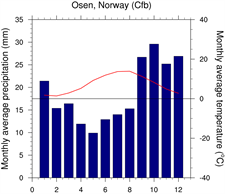

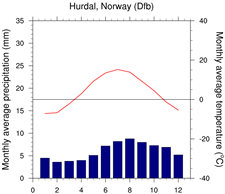
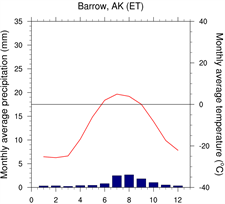
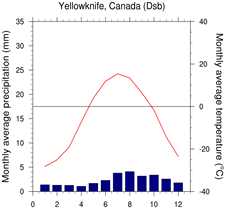
Figure 2. Examples of monthly mean temperature and accumulated precipitation for Arctic cities in (a) Cfb; (b) Cfc; (c) Dfb; (d) Dfc; (e) Dsb; and (f) ET climates.
dome over Alaska keeps lows over the ocean; areas along the Gulf of Alaska receive notable frontal and upslope precipitation. Blocking highs with center in the Yukon Territory produce very cold air with ice fog via radiative cooling and push lows far to the south or north. In winter, often a cold high-pressure dome over Canada pushes the Alberta storm tracks far south leading to dry, extremely cold conditions in the Canadian Arctic. Both cold domes and blocking highs are favorable for inversion formation and accumulation of pollutants [14] .
In summer, pressure gradients are on average low over the North American Arctic (Figure 1(d)), and a thermal low and ocean high influence the area. Under long-lasting dry conditions, thunderstorms ignite wildfires [27] [44] , which cause notable air quality issues. These meteorological conditions yield annual ranges of monthly mean temperatures that exceed 20 K (Figures 2(d)-(f)). The range increases landwards and is largest for Dwd climate. Individual minimum and maximum temperatures can differ more than 80 K already in Interior Alaska [45] (Dfc climate).
In the Arctic, Cfb and Cfc climates exist close to warm ocean currents (Figure 1(b)). In these regions, the polar front governs the weather year-round leading to variable, often humid and cloudy conditions. In western Scandinavia, the annual range of monthly mean temperatures amounts only 5 to 15 K (e.g. Figure 2(a), Figure 2(b)) due to the warm Gulf Stream. Thus, the western and northern Scandinavian coasts remain sea-ice free in winter, which contributes to humid conditions year-round.
On the contrary, the Baltic Sea freezes annually in the upper Gulf of Bothnia, and along the coasts of the lower Gulf of Bothnia and the Gulf of Finland. Thus, in eastern Scandinavia with increasing distance to the warm Gulfstream waters and glacier-covered mountains (that may cause Föhn, i.e. warming, in their downwind), the annual range of mean monthly temperatures is 20 to 30 K (e.g. Figure 2(c)).
Most of the low-pressure systems passing north of Scandinavia have storm tracks over the eastern Gulfstream, Newfoundland, and Lofat Strait. Storms originating from Greenland cross the Scandinavian Ridge. These storms advect polar maritime air, but occur less frequently than storms with other tracks. Storm tracks thru the mid Baltic Sea affect the weather in Finland.
Tiksi is the only Siberian site for which free data were found (Figure 1(e)). Like Barrow (Figure 2(f)), Tiksi is located at the Arctic Ocean where seasonal sea-ice occurs. Both cities have ET climate. Typically, in Tiksi, the Siberian High and thermal lows govern winter and summer weather, respectively. The difference between annual minimum and maximum temperatures exceeds 60 K. Siberian wildfires affect air quality in summer.
3.2. Analysis of Sulfur Dioxide Climatology
Annual mean concentration of SO2 are lowest in ET (0.3 ± 1.7 μg∙m−3), followed by Cfc (0.9 ± 1.8 μg∙m−3) and Cfb (1 ± 2.8 μg∙m−3) climate (Table 1). In Cfc and Cfb climate, the frequent storm systems can take up SO2 in the aqueous phase. Precipitation can remove dissolved SO2 and its aqueous phase reaction products [14] [20] . Consequently, SO2 concentrations remain low on annual mean. At Scandinavian sites in ET and EF climates, advection of SO2 from non-local sources can influence the annual means.
On average over all cities, annual mean SO2 concentration was 2.3 ± 40.47 μg∙m−3 vs. 1.3 ± 11.76 μg∙m−3 for the average background concentrations (Table 1). The high standard deviations indicate that urban (and background) air
Table 1. Annual mean concentrations and standard deviation of species for selected indicators. The symbol -.- indicates no data available for species in that category. The first line lists the WHO [36] recommended annual limits that we used as a common Pan-Arctic standard for urban air-quality assessment.
1Estimated baseline level. Daily mortality increases about 0.3% - 0.5% for every 10 μg∙m−3 increment in 8-h mean ozone concentrations above this estimated baseline level [36] .
quality vary over a wide range in the Arctic. Indeed, high and low annual SO2 concentrations occurred at both urban and rural sites alike (Figure 3(a)). Nevertheless, some general as well as distinct regional features exist. Generally, annual means of SO2 decreased with increasing latitude due to the decrease of anthropogenic sources in numbers and size. On average over all sites, annual mean SO2 was nearly 1.9 times higher in the North American than Scandinavian Arctic (Table 1). The higher allowable maximum sulfur content in diesel fuel and sulfur-content reductions becoming effective at later dates are major
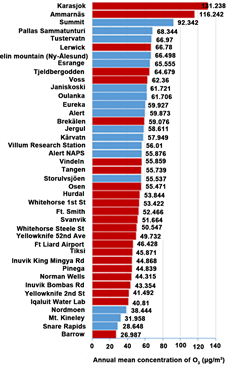
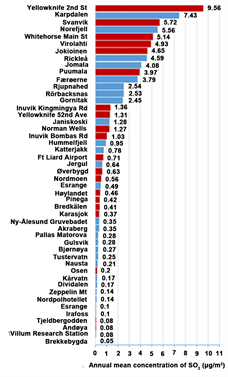
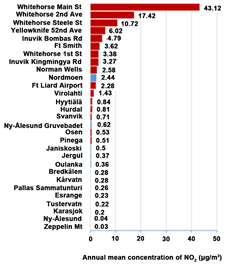
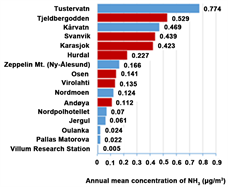
Figure 3. Inventory of annual mean urban concentrations of (a) SO2; (b) O3; (c) NH3; and (d) NO2 (red). Concentrations at rural sites (blue) are given for comparison.
reasons. In Sweden, for instance, the maximum allowed sulfur content in diesel was 50 ppm since 1990; production of diesel with maximum sulfur content of 5 ppm began in 1992. In North America, maximum allowable sulfur content in diesel for on-road traffic became 15 ppm in October 2006. Rural Alaska adopted this standard in 2010. Off-road diesel engines adopted 500 ppm and 15 ppm maxima in 2007 and 2012, respectively.
Annual mean SO2 concentrations vary more than three orders of magnitudes among sites (Figure 3(a)). Of all cities, Tjeldbergodden and Andøya had the lowest (both 0.08 μg∙m−3), while downtown Yellowknife had the highest annual mean SO2 concentration with 9.56 ± 339.84 μg∙m−3. These means are still below the means reported in [34] for European (12 μg∙m−3) and North American (13 μg∙m−3) non-Arctic cities. They are all below the WHO guideline of 50 μg∙m−3 [36] (Table 1). On average, annual means of SO2 were lowest for small, and highest for large Arctic cities. Out of the rural sites, Karpdalen and Brekkebygda had the highest (7.43 ± 161.83 μg∙m−3) and lowest (0.05 ± 0.01 μg∙m−3) annual means (Figure 3(a)).
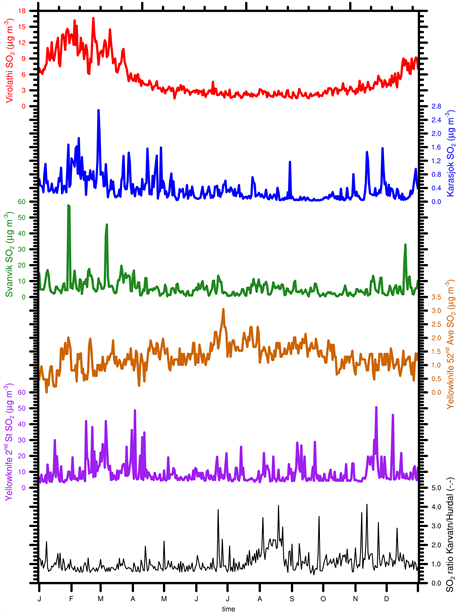
The Arctic urban air-quality inventory (Figure 3(a)) shows that annual urban mean SO2 can vary a factor 7 or so even over short distance depending on the vicinity of local emission sources. In both Yellowknife and Inuvik, for instance, two SO2 sites existed. At these sites annual means of SO2 differed by about 86% (8.25 μg∙m−3) and 24% (0.33 μg∙m−3) in Yellowknife and Inuvik, respectively. In Yellowknife, the annual course of daily SO2 means showed higher values in summer than winter at 52nd Ave, while at 2nd Street the opposite was true (Figure 4).
Huge differences over short distance also occurred among rural sites. In Spitsbergen, for instance, SO2 was observed at three locations. At Zeppelin Mt. and Nordpolhotellet, annual means were about half of the value at Gruvebadet that is close to the emissions from combustion for Ny-Ålesund research station heating and power generation. Here, cruise-ship traffic is another source from April to September [46] . At Akraberg, marine traffic is a major SO2 source year-round [47] .
There were three major types of mean annual courses of daily SO2 concentrations (Figure 4, Figure 5). At Hummelfjell, Hurdal (Figure 5), Karpdalen, Svanvik, and Yellowknife 2nd Street (Figure 4), and rural Akraberg, Gorniak, and Gulsvik, no distinct annual course existed. Instead, daily SO2 means varied depending on sources in their immediate upwind. At Virolahti (Figure 4), Bjørnøya, Bredkälen, Høylandet, Jokionien, Øverbygd, Pingea, and Puumala, daily means of SO2 peaked in February, decreased over summer with a minimum in late summer/early fall. A similar behavior was found at rural Jergul, Pallas Matorova, Kårvatn, Ny-Ålesund Gruvebadet, and Northpolhotelet. Karasjok (Figure 4) and Nausta showed major and minor peaks in daily means in February and May and a minimum in October. At Yellowknife 52nd Ave (Figure 4) and Norman Wells, daily SO2 means had a weak annual course with higher summer than winter means. Irafoss is a rural site with similar behavior.
The Norwegian cities Svanvik and Karpdalen, for instance, experience transboundary transport of pollution from the Murmansk-Norslik region on the Kola Peninsula. Here mining, briquette production, and metal processing industries cause high emissions of SO2, sulfate and other pollutants [48] . The 2009-2012 annual SO2 means were 87 ± 2.3 μg∙m−3, 89 ± 20.6 μg∙m−3, 7.3 ± 0.5 μg∙m−3 and 17.7 ± 3 μg∙m−3 at Zapoliarny (~25 km south of Karpdalen), Nikel (8 km southeast of Svanvik) (Table A2), Svanvik and Karpdalen, respectively [49] .
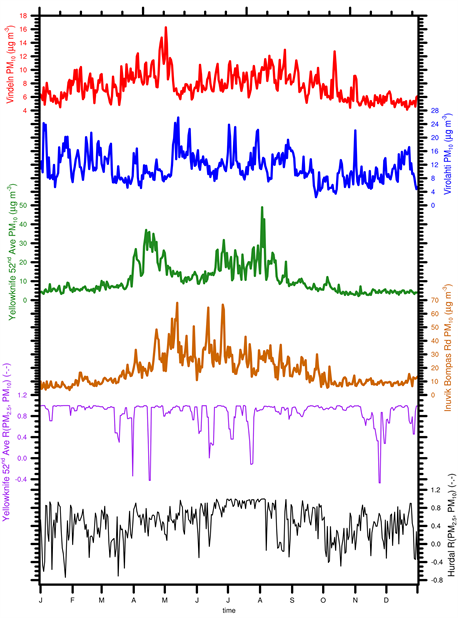
Figure 4. Mean annual courses of daily means of SO2 for Virolahti (red), Karasjok (blue), Svanvik (green), Yellowknife 52nd Ave (brown), and Yellowknife 2nd St (purple), and ratios of daily mean SO2 concentrations at rural Kårvatn to those in Hurdal (black). See text for cities (and rural sites) with similar annual courses. Y-axis labels differ among panels.
In this Norwegian-Russian border region, the 1972-2016 reanalysis wind climatology showed a distinct seasonal pattern (Figure 1(c), Figure 1(d)). In winter, winds from the south occurred more than half of the time. In summer, winds came from all directions, but those from south and north-east were pronounced, on average. Calm wind conditions occurred more often in winter than summer. Thus, emissions from Nikel caused elevated SO2 concentrations at Karpdalen during periods dominated by southeasterly winds. While the influence of the Murmansk-Norslik region’s emissions was visible in the annual cycle at Svanvik (Figure 4), their overall impact on air quality was less than in
Figure 5. Annual courses of daily means of maximum possible incoming solar radiation (red), and mean annual courses of observed daily means of O3 (blue), NO2 (green) SO2 (brown), PM2.5 (purple), and PM10 (black) at Hurdal.
Karpdalen, which confirms [49] . Southerly winds transport the pollution from the Nikel smelters towards the Barent Sea and Jarfjord Mountains away from Nikel.
The mean annual course of daily rural-to-urban SO2 ratios showed long periods with higher concentration at rural Kårvatn than at urban Hurdal (Figure 4). The same was true for Kårvatn and Tjeldbergodden. Daily means of SO2 at Tjeldbergodden correlated significantly with those at Kårvatn (Table 2). These sites are downwind of the shipping lane. Ships emit huge amounts of SO2 [21] [50] . While Tjeldbergodden is at the water, rural Kårvatn is in a valley at the end of a fjord. In fjords, inversions can cause accumulation of pollutants [51] . Hurdal is located on the other side of the Scandinavian Mountains, i.e. farther
Table 2. Correlation coefficients (R) of daily means of species measured concurrently at a city and its closest rural site, their distance from each other, and annual mean fractional contribution from local emissions to the total urban concentrations (positive values). Negative fractions indicate that background concentrations exceeded those in the city due to being in the downwind of major pollution sources. The absolute value of negative fractions gives the percentage by which background concentrations exceeded those in the city. Bold values indicate significant correlations (95% confidence).
downwind of the shipping lane, but it is in the downwind of Oslo under southern winds. These differences and Hurdal’s large distance to Kårvatn explain the low, but still significant correlation of the SO2 concentrations at these sites (Table 2).
3.3. Analysis of NH3 Climatology
Ammonia is mainly a primary basic gas, and a precursor for PM. It can neutralize 1) sulfate-related aerosol acidity to form ammonium-sulfate particles, and 2) nitric acid (HNO3; reaction product from NO2-OH chemistry see Section 3.4) to form ammonium-nitrate particles [52] . Sources of NH3 are agriculture, life stock, NH3-based fertilizer, biomass-burning, industrial processes, ship and vehicle traffic [50] [53] [54] as well as volatilization from oceans, dew and soils [55] [56] . Unfortunately, no NH3 observations were available for the North American Arctic.
On annual and Köppen-Geiger class mean, concentrations of NH3 were highest in Cfc climate, followed by Dfb and Dfc climate (Table 1). At coastal sites in Cfc and Cfb climates, large amounts of NH3 can stem from ship emissions along the Scandinavian coast. Annual means of NH3 were lowest in ET climate. Here, in summer, reindeer herds are potential local sources in the Scandinavian Arctic. Annual means of NH3 decreased with increasing latitude (Table 1). On average over all cities, annual mean NH3 was about 34% (0.073 μg∙m−3) higher than the annual mean background concentration. Vehicle traffic may be a contributing factor for this finding. Annual means of NH3 in Arctic cities ranged from 0.112 to 0.529 μg∙m−3, while rural annual means ranged from 0.005 to 0.774 μg∙m−3 (Figure 3(c)).
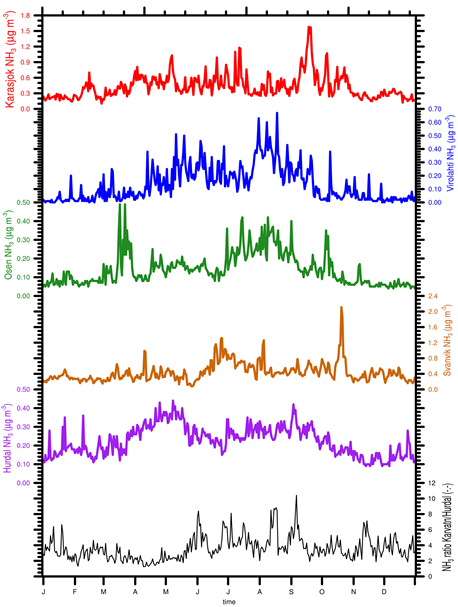
For all sites, daily NH3 means peaked in summer and were lowest during the cold season (Figure 6). The summer peak suggests emissions from natural sources and fertilizer as contributing sources. Ratios of Kårvatn to Hurdal daily means of NH3 exceeded 1 which may indicate NH3 advection to Hurdal. While at Kårvatn, the summer peak suggests contributions from rural sources, the year-round higher concentrations may be due to Kårvatn’s closer vicinity to ship emissions than Hurdal. In winter, west winds dominated (Figure 1(d)). They may push pollutants up the nearly west-east orientated fjord, in which Kårvatn is located. Here, inversions may lead to pollutant accumulation. Due to missing data, ratios of Kårvatn to Tjeldbergodden daily means of NH3 could only be determined for mid-October to December (not shown). Both higher and lower daily means of urban than rural NH3 concentrations occurred during this period. In Tjeldbergodden, berthing ships are local emission sources contributing to the urban NH3 concentrations.
3.4. Analysis of Nitrogen Dioxide Climatology
During daylight hours, NO2 photolysis occurs [20] which is stronger in summer due to the long daylight periods and higher solar insolation than in winter with short daylight periods and low insolation (if at all) (Figure 1(a), Figure 1(b)). When still or again enough sunlight exists, photolysis occurring in the pores of the upper layers of the snowpack can lead to NOx fluxes into the atmosphere [57] . In fall and early spring, the still high albedo of snow [58] can enhance photolysis rates close to the snow-surface as well [59] .
Differences in urban NO2 climatology between the North American and North European Arctic result from different population density, vehicle fleet, and emission standards. The North American Arctic has a lower population density than the European Arctic. North America’s vehicle fleet has a larger fraction of diesel engines, and stronger engines than the Scandinavian vehicle fleet. Emissions from cold starts are higher [60] and cold starts occur more frequently due to the colder winters in the North American than Scandinavian Arctic (Figure 1(c), Figure 1(d)).
Figure 6. Mean annual courses of daily means of NH3 for Karasjok (red), Virolahti (blue), Osen (green), Svanvik (brown), Hurdal (purple), and ratios of daily mean NH3 concentrations at rural Kårvatn to those in Hurdal (black). See text for cities (and rural sites) with similar annual courses. Y-axis labels differ among panels.
On average, annual NO2 means and standard deviations were about one and two orders of magnitude higher at sites in Dfb (6.8 ± 81.9 μg∙m−3) or Dsc (6.0 ± 33.6 μg∙m−3) than in Cfb (0.4 ± 0.2 μg∙m−3), Cfc (0.22 ± 0.1 μg∙m−3), Dfc (0.7 + 1.1 μg∙m−3), or ET (0.23 ± 0.01 μg∙m−3) climates (Table 1). In Dsc climate, however, summers are dry, often with clear sky. Thus, daily means of NO2 varied strongly between summer and winter due to the annual course of insolation (Figure 1(a)). For same main climate (given by the first letter) without dry season (index f), cold summers (index c) mean more cloudiness, reduced actinic fluxes and less photolysis leading to lower annual means of near-surface NO2 than found for warm summers (index b). Furthermore, NO2 means varied lessover the year in temperate (C) than continental (D) climate as in the latter the temperature range is much larger with consequences for emissions from heating and traffic.
Annual mean concentrations of all NO2 sites correlated 52% (R = 0.72) with population (Table 1). Generally, NO2 increased exponentially with increasing population (not shown). On average over all urban and rural sites, annual mean NO2 concentrations amount 5.7 ± 65.7 μg∙m−3 and 0.5 ± 0.61 μg∙m−3, respectively. Whitehorse Main St/1st Ave had the highest annual mean (43.12 μg∙m−3) (Figure 3(d)) and maximum (219.96 μg∙m−3) NO2 concentration. Minimum concentrations remained always below the annual mean background concentration averaged over all rural sites except the three NO2 sites in Whitehorse (1.9, 1.9, 3.8 μg∙m−3). Most of Whitehorse is surrounded by mountains. Thus, inversion may be a cause for the high urban minimum concentrations.
Depending on vicinity to major traffic routes, annual mean NO2 concentration varied appreciably even over short distance in cities (Figure 3(d)). In Whitehorse, for instance, observed annual means of NO2 reached 43.12 μg∙m−3 at a high traffic site, while only 3.38 μg∙m−3 at a suburban site.
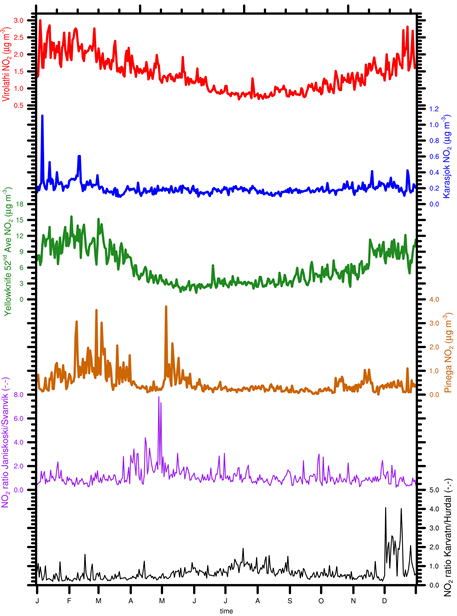
The mean annual course of daily NO2 concentrations followed a sinus-like curve with highest and lowest concentrations in DJF and JJA, respectively for the cities of Virolahti (Figure 7), Hurdal (Figure 5), Bredkälen, Nordmoen, Osen, Whitehorse, and rural Esrange, and Oulanka. In winter, emission from cold-starts at low temperatures [60] , and combustion for heating are high. The low to no solar insolation (Figure 1(a)) means low to no photolysis of NO2. Rural Esrange and Oulanka are about 45 km and 50 km east of Kiruna (18,148 inhabitants, 67.8558N, 20.2253E) and north of Kuusamo (15,673 inhabitants, 65.9646N, 29.1887E), respectively. The dominating southwesterly winds (Figure 1(d)) may advect pollutants from these cities to these rural sites leading to elevated NO2 concentrations.
Yellowknife (Figure 7), Inuvik, Norman Wells, Svanvik, and rural Kårvatn, Pallas Sammatunturi, and Trustervatn had their highest and lowest daily NO2 concentrations in November to February, and May, respectively. The spring onset of NO2 decrease can be due to the return of sunlight, high albedo of snow and enhanced photolysis in the presence of snow [57] [58] [59] . After summer solstice, solar insolation (Figure 1(a)) and hence photolysis rates decrease and NO2 concentrations slowly increase as summer progresses.
At Karasjok (Figure 7) and rural Janiskoski and Jergul, which are all located north of the Arctic Circle (66.34N), daily NO2 means were lower in the warm (May to September) than cold season (October to April). Here solar insolation (Figure 1(a)) and hence photolysis is absent for an elongated period in winter, and gradually increases and decreases in spring and fall, respectively. On the contrary, at the Spitsbergen sites, which are also north of the Arctic Circle, daily means of NO2 tended to be higher in summer than winter (not shown). In summer, cruise ships berth at Ny-Ålesund thereby emitting NOx among other
Figure 7. Mean annual courses of daily means of NO2 for Virolahti (red), Karasjok (blue), Yellowknife 52nd Ave (green), and ratios of daily mean NO2 concentrations at rural Kårvatn to those at urban Hurdal (brown), and at rural Janiskovski and urban Hurdal (purple). See text for cities (and rural sites) with similar annual courses. Y-axis labels differ among panels.
pollutants [61] . In winter, sea-ice prohibits ship traffic (Figure 1(e)) and station personal is down to about five.
Daily means of NO2 at Karasjok correlated significantly (R = 0.68) with those at rural Jergul (Table 2). Svanvik’s daily means of NO2 correlated weakly, but significantly with those at rural Janiskoski (R = 0.17). Background NO2 contributed 4% to the daily means at Karasjok, i.e. urban emissions made up about 96% of the annual total. At Svanvik, NO2 was 12% lower on annual average than at Janiskoski. Under east wind, Janiskoski is downwind of the Murmansk industrial complex, which is east-southeast of Svanvik. On the Kola Peninsula, southerly winds dominated in winter (Figure 1(d)). On average, advection of pollution affected Svanvik less than rural Janiskoski (Figure 7).
The ratios of rural-to-urban NO2 determined for Kårvatn and Hurdal, indicated dominance of urban sources in spring and fall, higher rural concentrations in summer and December. In winter, west wind and in summer southwest wind dominated (Figure 1(d)). Thus, Hurdal was often not in the downwind of Kårvatn.
3.5. Ozone
In Dfc, Dsb, Dsc, and ET climate regions (Figure 1(d)), annual O3 means were on average below 56 µg・m−3 (Table 1). Annual mean O3 exceeded 61 µg・m−3 in Cfb, Cfc, and Dfb climates. No notable correlations existed between annual mean concentrations of O3 and population numbers, latitude, or elevation (Table 1). Nevertheless, annual O3 means were higher at sites above 100 m above sea level than at sites below that level. On average over all cities, annual mean O3 concentration was about 2% lower than for the annual mean over all rural sites. Large cities had about 7% lower concentrations than medium size cities. On average, small cities had 18% higher O3 concentrations than cities with over 1000 inhabitants. Overall, nearly 27% of the time, daily means of O3 were 40 - 50 μg∙m−3 followed by 50 - 60 μg∙m−3 (~21%), and 30-40 μg∙m−3 (~16%). In less than 2% of the time, daily means exceeded 100 μg∙m−3.
Typically, annual means of O3 in Scandinavia exceeded those in North America (Table 1). It seems that the different dominant weather patterns are major reasons. In Scandinavia, the frequent Atlantic storms can promote downward transport of upper tropospheric O3. Cut-off lows can cause tropopause folding and subsequent intrusion of stratospheric O3 into the troposphere [62] . On the contrary, most of the North American O3 sites are north of the major storm tracks.
For the Arctic sites examined here (Table A1), mean annual courses of daily O3 showed three distinct shapes. At Summit in Greenland, daily O3 means peaked in summer and were lowest in winter (not shown). The high elevation (3216 m) and insolation (Figure 1(a)) are responsible for this pattern. Photolysis rates namely increase with height in the troposphere [63] . Due to the high albedo in the solar range, the Greenland ice shield may increase photolysis rates during daylight.
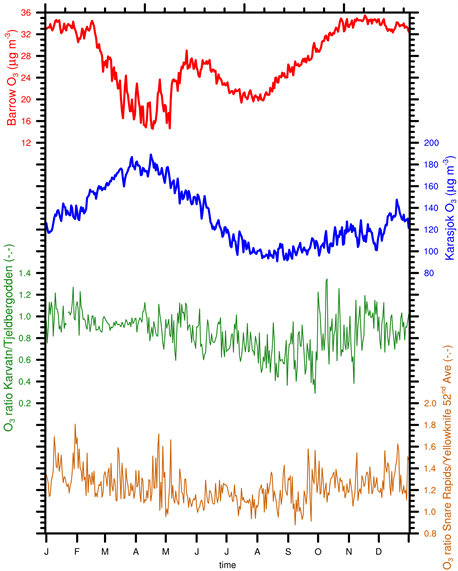
At the sites in Karasjok (Figure 8), Bredkälen, Ft. Liard, Ft. Smith, Hurdal, Inuvik, Lerwick, Norman Wells, Osen, Svanvik, Tangen, Tjeldbergodden, Vindeln, Voss, Whitehorse, and Yellowknife, the sites’ respective mean annual courses of O3 peaked in April and had a minimum in late summer/early fall. The mean annual courses at rural sites with similar geographic characteristics (e.g. Denali, Esrange, Kårvatn, Nordmoen, Snare Rapids, Zeppelin Mt.) looked similar. This finding suggests that solar insolation (Figure 1(a)) rather than local emissions
Figure 8. Mean annual course of daily means of O3 for Barrow (red), Karasjok (blue), and ratios of daily mean O3 concentrations at rural Kårvatn to those at the site in the city of Tjeldbergodden (green), and rural Snare Rapids to those in the city of Yellowknife 52nd Ave (brown). See text for cities (and rural sites) with similar annual courses. Y-axis labels differ among panels.
governed the O3 concentrations in those Arctic cities. As solar insolation increases in spring, still present snow leads to increased photolysis rates. Consequently, O3 went up (e.g. Karasjok in Figure 8). Once snowmelt sets on, albedo decreases [58] . Thus, photolysis rates decrease near the surface until summer solstice despite of the increasing insolation. Thereafter, solar insolation (Figure 1(a)) and daily means of O3 decreased (e.g. Figure 8). In summary, daily means experienced a minimum in late summer or early fall depending on latitude. Peaks occurred later, and minima occurred earlier with increasing latitude for these sites. Upon onset of snow, daily O3 means increased again.
At Barrow (Figure 8), Tiski, Iqaluit, and rural Alert, the mean annual courses of daily O3 means were W-shaped with minima around equinox and a peak in spring. As aforementioned, photochemistry is weak close to the surface in winter due to the low or lack of solar insolation north of the Arctic Circle (Figure 1(a)). During the dark nights, near-surface O3 stems most likely from downward transport of stratospheric air. In spring, as solar insolation increases again, sea-ice and snow can enhance near-surface photolysis rates. Thus, the spring minimum can be due to O3 depletion by bromine, active halogen photochemistry from halogen-atom precursors emitted from snow, ice, and/or aerosol surfaces [64] , and onset of NO2 and N2O5 photochemistry [20] .
No significant correlation existed between O3 concentrations at Norman Wells and its closest rural site Snare Rapids (Table 2). Daily mean O3 correlated significantly between Tjeldbergodden and Kårvatn (R = 0.85), Yellowknife 52nd Ave and Snare Rapids (R = 0.44), Ammarnäs and Tustervatn (R = 0.90). On average, background O3 contributed 85% to the urban totals at Tjeldbergodden, but daily contributions varied appreciably (Figure 8). At Ammarnäs, daily O3 means were 6% lower than at Tustervatn.
Except Pinega, for all cities with concurrent NO2 and O3 measurements, NO2 and O3 were anti-correlated (Table 3) indicating an Ox balance. This finding suggests that―in addition to direct emission from traffic―chemical reactions between NO and O3 may produce NO2. Statistically significant anti-correlation at the 95% confidence level existed for these cities except Ft. Liard airport and Inuvik Bompas Road. However, at these two sites, sample sizes were low and may be misleading. At Pinega, NO2 and O3 showed statistically significantly positive correlation (Table 3) indicating traffic as major cause for NO2. In summer, VOC emissions from the surrounding taiga may affect O3 concentrations as well.
3.6. Particulate Matter
Particulate matter has natural sources like dust, sea spray, volcanic ash, wildfires, and anthropogenic sources like residential, commercial and industrial combustion processes, all kind of traffic, agricultural biomass burning, plowing. Furthermore, particles can form from precursor gases by gas-to-particle conversion, which depends on the thermal and chemical conditions of the atmosphere [14] [20] [65] . Swelling by water-vapor uptake and shrinking by evaporation/sublimation can shift particles from the fine to the coarse mode and vice versa. Sedimentation and scavenging by precipitation can remove PM from the atmosphere. Typically, large particles grow faster and are removed faster than small ones. Moreover, PM may increase by resuspension. Since most sites had no complete set of observed precursor gases plus PM2.5 and PM10 (Table 3) we discussed PM climatology with knowledge of general PM processes in mind. Since PM10 includes PM2.5, at a site with PM2.5, but no PM10 observations, PM2.5 can serve as an estimate of how much PM10 must have at least been present.
3.6.1. Analysis of PM2.5 Climatology
In Dfc climate, annual means of PM2.5 tended to be highest (Table 1). On average over all sites with the same Köppen-Geiger classification, annual means of
Table 3. Correlation of daily means at sites with concurrently measured species. Cities are set in italic. Significant correlations (95% confidence) are set in bold.
PM2.5 were lowest in Cfb climate. Frequent inversions and cold winters in Dfc climate, and removal of precursor gases and PM2.5 by the strong cyclone activity in Cfb climate may be major reasons for the former and latter air-quality conditions, respectively. Generally, annual means were higher in North America than Scandinavia. This finding is in line with the higher concentrations of precursor gases (NO2, SO2) in the former than latter region (Table 1).
On average over all Arctic cities, PM2.5 annual means remained below the WHO recommended 10 μg∙m−3 standard (Table 1). Urban daily means of PM2.5 were 2 - 5 μg∙m−3, 5 - 7.5 μg∙m−3 and 1 - 2 μg∙m−3 more than 45%, 19%, and 9% of the time, respectively. For comparison, rural concentrations of 2 - 5 μg∙m−3, 1 - 2 μg∙m−3, and less than 1 μg∙m−3 occurred about 40%, 30%, and 10% of the time. Overall, urban annual mean PM2.5 concentration was about 2.6 times the rural annual mean (Table 2). Highest annual mean PM2.5 concentrations occurred in cities, but were unrelated to their population numbers (see also Figure 9(a)). Nevertheless, annual means of PM2.5 were about 2.2 times higher for cities with more than 1000 inhabitants than small cities. Large cities had on average 16% less PM2.5 than medium size cities.
Except for Hyytiälä, Pallas Matorova, and Trapper Creek, annual means in cities exceed those at rural sites (Figure 9(a)). Hyytiälä is a research site about 1 km away from a highway, and 48 km away from the Tampere metropolitan area (364,000 inhabitants, 61.4978N, 23.7610E). Pallas Matorova is in a National Park, but downwind of the Murmansk industrial complex under east-wind conditions. Trapper Creek (481 inhabitants, 62.3167N, 150.2314W) is embedded between mountains, National Parks and Wilderness Areas at the Gulf of Alaska,
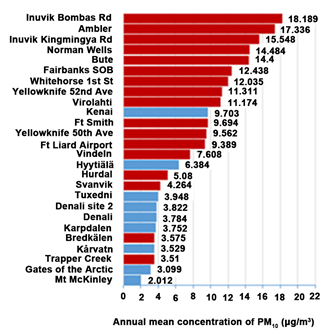

Figure 9. Inventory of annual mean urban concentrations of (a) PM2.5, and (b) PM10 (red) Concentrations at rural sites (blue) are given for comparison.
i.e. far away from anthropogenic sources. Here, frequent storms may wash out particles.
According to the observations in cities with more than one site (Figure 9(a)), PM2.5 concentrations differed up to about a factor 2 even over short distance. Here, the vicinity of the site to local emission sources may play a role. This finding is in line with mobile measurements performed in Fairbanks and the city of North Pole (US; 2232 inhabitants, 64.7511N, 147.3494W) [28] and observations in Bergen, Reykjavik, Tampere, Tromsø, Trondheim, Turku, Umeå and Vantaa (Table A2).
For all sites in Alaska except Trapper Creek, South Big Lake, and the rural sites Tuxedni, Gates of the Arctic, and in Denali National Park, the mean annual courses of daily PM2.5 showed sinus-like shapes with high and low values in winter and summer, respectively. In summer, large peaks occurred due to wildfires in Interior Alaska (e.g. Fairbanks in Figure 10) and advection of aged wildfire smoke from Siberia [66] . In July 2004 and June 2005, for instance, the Interior faced the strongest and third strongest wildfire season on record [27] [44] . During the 2004 wildfire season, hourly values exceeded 1000 μg∙m−3. These peaks were clearly visible in the mean annual course of daily means for sites operating at those times (e.g. Fairbanks, North Pole, Denali sites, Trapper Creek). Due to the large magnitude, these wildfires were still visible in the mean annual courses (cf. Figure 10), especially for sites that operated only few years around years with disastrous wildfire seasons. The magnitudes of wildfire-caused peaks in the mean annual course of daily PM2.5 varied with their distance to upwind wildfires, and the number, extension, severity, and annual re-occurrence of wildfires at similar times.
At rural Tuxedni, Gates of the Arctic, Denali National Park, Kårvatn, and the Hyytiälä research station, concentrations were low in winter and highest in summer (not shown).
The mean annual course of daily PM2.5 varied around a constant value except for a peak in July to September for Yellowknife 50th Ave, 52nd Ave (Figure 10), Whitehorse 1st St, Norman Wells, Ft Smith, and South Big Lake. At Inuvik Kingmingya Rd (Figure 10), Inuvik Bompas Rd, Iqaluit Renewable Resource Office, and Vindeln, mean annual courses of daily PM2.5 had fall minima and summer maxima. At Bredkälen (Figure 10), Whitehorse Steele St, Vindeln, and Hurdal (Figure 5), the mean annual courses of daily PM2.5 peaked in winter and summer with minima in spring and fall.
Despite the signatures of wildfires were visible in both urban and rural data in Interior Alaska, daily means of PM2.5 of the sites in the Fairbanks-North Pole area and Denali National Park were significantly anti-correlated (Table 2) or not correlated at all. In all cases, winter ratios of rural to urban mean PM2.5 identified local emissions as main cause for high concentrations in the Fairbanks-North Pole area (Figure 10), which confirms [18] .
Significant correlation of daily PM2.5 means at Hurdal and Kårvatn suggests background concentrations as a major contributor to the urban concentrations
Figure 10. Mean annual courses of daily means of PM2.5 for Fairbanks (red), Yellowknife 52nd Ave (blue), Inuvik Kingminya Rd (green), Bredkälen (brown), and ratios of daily mean PM2.5 concentrations at rural Denali to those at the State Office Building in Fairbanks (purple), and rural Kårvatn to those in urban Hurdal (black). See text for cities (and rural sites) with similar annual courses. Y-axis labels differ among panels.
(Figure 10). These sites are downwind of the shipping lane under northwest wind conditions. Comparison of the mean annual course of PM2.5 with those of precursor gases (Figure 5) suggests that advection of PM2.5 may play a dominant role, while gas-to-particle conversion may be only a minor contributor to urban concentrations. The results suggested that about 47% of the annual mean PM2.5 concentration at Hurdal was due to local emissions (Table 1). However, as aforementioned, Kårvatn fails to be in the upwind of Hurdal for substantial periods.
Daily means of PM2.5 and SO2 correlated significantly in Bredkälen, Yellowknife 52nd Ave (Figure 11), Norman Wells, Ft. Liard, Hurdal, and Inuvik Bompas
Figure 11. Mean annual courses of daily correlations of NO2 and O3 in Osen (red) and Yellowknife 52nd Ave (blue), SO2 and PM2.5 in Bredkälen (green) and Yellowknife 52nd Ave (brown), SO2 and PM2.5 in Hurdal (purple) and Yellowknife 52nd Ave (black).
Rd (Table 3). This finding suggests combustion from local heating and power generation as major contributors to PM2.5 concentrations. At the National Park site Pallas Matorova, PM2.5 and SO2 had significant correlation (20%; Table 3). Here transboundary transport may occur from the Murmansk industrial complex under the dominant east-northeast winds (Figure 1(d)).
In Inuvik, PM2.5 and SO2 showed significant anti-correlation at Kingminya Rd, but significant correlation at Bompas Rd (Table 3). Examination of google satellite data showed that Bompas Rd is at the outskirts where residences are comparably far apart from each other. Kingminya Rd is in the city center with business buildings and close distances between residences. Kingminya Rd is close to sloughs, bogs, and a major arm of the Mackenzie River delta. Here, under westerly winds in summer, dust uptake from dried riverbanks would explain the anti-correlation. This hypothesis is consistent with the higher concentrations at Kingminya Rd than Bompas Rd (Figure 9(a)), and the marginal correlation of the time series of daily PM2.5 at the two sites (R = 0.12). In winter, the denser development may explain the on average higher SO2 concentrations at Kingminya Rd than Bompas Rd (Figure 9(a)). Model simulations showed that at low wind speeds, increases in PM2.5 concentrations by gas-to-particle conversion occur several kilometers downwind of the emission sources of SO2 [29] . Thus, in winter, some PM2.5 at Kingminya Rd (Bompas Rd) might have formed during transport over the city under easterly (westerly) wind conditions.
In Yellowknife (52nd Ave), PM2.5 and SO2 showed mostly negative correlation from late December to mid-May, while mostly positive correlation in the other months (Figure 11). This finding may suggest that some PM2.5 stemmed from combustion. Daily means of PM2.5 and NO2 showed periods of positive and negative correlation over the annual course (Figure 11), but no significant annual correlation (Table 3).
Daily means of PM2.5 and NO2 anti-correlated weakly, but significantly at Norman Wells (Table 3). Significant anti-correlation occurred otherwise only for rural sites (e.g. Hyytiälä, Kårvatn). On the contrary, PM2.5 and NO2 correlated significantly in Hurdal (Figure 11), Inuvik (Bompas Rd, Kingminya Rd), Virolahti, and Whitehorse (1st St, Steele St). This means that in these cities, traffic was a dominant contributor to PM2.5.
3.6.2. Analysis of PM10 Climatology
Typically, annual mean PM10 was highest in Dwc, followed by Dsb and Dfb climates (Table 1). Annual means of observed PM10 ranged from 2 to 18.2 μg∙m−3 (Figure 9(b)).
On average over all Arctic cities, PM10 annual means remained below the WHO recommended 20 μg∙m−3 standard (Table 1). Arctic annual means of PM10 were about 2.4 times higher in cities than at rural sites. Like for PM2.5, no notable correlation existed between population numbers and annual PM10 means. On average, Arctic cities had a factor 1.7 higher annual means of PM10 in North America than Eurasia (Table 1). Typically, small cities had about 25% lower annual means of PM10 than cities with more than 1,000 inhabitants. Highest annual means occurred in the North American Arctic partly due to the less restrictive standards for diesel fuel and the huge amount of dirt roads including large stretches of highways (e.g. Alcan, Dalton Hwy, Demster Hwy, Klondike Hwy, Top of the World Hwy).
Unlike for PM2.5, on average, annual means of PM10 were highest for sites below 100 m above sea level (Table 1). They were lowest for sites higher than 500 m. Here slope wind circulations or mountain-valley circulations might develop that affect PM10.
Except for rural Kenai and Hyytiälä and urban Bredkälen and Trapper Creek, annual means of PM10 in Arctic cities exceeded those at rural sites (Figure 9(b)). The high concentrations at Kenai are most likely due to uptake of glacier silt from dry meltwater riverbanks.
In cities downwind of industrial complexes (e.g. Svanvik), the mean annual course of PM10 concentrations showed no distinct shape. Since periods of PM10 advection differed among years, polluted and less polluted events canceled out. PM10 varied notably around a straight line. This behavior occurred for Hurdal (Figure 5), Svanvik, and Virolahti (Figure 12) as well as rural Karpdalen.
Large boreal forest fires led to temporarily high daily means of PM10 in cities of Interior Alaska and the Canadian Arctic in summer. Agricultural biomass burning in Russia [54] and Siberian wildfires [66] may affect urban air quality in Eurasia in summer.
Inuvik, Yellowknife (Figure 12), Bredkälen, Ft. Liard, Ft. Smith, Hyytiälä, Norman Wells, Trapper Creek, and the background sites Denali, Denali HQ, Gates of the Arctic, Kårvatn, Kenai, and Tuxedni showed higher daily mean PM10 concentrations in summer than winter. At Kenai, the winter snow-cover prohibits uptake of glacier dust. At Tuxedni and Trapper Creek, enhanced winter storm activity may remove particles fast from the atmosphere in winter.
In Vindeln, Yellowknife (Figure 12), Bute, and Whitehorse, daily PM10 means peaked in spring and early fall with slightly higher summer than winter concentrations. In general, from fall to spring, heating and power production can be major sources of PM10. In Bute and Yellowknife, dirt roads are ice and snow-covered in winter prohibiting particle uptake, while in summer, traffic may yield substantial airborne PM10. In spring and fall, uptake of particles by wind from fields without vegetation may contribute to elevated concentrations in Vindeln that is surrounded by agricultural land.
In Interior Alaska, seasonal wildfires affected rural and urban air quality from end of May to onset of snowfall. Typically, June and July saw the strongest impacts from wildfires. The peaks in these months were due to the 2004 and 2005 fire seasons. These peaks dominated due to the short length of record (see Table A1). The sites of the Fairbanks metropolitan area showed distinct winter maxima due to local emissions and accumulation of pollutants under the frequent inversions.
Daily means of PM10 correlated significantly between Svanvik and Karpdalen (Table 2) with typically higher concentrations (8% on annual mean) at rural Karpdalen. This finding confirms [49] that dust plumes from tailing dumps in Russia can cause airborne PM pollution at those sites.
Comparison of annual courses of PM10 at the Fairbanks State Office Building and Denali headquarter sites revealed urban sources as notable contributors to the buildup of PM10 concentrations in winter. During the summer wildfire season, background concentrations gained influence on urban air quality. Occasionally, they exceeded contributions from local sources by manifolds.
Daily means of SO2 and PM10 correlated weakly, but significantly in Yellowknife (52nd Ave), Norman Wells, Bredkälen, and Hurdal (Table 3) indicating
Figure 12. Mean annual courses of daily means of PM10 for Vindeln (red), Virolahti (blue), Yellowknife 52nd Ave (green), Inuvik Bompas Rd (brown), and correlations of daily mean PM2.5 and PM10 at Yellowknife 52nd Ave (purple), and Hurdal (black). See text for cities (and rural sites) with similar annual courses. Y-axis labels differ among panels.
combustion for heating as a major source for PM10. Weak, but significant anti-correlation occurred at Ft. Liard and Inuvik Kingminya Rd. In winter, heating and power production were major sources for SO2.
At Hurdal, PM10 and NO2 showed no significant correlation (Table 3). At Whitehorse (1st St), NO2-PM10 correlation was positive and significant, i.e. traffic was a major cause of PM10. Note that the Alcan―the highway connecting Alaska and the contiguous US―is unpaved near Whitehorse. Daily means of NO2 and PM10 were significantly anti-correlated in Ft. Liard, Inuvik (Bompas Rd, Kingminya Rd), Norman Wells, and Yellowknife (52nd Ave). Judging by google satellite data, at Ft. Liard and Inuvik Kingminya Rd, PM10 most likely stemmed from uptake of silt from the banks of the Liard River and dried parts of the Mackenzie River’s sloughs and bogs, respectively in summer.
At Hurdal (Figure 5), Yellowknife 52nd Ave (Figure 12), Ft. Liard, Ft. Smith, Norman Wells, Whitehorse 1st St, and Inuvik Kingmingya Rd significant correlation occurred between PM2.5 and PM10 (R ≥ 0.68). This finding indicates that the coarse mode fraction of PM10 was small compared the fraction of PM2.5.
4. Conclusions
Freely available data of SO2, NO2, NH3, O3, PM2.5 and PM10 observed in cities and at rural sites north of 59.99N between 1972 and 2016 were downloaded. We compiled them into a homogenized dataset considered as air-quality samples collected in different regions for limited periods. The goal was to 1) establish a baseline inventory of Arctic urban air quality, 2) identify urban air-quality climatology for regions of common features, as well as 3) analyze and assess Arctic urban air-quality based on a common standard and current knowledge. Such air-quality climatology and air-quality inventory are necessary steps towards understanding of Arctic urban air-quality related health issues.
Since for most sites no concurrent measurements of the full suite of precursor gases, particulate matter size and meteorology existed, urban air-quality climatology was discussed in the sense of climatology.
Annual means of SO2 and NO2 concentrations ranged from 0.08 to 9.6 μg∙m−3 and 0.2 to 43.12 μg∙m−3, respectively, and were typically lower for small than large cities. Nevertheless, these annual means varied more than an order of magnitude even over short distance within a city depending on a site’s distance to local sources. On average, annual means of SO2 showed no severe issues with respect to the WHO annual threshold for the Arctic cities examined here.
Urban annual means of O3 ranged from 27 to 131 μg∙m−3. In coastal cities with seasonal sea-ice, mean annual courses of O3 showed distinct W-shapes with a spring minimum and a fall secondary minimum. On the contrary, all other examined Arctic cities had distinct spring O3 maxima and fall minima. On average, urban annual means of particle pre-cursors and PM were higher in the North American than Scandinavian Arctic, while the opposite was true for O3.
Annual means of observed PM2.5 and PM10 ranged from 1.6 to 21.2 μg∙m−3, and 2 to 18.2 μg∙m−3, respectively. Not all sites with PM2.5 observations had also PM10 observations. However, since PM10 includes PM2.5, annual means PM10 concentrations must have been at least 21.2 μg∙m−3 or larger.
A major finding is that urban air-quality in the Arctic shows a wide range. Concentrations in the mean annual course show similar features in regions of same Köppen-Geiger class. Coastal cities with seasonal sea-ice, for instance, showed similar O3 annual courses among each other. However, their annual course differed distinctly from coastal cities without sea-ice. This means that Arctic urban air quality sees a diversity of climatology depending on their local weather climatology and geographic location.
Theoretically, cities in Dfc and Dfb climates and cities in steep fjords have huge likelihood for inversions and reduced vertical exchange. Our analysis showed typically higher annual mean pollutant concentrations for cities in these climates than for other Arctic cities. Except for periods of smoke transport from wildfires, PM concentrations were low in Interior Alaska in summer due to more efficient washout, and the northward retreat of the polar front. Cities in Cfb and Cfc climates experience frequent frontal passages that remove pollutants by scavenging and wet deposition. Based on the results of our assessment, we have to conclude that Arctic urban air quality tends to be better in temperate than in cold climate regions.
In Interior Alaska, seasonal wildfires affected rural and urban air quality. Typically, June and July saw the strongest impacts from wildfires. Extreme fire years dominated daily means when mean annual courses were determined from short records (see Table A1). Thus, in areas with seasonal wildfires or frequent advection of wildfire smoke, long-term monitoring will be needed for air-quality related health impact studies.
It is well known that when background concentrations contribute only small fractions to the urban total concentration, municipalities can improve their air quality by introduction of emission-control measures. Thus, communities have to estimate the fractional contributions of their urban emissions to their urban totals. Assessment of impacts from urban local emissions to the total urban concentrations requires information about the upwind background conditions. These conditions depend on contributions from long-range transport, chemical reactions, and removal processes.
Ideally, assessment of contributions from transport would require at least eight sites around a city to cover the major wind sectors (NNW-NNE, NNE-ESE, …, WNW-NNW). However, only few cities had an urban site within 150 km radius, at which the same species was measured during the same period. Furthermore, the cities were not in the downwind of that rural site for the entire time. Often the rural site was just a proxy for ambient, non-urban conditions. Nevertheless, for some pairs of rural and urban sites, contributions from urban and distant sources could be pin-pointed. Rural-to-urban ratios of species pointed, for instance, to seasonal transport of pollutants from wildfires, shipping, and the Kola Peninsula mining area at some sites in Interior Alaska, western and northern Norway, respectively.
Ideally, the full suite of PM and O3 precursor gases should be measured to identify sources in urban air. The few sites with concurrent measurements of SO2 and PM, or NO2 and PM, for instance, permitted identification of traffic, or combustion as major contributors to observed urban totals of SO2, and NO2, respectively. In cities with high O3, measuring at least NO2 and O3 would help to distinguish between O3 formed locally and O3 from downward transport.
Estimating the impacts of chemistry and weather to urban total concentrations would need measurements of the full suite of precursor gases including VOC, PM2.5 and PM10 as well as wet and dry deposition at all these sites including the urban site(s). Such monitoring networks, however, are expensive to maintain on long-term, especially under the harsh Arctic winter weather conditions and in complex terrain. However, our results showed that over a couple of years, such measurements may permit identification of causes for low air quality.
Based on our findings one has to conclude that Arctic municipalities could use monitoring to assess their air-quality situation for a targeted approach for mitigation. As demonstrated in our study, analysis of even short-term (several years) monitoring of relevant species could reveal major sources and/or reasons. This information would empower municipal policy makers to decide whether they can implement mitigation strategies in the framework of their own responsibility or in collaboration among cities. In both cases, they could work on solutions at the community level, rather than waiting for solutions from national laws, and/or international complex, politically difficult, and lengthy policy negotiations.
Our results suggest that in the North American Arctic, for instance, urban air quality with respect to PM can be improved by municipal emission-control measures. Here cities are islands in a waste environment, where local emissions, weather, and season govern PM concentrations. Especially, summer concentrations of PM10 could be reduced, for instance, by paving city streets with high traffic volume, and highways in the urban outskirts.
On the contrary, in Scandinavia, several cities have few options to improve their air quality by introducing emission-control measures at the municipal scale. Transboundary advection of pollutants from the Murmansk Industrial Complex, for instance, affected air quality at (rural and) urban sites in Lapland (e.g. Svanvik). However, municipal representatives in cities of the Murmansk Industrial Complex could introduce responsible emission-control measures to improve their own air quality, and hence also that of cities in their downwind. Given the climatology of the major wind directions, municipal decision makers of upwind and downwind cities could address their common air quality issues by collaboration on the community scale.
Our results suggest that ship emissions and upwind emissions from oil and gas production influence air quality in cities along the Norwegian coast. Emissions from oil and gas production and shipping, however, are beyond municipal control except ship emissions in ports. Here installing cold-ironing facilities and then mandating cold-ironing are an option. Emissions from power plants are cleaner than emissions of ships’ auxiliary engines at low-load.
Based on the observations for Norwegian coastal cities, we may conclude for coastal communities along the Alaskan Arctic Ocean that besides their own local sources (e.g. traffic, power generation, residential and commercial combustion), offshore oil and gas production year-round, and in summer, Arctic shipping may contribute to urban concentrations at least for limited periods of time. Offshore ship-emission control measures, however, are responsibility of the International Marine Organization. Emissions of oil and gas platforms in national waters are subject to national permits and regulation.
Our analysis suggests that North American cities north of the Arctic Circle could be unique testbeds to study pollutant-related health issues without the confounding effects of multiple pollutants air quality. During the dark winter days, negligible quantities of O3 exist/form. Thus, high PM2.5 concentrations occur due to combustion and traffic without confounding effects of O3. In summer, natural wildfires frequently created PM concentrations well exceeding levels deemed “unhealthy” against a background of clean air. During the white summer nights, PM and O3 effects may occur simultaneously. Thus, the impact of confounding effects can be examined for the same population. Collectively, these cities provide an environment that could permit examining the impacts of high vs. low concentrations, and single vs. multipollutant effects on health with concentrations similar to large cities in mid and low latitudes.
Acknowledgements
We thank the anonymous reviewers for fruitful discussion and helpful comments. We also thank all those who were involved in the monitoring or in research projects, and have submitted their data to the EMEP, GMD, IMPROVE, NAPS, and CABM databases.
Cite this paper
Mölders, N. and Kramm, G. (2018) Climatology of Air Quality in Arctic Cities―Inventory and Assessment. Open Journal of Air Pollution, 7, 48-93. https://doi.org/10.4236/ojap.2018.71004
References
- 1. Edwin, S.G., Mölders, N., Friedrich, K., Schmidt, S. and Thoman, R. (2017) Conditions Supporting Funnel Cloud Development in Alaska. Atmospheric and Climate Sciences, 7, 23. https://doi.org/10.4236/acs.2017.72016
- 2. Leelasakultum, K., Mölders, N., Tran, H.N.Q. and Grell, G.A. (2012) Potential Impacts of the Introduction of Low Sulfur Fuel on PM2.5-Concentrations at Breathing Level in a Subarctic City. Advances in Meteorology, 2012, 17. https://doi.org/10.1155/2012/427078
- 3. Arctic-Council (2009) Arctic Marine Shipping Assessment 2009 Report. In: Ellis, B. and Brigham, L., Eds., Arctic Council, Tromsa, Norway, 194.
- 4. Winiger, P., Andersson, A., Eckhardt, S., Stohl, A. and Gustafsson, ö. (2016) The Sources of Atmospheric Black Carbon at a European Gateway to the Arctic. Nature Communications, 7, Article ID: 12776. https://doi.org/10.1038/ncomms12776
- 5. Dominici, F., Peng, R.D., Bell, M.L., Pham, L., McDermott, A., Zeger, S.L., et al. (2006) Fine Particulate Air Pollution and Hospital Admission for Cardiovascular and Respiratory Diseases. Journal of the American Medical Association, 295, 1127-1134. https://doi.org/10.1001/jama.295.10.1127
- 6. Pope, I.C.A., Dockery, D.W. and Schwartz, J. (1995) Review of Epidemiological Evidence of Health Effects of Particulate Air Pollution. Inhalation Toxicology, 7, 1-18. https://doi.org/10.3109/08958379509014267
- 7. Jerrett, M., Burnett, R.T., Pope III, C.A., Ito, K., Thurston, G., Krewski, D., et al. (2009) Long-Term Ozone Exposure and Mortality. New England Journal of Medicine, 360, 1085-1095. https://doi.org/10.1056/NEJMoa0803894
- 8. Quarato, M., De Maria, L., Gatti, M., Caputi, A., Mansi, F., Lorusso, P., et al. (2017) Air Pollution and Public Health: A Prisma-Compliant Systematic Review. Atmosphere, 8, 183. https://doi.org/10.3390/atmos8100183
- 9. World Health Organization (2000) Air Quality Guidelines for Europe. In: Publications, W.R., Ed., European Series, WHO Regional Office for Europe, Copenhagen.
- 10. Liu, J.C., Pereira, G., Uhl, S.A., Bravo, M.A. and Bell, M.L. (2015) A Systematic Review of the Physical Health Impacts from Non-Occupational Exposure to Wildfire Smoke. Environmental Research, 136, 120-132. https://doi.org/10.1016/j.envres.2014.10.015
- 11. Oftedal, B., Nafstad, P., Magnus, P., Bjørkly, S., et al. (2003) Traffic Related Air Pollution and Acute Hospital Admission for Respiratory Diseases in Drammen, Norway 1995-2000. European Journal of Epidemiology, 18, 671-675. https://doi.org/10.1023/A:1024884502114
- 12. Halonen, J.I., Lanki, T., Yli-Tuomi, T., Kulmala, M., Tiittanen, P. and Pekkanen, J. (2008) Urban Air Pollution, and Asthma and Copd Hospital Emergency Room Visits. Thorax, 63, 635-641. https://doi.org/10.1136/thx.2007.091371
- 13. Komppula, M., Lihavainen, H., Hatakka, J., Paatero, J., Aalto, P., Kulmala, M., et al. (2003) Observations of New Particle Formation and Size Distributions at Two Different Heights and Surroundings in Subarctic Area in Northern Finland. Journal of Geophysical Research: Atmospheres, 108, Article ID: 4295. https://doi.org/10.1029/2002JD002939
- 14. Mölders, N. and Kramm, G. (2014) Lectures in Meteorology. Springer, Heidelberg, 591. https://doi.org/10.1007/978-3-319-02144-7
- 15. Devasthale, D., Willen, U., Karlsson, K.-G. and Jones, C.G. (2010) Quantifying the Clear-Sky Temperature Inversion Frequency and Strength over the Arctic Ocean During Summer and Winter Seasons from AIRS Profiles. Atmospheric Chemistry and Physics, 10, 5565-5572. https://doi.org/10.5194/acp-10-5565-2010
- 16. Mölders, N. and Kramm, G. (2010) A Case Study on Wintertime Inversions in Interior Alaska with WRF. Atmospheric Research, 95, 314-332. https://doi.org/10.1016/j.atmosres.2009.06.002
- 17. Tran, H.N.Q. and Mölders, N. (2011) Investigations on Meteorological Conditions for Elevated PM2.5 in Fairbanks, Alaska. Atmospheric Research, 99, 39-49. https://doi.org/10.1016/j.atmosres.2010.08.028
- 18. Mölders, N., Tran, H.N.Q., Quinn, P., Sassen, K., Shaw, G.E. and Kramm, G. (2011) Assessment of WRF/Chem to Capture Sub-Arctic Boundary Layer Characteristics During Low Solar Irradiation Using Radiosonde, Sodar, and Station Data. Atmospheric Pollution Research, 2, 283-299. https://doi.org/10.5094/APR.2011.035
- 19. Mölders, N., Porter, S.E., Cahill, C.F. and Grell, G.A. (2010) Influence of Ship Emissions on Air Quality and Input of Contaminants in Southern Alaska National Parks and Wilderness Areas During the 2006 Tourist Season. Atmospheric Environment, 44, 1400-1413. https://doi.org/10.1016/j.atmosenv.2010.02.003
- 20. Seinfeld, J.H. and Pandis, S.N. (1997) Atmospheric Chemistry and Physics, from Air Pollution to Climate Change. John Wiley & Sons, Hoboken.
- 21. Marelle, L., Thomas, J.L., Raut, J.-C., Law, K.S., Jalkanen, J.-P., Johansson, L., et al. (2015) Air Quality and Radiative Impacts of Arctic Shipping Emissions in the Summertime in Northern Norway: From the Local to the Regional Scale. Atmospheric Chemistry and Physics, 15, 18407-18457. https://doi.org/10.5194/acpd-15-18407-2015
- 22. Law, K.S. and Stohl, A. (2007) Arctic Air Pollution: Origins and Impacts. Science, 315, 1537-1540. https://doi.org/10.1126/science.1137695
- 23. Fisher, J.A., Jacob, D.J., Purdy, M.T., Kopacz, M., Le Sager, P., Carouge, C., et al. (2010) Source Attribution and Interannual Variability of Arctic Pollution in Spring Constrained by Aircraft (ARCTAS, ARCPAC) and Satellite (AIRS) Observations of Carbon Monoxide. Atmospheric Chemistry and Physics, 10, 977-996. https://doi.org/10.5194/acp-10-977-2010
- 24. Tran, T.T., Newby, G. and Mölders, N. (2011) Impacts of Emission Changes on Sulfate Aerosols in Alaska. Atmospheric Environment, 45, 3078-3090. https://doi.org/10.1016/j.atmosenv.2011.03.013
- 25. Law, K.S., Stohl, A., Quinn, P.K., Brock, C.A., Burkhart, J.F., Paris, J.-D., et al. (2014) Arctic Air Pollution: New Insights from POLARCAT-IPY. Bulletin of the American Meteorological Society, 95, 1874-1895. https://doi.org/10.1175/BAMS-D-13-00017.1
- 26. Wendler, G. and Nicpon, P. (1975) Low-Level Temperature Inversion in Fairbanks, Central Alaska. Monthly Weather Review, 103, 34-44. https://doi.org/10.1175/1520-0493(1975)103<0034:LLTIIF>2.0.CO;2
- 27. Wendler, G., Conner, J., Moore, B., Shulski, M. and Stuefer, M. (2011) Climatology of Alaskan Wildfires with Special Emphasis on the Extreme Year of 2004. Theoretical and Applied Climatology, 104, 459-472. https://doi.org/10.1007/s00704-010-0357-9
- 28. Mölders, N., Tran, H.N.Q., Cahill, C.F., Leelasakultum, K. and Tran, T.T. (2012) Assessment of WRF/Chem PM2.5 Forecasts Using Mobile and Fixed Location Data from the Fairbanks, Alaska Winter 2008/09 Field Campaign. Air Pollution Research, 3, 180-191. https://doi.org/10.5094/APR.2012.018
- 29. Mölders, N. (2013) Investigations on the Impact of Single Direct and Indirect, and Multiple Emission-Control Measures on Cold-Season Near-Surface PM2.5 Concentrations in Fairbanks, Alaska. Atmospheric Pollution Research, 4, 87-100. https://doi.org/10.5094/APR.2013.009
- 30. Asikainen, A., Pärjälä, E., Jantunen, M., Tuomisto, J.T. and Sabel, E.C. (2017) Effects of Local Greenhouse Gas Abatement Strategies on Air Pollutant Emissions and on Health in Kuopio, Finland. Climate, 5, 43. https://doi.org/10.3390/cli5020043
- 31. Tørseth, K., Aas, W., Breivik, K., Fjæraa, A.M., Fiebig, M., Hjellbrekke, A.G., et al. (2012) Introduction to the European Monitoring and Evaluation Programme (EMEP) and Observed Atmospheric Composition Change during 1972-2009. Atmospheric Chemistry and Physics, 12, 5447-5481. https://doi.org/10.5194/acp-12-5447-2012
- 32. Kuklinska, K., Wolska, L., and Namiesnik, J. (2015) Air Quality Policy in the U.S. And the EU—A Review. Atmospheric Pollution Research, 6, 129-137. https://doi.org/10.5094/APR.2015.015
- 33. World Meteorological Organization (1998) 1961-1990 Global Climate Normals (Clino). WMO, Genova.
- 34. Baldasano, J.M., Valera, E. and Jiménez, P. (2003) Air Quality Data from Large Cities. The Science of the Total Environment, 307, 141-165. https://doi.org/10.1016/S0048-9697(02)00537-5
- 35. Kim, J., Waliser, D.E., Mattmann, C.A., Mearns, L.O., Goodale, C.E., Hart, A.F., et al. (2013) Evaluation of the Surface Climatology over the Conterminous United States in the North American Regional Climate Change Assessment Program Hindcast Experiment Using a Regional Climate Model Evaluation System. Journal of Climate, 26, 5698-5715. https://doi.org/10.1175/JCLI-D-12-00452.1
- 36. World Health Organization (2006) WHO Air Quality Guidelines for Particulate Matter, Ozone, Nitrogen Dioxide and Sulfur Dioxide. In: WHO, Ed., Summary of Risk Assessment, World Health Organization, Geneva, 22 p.
- 37. Cheng, S., Chen, D., Li, J., Wang, H. and Guo, X. (2007) The Assessment of Emission-Source Contributions to Air Quality by Using a Coupled MM5-ARPS-CMAQ Modeling System: A Case Study in the Beijing Metropolitan Region, China. Environmental Modelling & Software, 22, 1601-1616. https://doi.org/10.1016/j.envsoft.2006.11.003
- 38. Mölders, N. and Gende, S. (2016) On the Limits to Manage Air-Quality in Glacier Bay. Journal of Environmental Protection, 7, 1923-1955. https://doi.org/10.4236/jep.2016.712151
- 39. von Storch, H. and Zwiers, F.W. (1999) Statistical Analysis in Climate Research. Cambridge University Press, Cambridge, 484 p. https://doi.org/10.1017/CBO9780511612336
- 40. Jacob, D.J. (2000) Heterogeneous Chemistry and Tropospheric Ozone. Atmospheric Environment, 34, 2131-2159. https://doi.org/10.1016/S1352-2310(99)00462-8
- 41. Kley, D., Geiss, H. and Mohnen, V.A. (1994) Tropospheric Ozone at Elevated Sites and Precursor Emissions in the United States and Europe. Atmospheric Environment, 28, 149-158. https://doi.org/10.1016/1352-2310(94)90030-2
- 42. Kottek, M., Grieser, J., Beck, C., Rudolf, B. and Rubel, F. (2006) World Map of the Köppen-Geiger Climate Classification Updated. Meteorologische Zeitschrift, 15, 259-263. https://doi.org/10.1127/0941-2948/2006/0130
- 43. Kanamitsu, M., Ebisuzaki, W., Woollen, J., Yang, S.-K., Hnilo, J.J., Fiorino, M., et al. (2002) NCEP-DOE AMIP-II Reanalysis (R-2). Bulletin of the American Meteorological Society, 83, 1631-1643. https://doi.org/10.1175/BAMS-83-11-1631
- 44. Mölders, N. and Kramm, G. (2007) Influence of Wildfire Induced Land-Cover Changes on Clouds and Precipitation in Interior Alaska—A Case Study. Atmospheric Research, 84, 142-168. https://doi.org/10.1016/j.atmosres.2006.06.004
- 45. Shulski, M. and Wendler, G. (2007) The Climate of Alaska. University of Alaska Press, Fairbanks, 216 p.
- 46. Eckhardt, S., Hermansen, O., Grythe, H., Fiebig, M., Stebel, K., Cassiani, M., et al. (2013) The Influence of Cruise Ship Emissions on Air Pollution in Svalbard & Ndash; a Harbinger of a More Polluted Arctic? Atmospheric Chemistry and Physics, 13, 8401-8409. https://doi.org/10.5194/acp-13-8401-2013
- 47. Kemp, K. (1984) Long Term Analysis of Marine and Nonmarine Transported Aerosols. Nuclear Instruments and Methods in Physics Research Section B: Beam Interactions with Materials and Atoms, 3, 470-474. https://doi.org/10.1016/0168-583X(84)90420-8
- 48. Bityukova, V.R. and Kasimov, N.S. (2012) Environmental Impact Assessment of the Mining and Concentration Activities in the Kola Peninsula, Russia by Multidate Remote Sensing—Atmospheric Pollution of Russia’s Cities: Assessment of Emissions and Immissions Based on Statistical Data. Geofizka, 75, 13-33.
- 49. Mokrotovarova, O., Korotkova, T.D., Pavlova, T.V. and Berglen, T.F. (2015) Russian-Norwegian Ambient Air Monitoring in the Border Areas. COLOPHON, Murmansk Regional Administration for Hydrometeorology and Environmental Monitoring (Murmansk UGMS), Norwegian Institute for Air Research (NILU), Norwegian Environment Agency, Murmansk, Oslo, 25.
- 50. EDGAR (2011) Edgar-Emissions Database for Global Atmospheric Research. European Comission-Joint Research Center. http://edgar.jrc.ec.europa.eu/
- 51. Pirhalla, M.A., Gende, S. and Mölders, N. (2014) Fate of Particulate Matter from Cruise-Ship Emissions in Glacier Bay during the 2008 Tourist Season. Journal of Environmental Protection, 4, 1235-1254. https://doi.org/10.4236/jep.2014.512118
- 52. Lovejoy, E.R., Hanson, D.R. and Huey, L.G. (1996) Kinetics and Products of the Gas-Phase Reaction of SO3 with Water. The Journal of Physical Chemistry, 100, 19911-19916. https://doi.org/10.1021/jp962414d
- 53. Corbett, J.J., Lack, D.A., Winebrake, J.J., Harder, S., Silberman, A.J. and Gold, M. (2010) Arctic Shipping Emissions Inventories and Future Scenarios. Atmospheric Chemistry and Physics, 10, 9689-9704. https://doi.org/10.5194/acp-10-9689-2010
- 54. Karlsson, P.E., Ferm, M., Tømmervik, H., Hole, L.R., Pihl Karlsson, G., Ruoho-Airola, T., et al. (2013) Biomass Burning in Eastern Europe during Spring 2006 Caused High Deposition of Ammonium in Northern Fennoscandia. Environmental Pollution, 176, 71-79. https://doi.org/10.1016/j.envpol.2012.12.006
- 55. Kramm, G. and Dlugi, R. (1994) Modelling of the Vertical Fluxes of Nitric Acid, Ammonia, and Ammonium Nitrate in the Atmospheric Surface Layer. Journal of Atmospheric Chemistry, 18, 319-357. https://doi.org/10.1007/BF00712450
- 56. Tetzlaff, G., Dlugi, R., Friedrich, K., Gross, G., Hinneburg, D., Pahl, U., et al. (2002) On Modeling Dry Deposition of Long-Lived and Chemically Reactive Species over Heterogeneous Terrain. Journal of Atmospheric Chemistry, 42, 123-155. https://doi.org/10.1023/A:1015740203204
- 57. Dibb, J.E., Arsenault, M., Peterson, M.C. and Honrath, R.E. (2002) Fast Nitrogen Oxide Photochemistry in Summit, Greenland Snow. Atmospheric Environment, 36, 2501-2511. https://doi.org/10.1016/S1352-2310(02)00130-9
- 58. Mölders, N., Luijting, H. and Sassen, K. (2008) Use of Atmospheric Radiation Measurement Program Data from Barrow, Alaska, for Evaluation and Development of Snow Albedo Parameterizations. Meteorology and Atmospheric Physics, 99, 199-219. https://doi.org/10.1007/s00703-007-0271-6
- 59. Junkermann, W. (1994) Measurements of the J(O1d) Actinic Flux within and above Stratiform Clouds and above Snow Surfaces. Geophysical Research Letters, 21, 793-796. https://doi.org/10.1029/93GL03498
- 60. Weilenmann, M., Favez, J.-Y. and Alvarez, R. (2009) Cold-Start Emissions of Modern Passenger Cars at Different Low Ambient Temperatures and Their Evolution over Vehicle Legislation Categories. Atmospheric Environment, 43, 2419-2429. https://doi.org/10.1016/j.atmosenv.2009.02.005
- 61. Zhan, J., Gao, Y., Li, W., Chen, L., Lin, H. and Lin, Q. (2014) Effects of Ship Emissions on Summertime Aerosols at Ny-Alesund in the Arctic. Atmospheric Pollution Research, 5, 500-510. https://doi.org/10.5094/APR.2014.059
- 62. Ebel, A., Hass, H., Jakobs, H.J., Laube, M., Memmesheimer, M., Oberreuter, A., et al. (1991) Simulation of Ozone Intrusion Caused by a Tropopause Fold and Cut-Off Low. Atmospheric Environment. Part A. General Topics, 25, 2131-2144. https://doi.org/10.1016/0960-1686(91)90089-P
- 63. Madronich, S. (1987) Photodissociation in the Atmosphere, 1, Actinic Flux and the Effects of Ground Reflections and Clouds. Journal Geophysical Research, 92, 9740-9752. https://doi.org/10.1029/JD092iD08p09740
- 64. Thompson, C. (2017) Interactions of Bromine, Chlorine, and Iodine Photochemistry during Ozone Depletions in Barrow, Alaska. Atmospheric Chemistry and Physics, 1680, 7324. https://doi.org/10.5194/acp-15-9651-2015
- 65. Kramm, G., Beheng, K.-D. and Müller, H. (1992) Vertical Transport of Polydispersed Aerosol Particles in the Atmospheric Surface Layer. In: Schwartz, S.E. and Slinn, W.G.N., Eds., Precipitation Scavenging and Atmosphere-Surface Exchange Processes, Volume 2, The Semonin Volume: Atmosphere-Surface Exchange Processes, Hemisphere Publication, Washington/Philadelphia/London, 1125-1141.
- 66. Roiger, A., Thomas, J.L., Schlager, H., Law, K.S., Kim, J., Schäfler, A., et al. (2014) Quantifying Emerging Local Anthropogenic Emissions in the Arctic Region: The Access Aircraft Campaign Experiment. Bulletin of the American Meteorological Society, 96, 441-460. https://doi.org/10.1175/BAMS-D-13-00169.1
- 67. Elsilä, A. (2006) Air Quality in Tampere. University of Finland, Helsinki, 16. http://urn.fi/URN:NBN:fi:bib:me:W00097575700
- 68. Berglen, T.F., Andresen, E., Arnesen, K., Nilsson, L.O., Ofstad, T., Rode, A., et al. (2012) Statlig Program for Forurensningsovervåking: Grenseområdene Norge-Russland. NILU-Norsk institutt for luftforskning, Kjeller, Norway, 107.
Appendix
Table A1. Data availability of species and/or particulate matter at the various sites. Urban sites and research stations are indicated in Italic and bold, respectively. Cities are listed largest first in decreasing order. Numbers 72 and larger, and those between 00 and 16 give the year in the 20th and 21st century, respectively. CN, DK, FI, IS, NO, SE, RU, and US stand for Canada, Denmark, Finland, Iceland, Norway, Sweden, Russia, and the United States of America. Negative longitudes indicate W. All latitudes are North. Note that North Pole is a city in Alaska in the Fairbanks area.
Table A2. Annual mean concentrations for Arctic cities as found in [34] [36] [49] [67] [68] . Coordinates refer to the city when no information on site location was available. Negative longitude values indicate W, positive E. All latitudes are N.


