Open Journal of Regenerative Medicine
Vol.1 No.3(2012), Article ID:25917,10 pages DOI:10.4236/ojrm.2012.13007
The effect of sand-blasting and hydrofluoric acid etching on Ti CP 2 and Ti CP 4 surface topography
![]()
Materials and Production Engineering Department, University of Naples “Federico II”, Naples, Italy; *Corresponding Author: monetta@unina.it
Received 28 September 2012; revised 26 October 2012; accepted 30 November 2012
Keywords: Titanium; Surface Treatments; Dental Implant; Roughness
ABSTRACT
Titanium is widely used in biomedical applications from many years for its interesting properties, nevertheless there are a large number of researchers studying the way to improve the performances of biomedical devices. A large number of papers concern the study of “commercially pure titanium” (Ti CP) but, very often, no details are indicated regarding: 1) the type of Ti CP used; 2) the sandblasting process; and 3) the analytic evaluation of surface topography. In this paper, the effect of sand-blasting duration (1, 2, 4, 8 min) and hydrofluoric acid (HF) etching, as well as their combined or synergic effect, on the surface topography of CP grade 2 and grade 4, have been investigated. Results obtained show that sandblasting treatment duration should be different for Ti CP grade 2 and Ti CP grade 4 to achieve similar topography. The shape of the surface is highly modified after acid etching. The latter produces “peaks” when applied to not sandblasted coupons, whilst cuts the “top of the peaks” in the sandblasted samples. Further we confirm that, the roughness parameter Ra (or Sa), is not sufficient to describe “the surface status” and we propose to use additional parameters like: Sq, Sku and Ssk, to unequivocally describe surface topography of implants as well as well defined test procedures.
1. INTRODUCTION
Titanium and titanium alloys are used in biomedical applications in a wide range of functions from orthopedic and dental prosthesis to cardiac valves. Nowadays the most used pure titanium are identified as “commercially pure” (CP) grades 2 and 4. However, a titanium-vanadium-aluminum alloy, reported as grade 5 or labeled as Ti6Al4V, is also used.
Titanium and titanium alloys are covered by an oxide layer that spontaneously forms when the material is in contact with air [1]. Hydrofluoridric acid is used to remove the oxide layer from the Ti surface, to obtain a “clean” surface that can be used for subsequent treatments. Usually the hydrofluoridric acid treatment, in the biomedical field, is followed by the immersion of devices in other acid media, i.e. chloridric acid and/or nitric acid. Several types of surface treatments have been proposed, in the scientific literature, to improve devices osseointegration. A good review on the effect of Ti treatments for biomedical applications is [2], whereas a deeper analysis is reported in the book [3] or patent [4]. Numerous papers show that the mechanical and/or chemical surface treatment, as well as the roughness of titanium implants, affects both the rate of osseointegration and biomechanical properties [5-7]. Wennerberg [8] has compared the removing torque of machined (blasted using 25 and 250 micron sized Al2O3 particles) Ti CP implants, inserted in tibial and femoral metaphysis of adult rabbit. He found that the average roughness, Ra, was 0.8 - 1.2 and 2.1 micron for the alloy blasted at 25 micron and 250 micron, respectively. Furthermore, he found that there is a difference in torque values, between machined and blasted materials, but no differences were observed among the blasted samples. In the cited paper, no details were reported about the type of Ti CP used and there is no detail about the surface topography. Bagno [9] has reviewed the effect of various blasting treatments on samples made in Ti and Ti6Al4V. He shows a lot of interesting data on several Ti alloys blasted using carborundum, TiO2, Al2O3 and so on, as far as several experimental data are reported on acid etching of Ti, but shows no data about the type of commercially pure titanium used and there is no evidence type of the roughness distribution. These are just a few examples of a much larger series.
On the other hand, the average roughness, Ra or the average surface roughness, Sa is the most used parameter utilized in the rough surface characterization [10-13]. This parameter has been used to correlate the type of the surface treatment, to the cells adhesion, the adsorption and the cells growth [14,15] as well as the pull out force of implanted sample [16] and so on. But, Ra (or Sa) is, merely, the result of several measurements that detect the average height of a line crossing the surface: it is well known to the metrologists, that the “average roughness” does not completely describe “the surface”.
A method to measure Ra is the following: a mean line is fitted to the measurement data within the sampling length, the portions of the profile below the mean line are then inverted and placed above the line, Ra is the arithmetic average value of the profile obtained. It is obvious that several surface topographies could lead to the same value of Ra (or Sa). Then the average roughness value Ra, alone, does not give us sufficient information regarding the surface profile. The roughness measurements, on the contrary, could allow us to obtain a “picture” of the surface. Several parameters could be used in the study of surfaces [17-19] to achieve “quantitative” values that can be used to compare surface topography from different samples. In this paper the following roughness parameters will be proposed, and have been used, to analyze the effect of surface treatments: the Surface Roughness Average, Sa, the Surface Root Mean Square of roughness, Sq, the Surface Kurtosis, Sku, and the Surface Skewness, Ssk, as defined in [20].
The physical meaning of Ra (or Sa) is well known, Rq (or Sq) can be seen as the profile deviation from the mean value (given by Ra) in which is highlighted the presence of peaks and valleys found on the surface. Higher is the difference between Rq and Ra greater is the presence of very high peaks and deep valleys. The Surface Skewness, Ssk, measures the surface symmetry: if Ssk = 0, a symmetric height distributions is exhibited, for example, a Gaussian like, showing the same number of peaks and valleys, if Ssk < 0, we are considering a surface with more holes than peaks, on the contrary, if Ssk > 0 the surface shows more peaks than holes. In medical literature these conditions are studied, the configuration with fine and deep valleys is preferred, in this situation the interaction between implant and bone is more effective and reduces the rehabilitation periods, so surfaces with an Sku negative are preferable. For Gaussian height distributions Sku approaches 3.0 when increasing the number of pixels. Smaller values indicate broader height distributions and vice versa for values greater than 3.0.
The compositions of the grades 2 and 4 alloys are reported in Table 1. The change in composition modifies the chemical and physical properties of material, i.e. the Vickers micro-hardness of CP grade 2 is in the range 130 - 180 HV while for the CP grade 4 is in the range 250 - 280 HV, in same manner there is a wide change in other mechanical properties (see Table 1). Further the material composition determines, from an electrochemical point of view [1], a dissimilar behavior for the various types of Ti alloys, when exposed to biological fluid, but, due the titanium oxide layer properties, there is no substantial difference in their use as biomedical devices. It should to be clear that the same surface treatment realizes a different effect on materials owing different mechanical properties.
Due to lack of information concerning: a) the material used; b) the sandblasting process applied; and c) the real surface topography obtained after treatment, it is not easy to compare, each other, the results published on scientific journals. To contribute to solve this problem, in this paper, we focus our attention on the effect of sandblasting and/or hydrofluoridric acid treatment, conducted in welldefined conditions, of Ti grade 2 and Ti grade 4 and we propose to use some well defined treatment procedures as well as the utilization of the mentioned surface roughness parameters.
2. MATERIALS AND METHODS
The titanium samples were cylindrical shaped 5 mm in diameter and 30 mm in length. Two types of titanium alloys were used: 1) Ti CP grade 2; and 2) Ti CP grade 4, both were medical grade. It is well known that microroughness measurements require to be filtered to eliminate any contribution due to macro-roughness and/or due to the shape of the device under test (i.e. the sample is not perfectly flat). To try to reduce these types of inaccuracy, the cylindrical samples were machined as reported in Figure 1(a). To obtain two parallel surfaces and to avoid the samples rotation during the roughness measurements, they were encapsulated in an epoxy resin (see Figure 1(b)). Samples have been sand-blasted using TiO2 particles (average diameter 250 microns) in the device schematically shown in Figure 2 (the image shows the cone produced by the TiO2 particulate), using a nozzle diameter of 2 mm, the distance between sample holder and nozzle was 100 mm, the pressure drop across the nozzle was 5 atm, the process length was varied from 1, 2, 4 to 8 minutes.
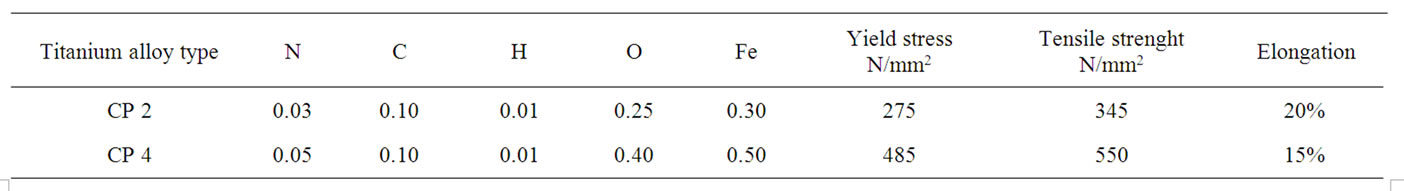
Table 1. Chemical composition and mechanical properties of Ti CP 2 and Ti CP 4.
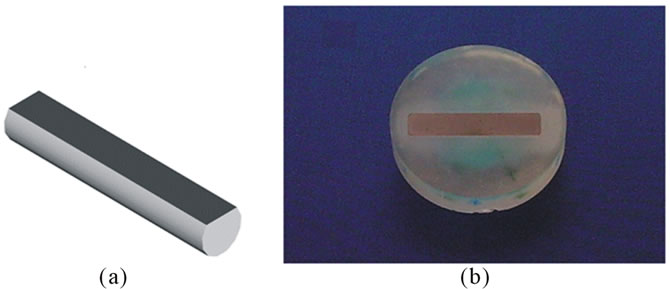
Figure 1. The shape of titanium samples used for the roughness measurements: (a) bare; and (b) encapsulated in epoxy resin.
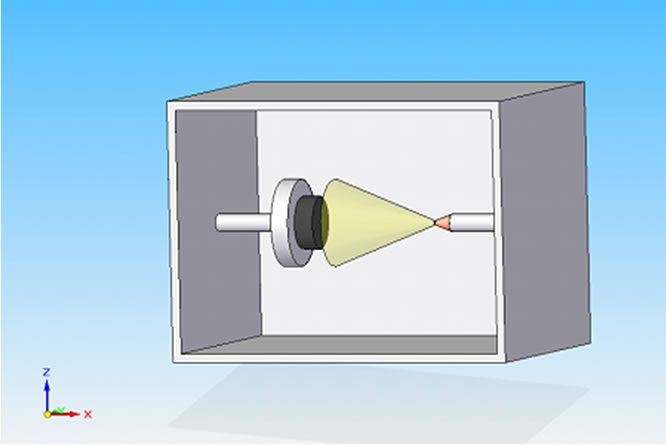
Figure 2. Sand-blasting apparatus: schematic representation and TiO2 particulate cone.
Acid treatments were performed using reagent grade hydrofluoridric acid (Sigma) 2% vol aqueous solution at ambient temperature for 2 minutes with slow rate mixing, on “smooth” and sandblasted samples.
Image analysis was carried out using a scanning electron microscope (SEM) Leica S 440.
3D roughness measurements were conducted at room temperature using S3F Taylor Hobson Talysurf. Tested surface was of 5 mm2 (collecting 4 points/µm), three measures were conducted on each specimen and three specimen were tested for each working condition, mean value of results will be reported in the discussion of experimental data.
Very shortly, in the following, is reported the physical meaning of the Roughness Average, Ra, the Root Mean Square of roughness, Rq, the Kurtosis, Rku, and the Skewness, Rsk, as reported in the Taylor Hobson Talysurf user manual instruction [20]. The surface parameters, Sa, Sq, Sku, Ssk, used in this work, have the same physical meaning, those are the surface extension of linear parameters. Ra is the arithmetic average value of the profile departure from the mean line, within a sampling length (Figure 3(a)). A method of visualizing how Ra is derived as follows: Graph A: A mean line X-X is fitted to the measurement data. Graph B: The portions of the profile within the sampling length “l” and below the mean line are then inverted and placed above the line. Ra is the line in Graph C. The Root Mean Square Deviation of the Profile from the Mean Line (Rq) (Figure 3(b)) is, mathematically, the Square Root of the Mean of all the “Z” values after they have been squared.
Kurtosis, Rku, (Figure 3(c)) is a measure of the sharpness of the profile. If the Amplitude Distribution Curve has a balanced Gaussian shape, Rku approximates to 3. A bumpy surface will give a value less than 3 and a peaky or spiky surface a value more than 3. A pure random surface such as surface grinding with a newly dressed wheel will have a Kurtosis of 3. Rku is often used in conjunction with Rsk (skewness) to monitor wear (e.g. engine wear). Surfaces with high Kurtosis are more difficult to clean and are thus prone to contamination and important feature in liquid, chemical, photographic and other mass process industries.
Skewness, Rsk, (Figure 3(d)) is a measure of the symmetry of the profile about the mean line. This parameter indicates whether the spikes on the surface are predominately negative or positive or if the profile has an even distribution of peaks and valleys. A negative Skew means the surfaces will have good “wettability” which is needed for oil and lubrication or surface coating processes, but they are hard to clean and more prone to contamination.
3. RESULTS AND DISCUSSION
The roughness 3D parameters values, Sa, Sq, Sku, Ssk, evaluated as indicated previously, for untreated, sandblasted and acid etched samples, are reported in Table 2. SEM images of untreated Ti CP 2 and Ti CP 4 are reported in Figures 4(a) and (b), respectively. The sample surface appears to be “flat” in both specimens, showing several “valleys” due to production process. Values obtained from Sa analysis (arithmetical average of deviations from mean plane), are represented in Figures 5(a) and (b) for untreated, sandblasted and acid etched samples Ti CP 2 and Ti CP 4, respectively. In the same manner the
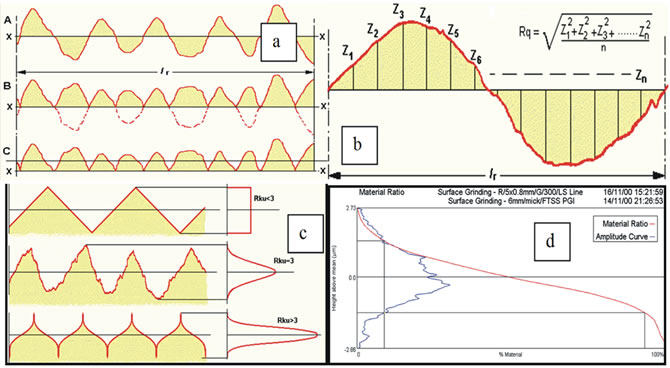
Figure 3. The image shows the way to calculate the roughness parameters and their physical meaning: a) Ra; b) Rq; c) Rku; and d) Rsk [20].
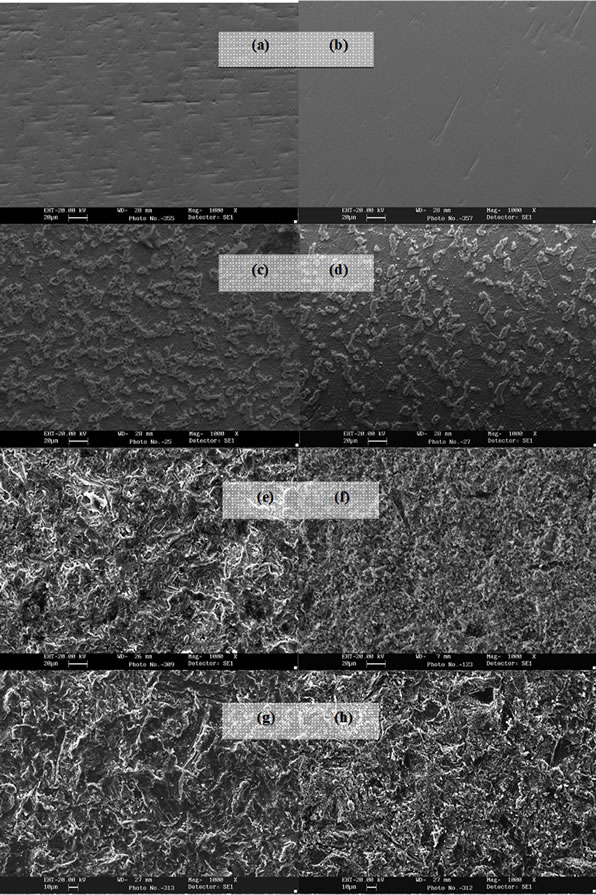
Figure 4. SEM images (1000×) of smooth Ti CP 2 (a), smooth Ti CP 4; (b), acid etched smooth Ti CP 2 (c) and acid etched smooth Ti CP 4 (d), Ti CP 2 sandblasted 1 min (e), Ti CP 2 sandblasted 1 min and acid etched (f), Ti CP 2 sandblasted 8 min (g), Ti CP 2 sandblasted 8 min and acid etched (h).
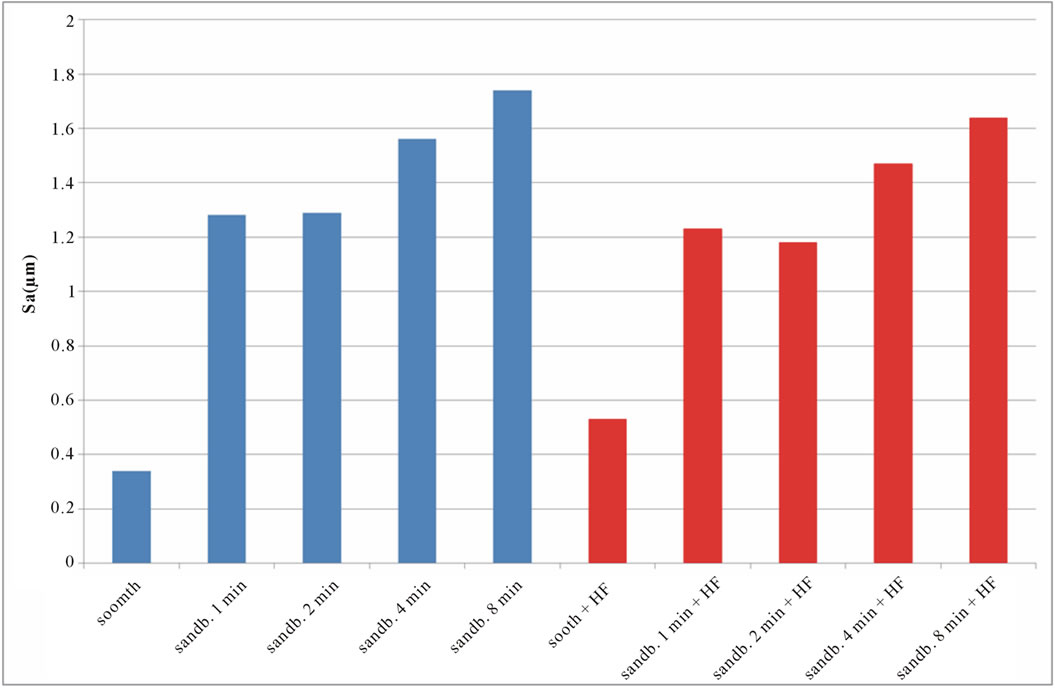
calculated values of Sq, Sku, Ssk, are reported in Figures 6-8. SEM images of not sandblasted acid etched Ti CP 2 and Ti CP 4, reported in Figures 4(c) and (d) respectively, show that the effect of acid treatment produces many peaks on a flat surface. Analyzing Sa tendency of Ti CP 2 (Figure 5(a)), seems to be clear that this parameter increases from smooth specimen to sandblasted ones, this means that the specific surface area enlarges and, for biomedical applications, there is an improvement of the interaction between living tissue and implant. Hydrofluoric acid treatment increases the average roughness in the case of the smooth specimen, while in the case of sandblasted ones, HF treatments, lightly decrease average roughness values, if compared with no etched samples, in this case it is possible to suppose that acidic media corrodes peaks mitigating them. This result is in agreement with other our results obtained by electrochemical polarization characterization [1]. Analyzing the histogram in Figure 5(b) corresponding to Ti CP 4 data, it is possible to observe lower roughness Sa values
 (a)
(a)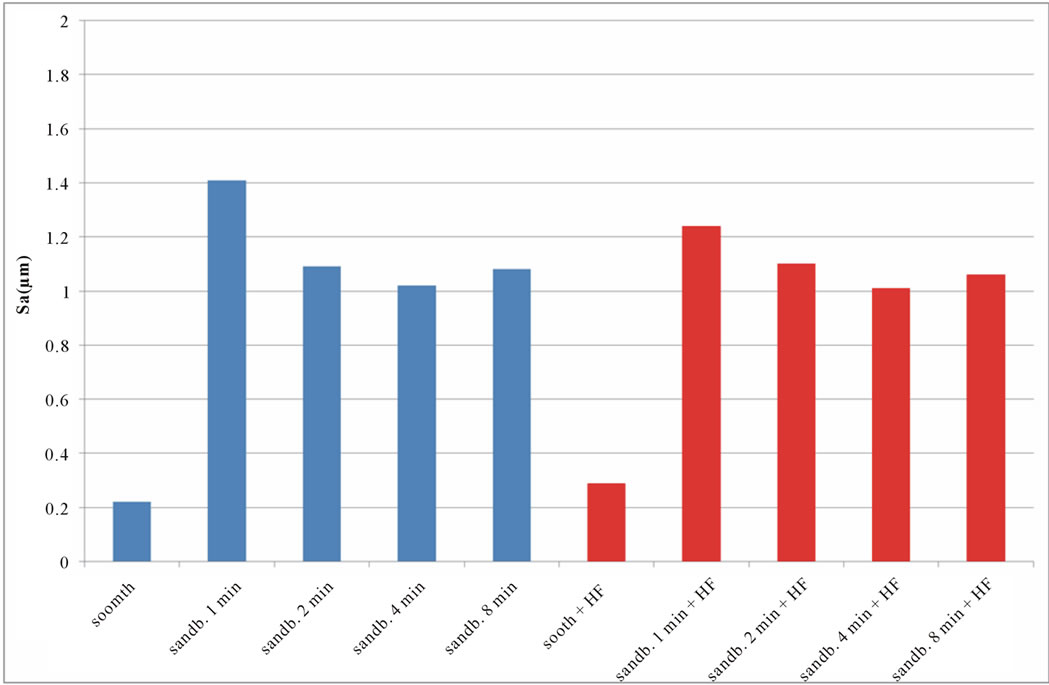 (b)
(b)
Figure 5. Experimental values of Sa obtained for Ti CP 2 (a) and Ti CP 4 (b).
 (a)
(a)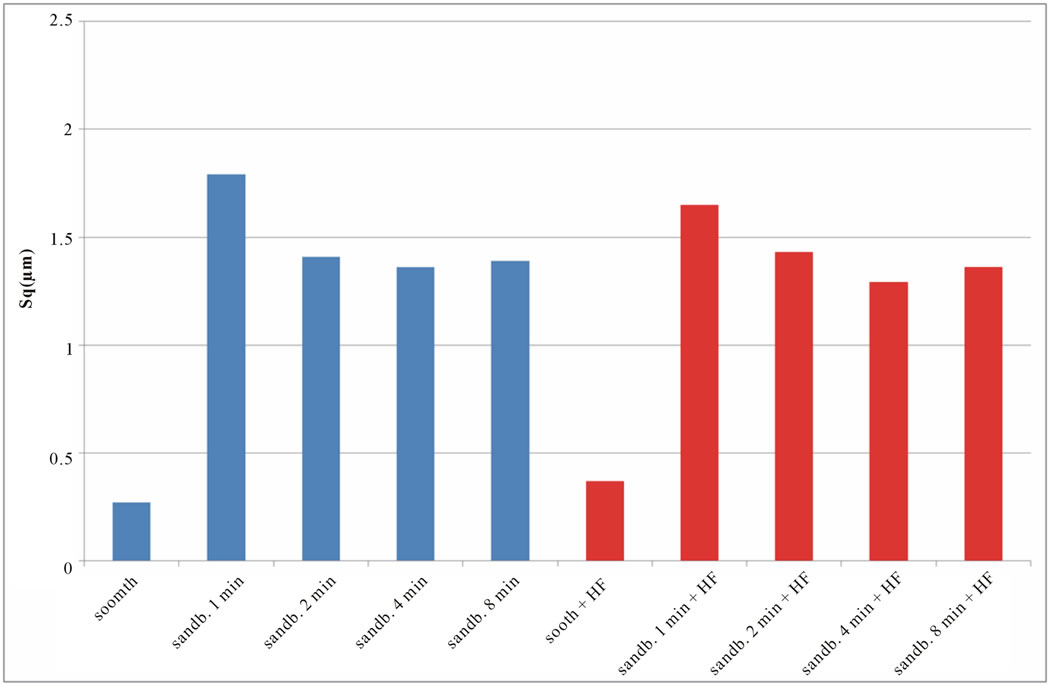 (b)
(b)
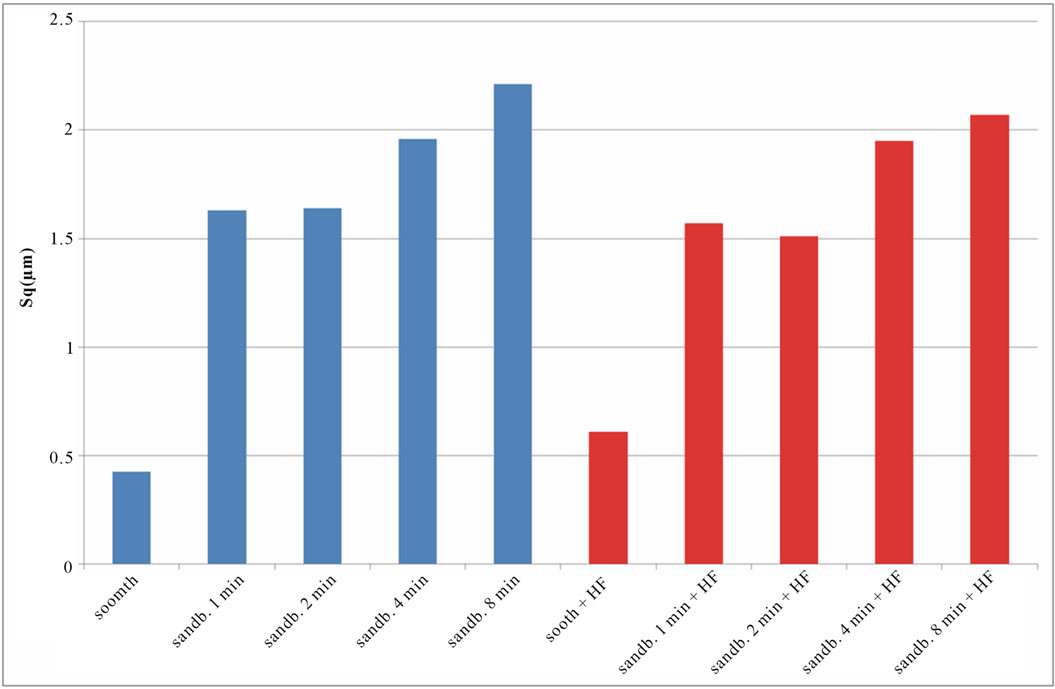
Figure 6. Experimental values of Sq obtained for Ti CP 2 (a) and Ti CP 4 (b).
if compared with TI CP 2, this is due to the higher surface hardness of Ti CP 4 respect to Ti CP 2. Comparing smooth specimen with sandblasted ones, it is possible to detect a roughness increase after 1 min of treatment (see also Figures 4(e) and (f). Increasing sandblasting duration, Sa value reaches a steady state value for both, acid etched and non-etched samples, lower than that obtained in the case of 1 min sandblasting. SEM images reported in Figures 4(g) and (h) represent Ti CP 2 sandblasted 8 min, Ti CP 2 sandblasted 8 min and acid etched, respectively. Sq parameter (root mean squared of deviation from the mean plane), evaluates the effective value of surface amplitude. Experimental results of Ti CP 2 and TI CP 4, reported in Table 2, are represented in Figures 6(a) and (b). Sq parameter can be used to amplify the effect due to high peaks and deep valleys, in this case Sq does not differ substantially from the Sa behavior, for all material tested. It is possible to recognize that exists a uniform roughness distribution and that, from this point of view, longer sandblasting treatments do not appreciably
 (a)
(a)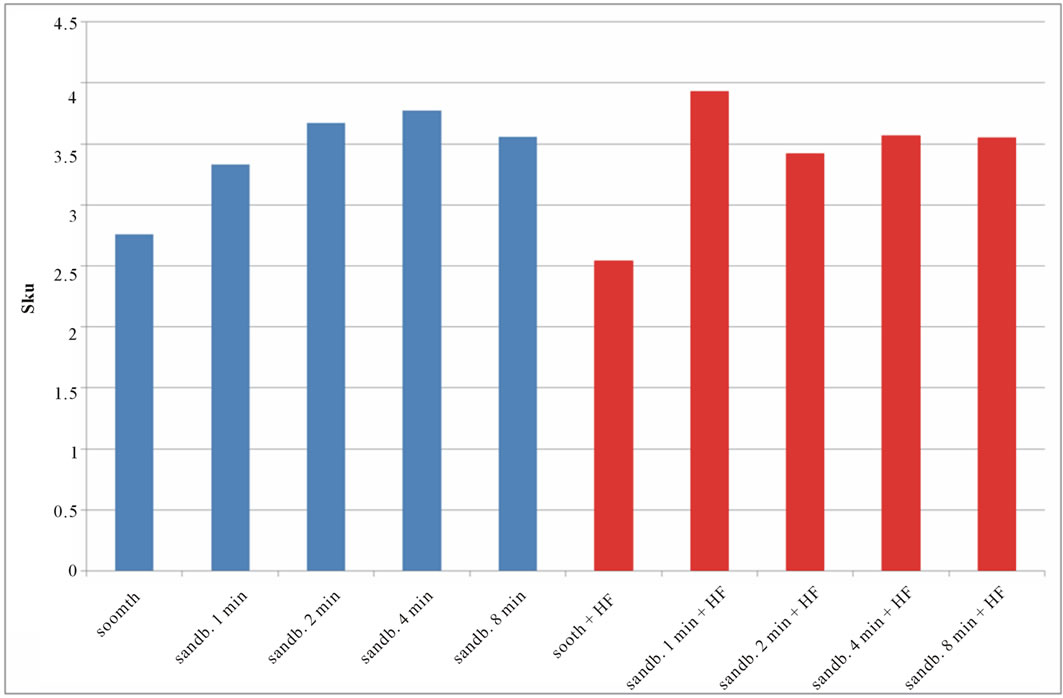 (b)
(b)
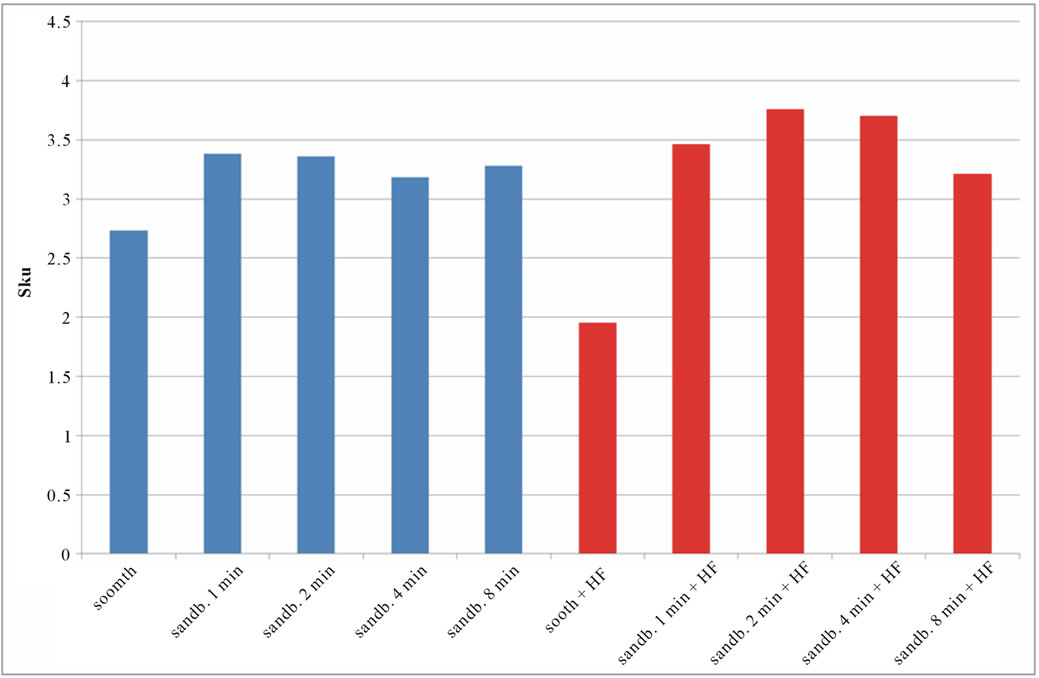
Figure 7. Experimental values of Sku obtained for Ti CP 2 (a) and Ti CP 4 (b).
modify the surface shape. As reported before, Sku parameter (peakedness of the surface) allows analysis of peak density on the tested surface, if Sku = 3, the peaks distribution is equilibrate with a Gaussian distribution. Experimental results, reported in Table 2, are shown in Figures 7(a) and (b). As one can see, the smooth samples and the smooth acid etched ones, show Sku < 3, while all the sandblasted samples exhibit a value of Sku > 3, this means that the surface shape completely change after sandblasting treatment. Sandblasted specimens experience a change in the peaks shape depending by treatment time, but, acid etching seems to be more effective on Ti Cp 2 rather than on Ti CP 4. Finally the Ssk parameter is analyzed, this parameter is a measure of the profile symmetry in relationship to its mean line. If this parameter assumes negative values, we are studying a surface showing a lot of valleys, on the contrary if it results positive, there are more peaks than valleys on the surface. In medical literature these conditions are studied, the configuration preferable is the first one, in this situation, in
 (a)
(a)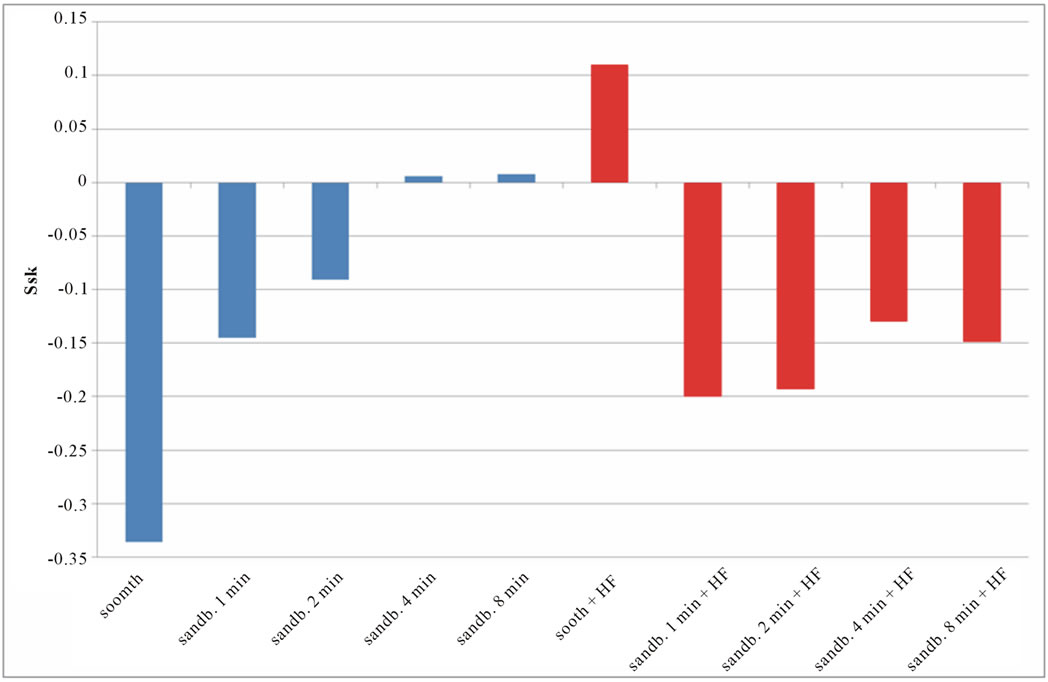 (b)
(b)
Figure 8. Experimental values of Ssk obtained for Ti CP 2 (a) and Ti CP 4 (b).
fact, the interaction between implant and bone tissues is more effective and reduce the rehabilitation periods, so surface showing negative value of Ssk is, therefore, preferred.
Smooth samples show a negative Ssk value (see Figure 8), acid treatment modify the surface inducing several peaks on smooth samples (Ssk = 0.114 for Ti CP 2 and 0.110 for Ti CP 4, Table 2), while, Ssk values, are negative or close to zero for all sandblasted samples. Experimental results show that, for all the tested samples, increasing sandblasting treatment time, the Ssk values increase, indicating that the number of peaks increase too, obtaining, in some cases, a surface dominated from peaks instead from valleys. The acid etching on sandblasted items provokes the reduction of peaks height, as is demonstrated by negative Ssk values for both, Ti CP 2 and Ti CP 4 samples. This assumption is in agreement with the conclusion stated in the discussion of Sa values. The data shown clearly demonstrate that the use of Sa (or Ra) roughness parameter is not sufficient to analyze and
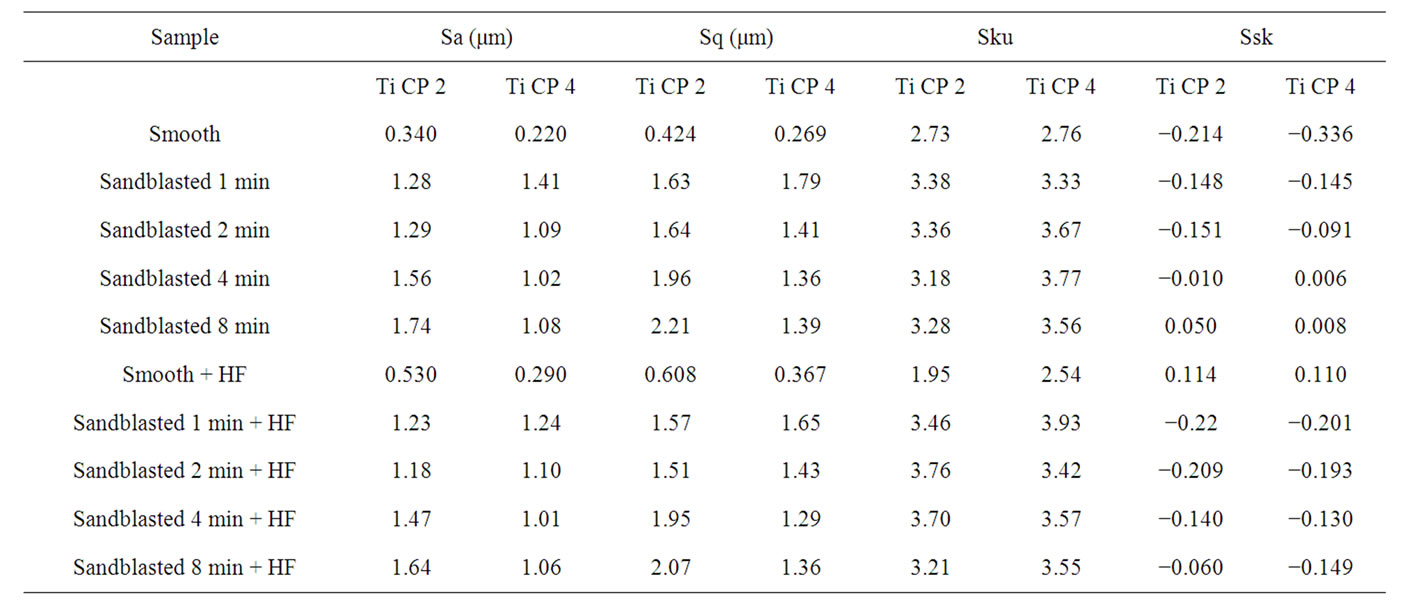
Table 2. Roughness parameters values obtained using untreated, sandblasted and acid etched samples.
compare different samples. Due to Sa definition, it may happen that surface showing the same Sa value, are really made in very different manner. In the same time in evaluating, i.e., the adhesion of osteoblast to a surface, the experimental set-up should be described in detail to study, i.e., the key factors that could promote osseointegration. Finally, even if the chemical composition of some Titanium alloys is quite similar, it produces huge differences in their chemical and physical behavior.
4. CONCLUSIONS
Sandblasting and acid etching produce huge alterations on titanium surface, but their effect is correlated to several process parameters and to materials used. In our opinion more attention should be addressed in describing the sandblasting experimental set up and the same attention is required on the type of alloy used.
Very often the average roughness, Ra, is used to characterize the surface of medical device, but it alone, is not sufficient to obtain comprehensive surface description. We believe that roughness parameters analysis: Sa, Sq, Sku and Ssk, should be used, as a powerful technique to determine the effect of surface treatments on metallic materials. This remark should be reminded when experimental data, collected from several papers, are compared each other.
REFERENCES
- Monetta, T. and Bellucci, F. Electrochemical characterization of Ti CP 2 and Ti CP 4. Electrochimica Acta.
- Liu, X., Chub, P.K. and Ding, C. (2004) Surface modification of titanium, titanium alloys, and related materials for biomedical applications. Materials Science and Engineering, R47, 49-121. doi:10.1016/j.mser.2004.11.001
- Brunette, D.M., Tengvall, P., Textor, M. and Thomsen, P., (2001) Titanium in medicine. Springer, Berlin, Heidelberg. doi:10.1007/978-3-642-56486-4
- Ellingsen, J.E., Videm, K., Opsahl, L. and Ronold, H.J., (2003) Implants with modified surfaces for increased biocompatibility, and method for production thereof. US Patent No. 6627321.
- Cochran, D.L., Schenk, R.K., Lussi, A., Higginbottom, F.L., Buser, D. (1998) Bone response to unloaded and loaded titanium implants with a sandblasted and acidetched surface: A histometric study in the canine mandible. Journal of Biomedical Materials Research, 40, 111. doi:10.1002/(SICI)1097-4636(199804)40:1<1::AID-JBM1>3.0.CO;2-Q
- De Santo, I., Sanguigno, L., Causa, F., Monetta, T. and Netti, P.A. (2012) Exploring doxorubicin localization in eluting TiO2 nanotube arrays through fluorescence correlation spectroscopy analysis. Analyst, 137, 5076-5081. doi:10.1039/c2an36052g
- Wennerberg, A., Hallgren, C., Johansson, C. and Danelli, S.A. (1998) Histomorphometric evaluation of screw-shaped implants each prepared with two surface roughnesses. Clinical Oral Implants Research, 9, 11-19. doi:10.1034/j.1600-0501.1998.090102.x
- Wennerberg, A., Albrektsson, T. and Andersson, B. (1995) An animal study of cp titanium screws with different surface topographies. Journal of Materials Science: Materials in Medicine, 6, 302-309. doi:10.1007/BF00120275
- Bagno, A. and Di Bello, C. (2004) Surface treatments and roughness properties of Ti-based biomaterials. Journal of Materials Science: Materials in Medicine, 15, 935-949. doi:10.1023/B:JMSM.0000042679.28493.7f
- Meredith, D.O., Harris, L.G., Riehle, M.O., Curtis, A.S.G. and Richards, R.G. (2007) Effect of metal implant surface topography on fibroblast behaviour and bacterial adhesion. European Cells and Materials, 13, 77-79.
- Sul, Y.T., Johansson, C.B., Petronis, S., Krozer, A., Jeong, Y., Wennerberg, A. and Albrektsson, T. (2002) Characteristics of the surface oxides on turned and electrochemically oxidized pure titanium implants up to dielectric breakdown: The oxide thickness, micropore configurations, surface roughness, crystal structure and chemical composition. Biomaterials, 2, 491-501. doi:10.1016/S0142-9612(01)00131-4
- Suzuki, K., Aoki, K. and Ohya, K. (1991) Effects of surface roughness of titanium implants on bone remodeling activity of femur in rabbits. Bone, 6, 507-514.
- Watanabe, I. and Watanabe, E. (2003) Surface changes induced by fluoride prophylactic agents on titanium-based orthodontic wires. American Journal of Orthodontics & Dentofacial Orthopedics, 6, 653-656. doi:10.1016/S0889-5406(03)00197-5
- Luthen, F., Lange, R., Becker, P., Rychly, J., Beck, U. and Nebe, J.G. (2005) The influence of surface roughness of titanium on b1- and b3-integrin adhesion and the organization of fibronectin in human osteoblastic cells. Biomaterials, 26, 2423-2440.
- Feng, B., Weng, J., Yang, B.C., Chen, J.Y., Zhao, J.Z., He, L., Qi, S.K. and Zhang, X.D. (2002) Surface characterization of titanium and adsorption of bovine serum albumin. Materials Characterization, 49, 129-137. doi:10.1016/S1044-5803(02)00341-8
- D’Lima, D., Lemperle, S.M., Chen, P.C., Holmes, R.E. and Colwell, C.W. (2003) Bone response to implant surface topography. The Journal of Arthroplasty, 8, 928-934. doi:10.1016/S0883-5403(98)90201-7
- Wilk, J. and Kowalski, Z.W. (2003) Titanium surface after neutralized ion beam irradiation. Vacuum, 70, 87-91. doi:10.1016/S0042-207X(02)00622-X
- Tsukimura, N., Kojima, N., Kubo, K., Att, W., Takeuchi, K., Kameyama, Y., Maeda, H. and Ogawa, T. (2008) The effect of superficial chemistry of titanium on osteoblastic function. Journal of Biomedical Materials Research Part A, 1, 108-116. doi:10.1002/jbm.a.31422
- Hansson, S. (2000) Surface roughness parameters as predictors of anchorage strength in bone: A critical analysis. Journal of Biomechanics, 33, 1297-1303. doi:10.1016/S0021-9290(00)00045-2
- Taylor, H. (1999) Talysurf user instruction manual.