Open Journal of Applied Sciences
Vol.08 No.06(2018), Article ID:85756,45 pages
10.4236/ojapps.2018.86019
The Hub Status and Transportation Network of Kribi Port
Che Kingsleychenikwi1, Xuefeng Wang2
1Institute of Scientific Research, Shanghai Maritime University, Shanghai, China
2College of Logistics Engineering, Shanghai Maritime University, Shanghai, China
![]()
Copyright © 2018 by authors and Scientific Research Publishing Inc.
This work is licensed under the Creative Commons Attribution International License (CC BY 4.0).
http://creativecommons.org/licenses/by/4.0/


Received: May 15, 2018; Accepted: June 26, 2018; Published: June 29, 2018
ABSTRACT
In this paper, a study on four African ports was taken out that all have the capability to become a hub port that can serve the central African region. The paper sort to determine which port was most suitable and port indexing was the method that was used to evaluate these ports. The ports evaluated were the port of Kribi, the port of Bata, the port of Libreville and the port of Pointe-Noire. There were other models that were also used which included linear regression and linear programming which all contributed to providing the final results of the port with the most suitable potential to serve as a hub port and meaningful results were obtained. The final results showed that the port of Pointe-Noire was the most suitable port to serve the central African region as a hub port.
Keywords:
Hub Port, Kribi Port, Intermodal Network, Shipping Network, Logistics, Transhipment, Transportation, Indexing

1. Introduction
1.1. Background
The last twenty to thirty years have been filled with a lot of technological innovations around the world. Every industrial sector has invested in one way or another to either stay ahead of the competition or maintain its position at the level of competition it finds itself. The ports are not left behind. Maritime ports have evolved from the first generation to the second generation and now to third generation ports. For ports to survive at the level of competition at which they find themselves there is the need for constant improvement ranging from infrastructures, modern equipment’s, ports employees technical knowledge, customs procedures etc.
Ports have now been integrated into various logistics and supply chains so as to be able to provide effective and efficient services to meet dynamic customers’ requirements. The concept of a hub has often been implemented in different ways according to its functions such as logistics centre, freight terminal, distribution centre, and warehouse [1] . These logistics attributes enable ports to provide a wide range of value-added services so as to meet up with the ever-changing transportation demand. International trade and industrial distribution have caused a great impact on the development of logistics facilities as they are the main strategic contributor to achieving competitiveness and attractiveness [2] . The hub concept was introduced and used extensively by the Aviation industry were airlines used a hub airport for receiving and redirecting the movement of passengers and also for the distribution of goods generally by a single carrier [3] . This later became the primary model of distribution used by logistics operators such as UPS, FedEx, EMS, TNT and DHL and other leading international carriers. This facilitated shipments from other origins to be consolidated at major terminals being the hubs and distributed to their final destinations using links being the spokes.
When it comes to maritime logistics, there are three main actors that come to play in maritime transportation. These actors are the port operators, shipping companies and freight forwarders. Even though maritime shipping involves the movement of goods from one port to another, it also helps in providing logistics related services so as to support the overall logistics flow of goods including outbound/inbound bill of lading, container tracking and intermodal services and pick-up services. Ports that are integrated into modern logistics systems are involved in various value-added services which include; warehousing, storage, sorting, packaging, packing and the arrangement of hinterland transportation modes such as railways, roads and coastal shipping/or inland waterway transport. The maritime industry within the past years have witnessed a proliferation in trade and though the increase in trade was good for economic growth, it brought about some significant challenges such as the deployment of bigger ships, a high level of competition between shipping lines and ports both internationally and at the regional levels. The Liner shipping industry has been the major contributor to the world’s economy as it accounts for 70% of the total value of trade by sea [4] . Seaborne trade has accounted for about 90% of trade globally and about 70% value wise [5] .
The growth of containerization has now enabled shipping lines to compete through the acquisition of larger vessels so as to gain a competitive advantage through economies of scale hence also attracting shippers with huge consignments to be shipped [6] . This has therefore redefined the structures of seaports. These large vessels can now be accepted by only a few ports such as hub ports which have now divided ports into hub ports which are usually big ports and feeder ports which are usually small in size. These conditions caused a shift in power which favoured big shipping lines and the potential of handling larger consignments is a significant challenge faced by smaller shipping companies including smaller port terminal operators [1] . Because of these significant changes, analyzing the relationships between a port container terminal and its region should justify for development in the transportation of containers and also the difficulties among ports and their region [7] .
For transportation companies to be able to utilize their limited capacities efficiently among other things, they tend to form strategic alliances in which services are shared and also concentrated on a few nodes [8] and a suitable example being the Hub-and-Spoke network. This is because some few hubs will serve as a main node or a node linking feeder vessels by connecting them to the nodes specifically using the hub. A direct link to the other nodes is generated through this point-to-point network which radiates from a base [9] [10] [11] [12] [13] . Considering the fact that hub and spoke networks has led to a significantly fewer number hubs ports and larger number of feeder ports, this can nevertheless diversify the status of a container port from a peripheral to a global hub port in accordance with its status in inland networks, shipping networks, and logistics chains being provided around the port [1] .
To be able to determine a container’s port function within its regional economy, it is important to measure the port’s hub potential. This paper seeks to determine the potential of Kribi port which is a newly constructed port in the Southern Region of Cameroon to serve as a hub vis-a-vis other ports in Central Africa especially in the Economic and Monetary Community of Central African States (CEMAC), looking at existing logistics operations, shipping networks and hinterland networks. Central Africa is made up of ten (10) countries out of which six (6) belongs to the CEMAC Zone (Image 1). These six countries include Cameroon, Chad, the Central African Republic, Gabon and Equatorial Guinea. The research will be based on the newly constructed Kribi port in Cameroon vis-à-vis the other ports in the CEMAC Region which includes; Port of Bata in Equatorial Guinea, Port Libreville in Gabon and port of Pointe-Noire in the Democratic Republic of Congo. A total of 4 ports will be examined. It is worthwhile noting that articles have been written suggesting the other ports have the potential of becoming a regional hub port. So this paper will evaluate the four ports and determine which port can actually serve as a hub port. The index employs vital factors relating to port activities and operations and will measure how these ports are connected to their transport networks. That is to say, the index will consider container port indices that are already available, for example, liner shipping connectivity index [14] , world shipping networks with accessibility to port index [15] and also the accessing index for hub status [16] . We also looked at Governance index and also considered the geographical locations of the various ports. The container throughputs of these ports were evaluated using a Time Series Extrapolation method. A linear programming model was used to
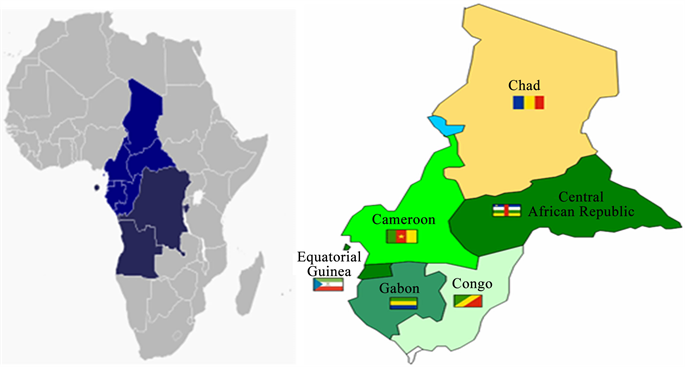
Image 1. Map of CEMAC Zone. Source: Wikipedia.
determine the ports suitability in terms of geographical locations of the ports in relation to freight rates on some shipping routes. All these methods were used to determine whether Kribi port has the potential to serve as a hub port for Central Africa especially the CEMAC Region.
1.2. Problem Statement
International and Inter-Regional trade in Africa has increased significantly within the past 10 years. Ports have experienced a significant rise of container throughputs they handle yearly and this poses a significant challenge due to their inadequate infrastructures, poor or limited handling equipment and a limited storage capacity. The port of Douala in Cameroon is not an exception as it has a limited port draft, a limited number of sea-to-shore gantry cranes and a significant level of port congestion. Never the less it serves as a transit port for landlocked countries such as the Central African Republic and Chad. Can the newly constructed Kribi port, have the potential to operate as a modern port to improve Cameroon’s economic activities and also serve as a hub for the central African Region?
1.3. Research Objectives
Cameroon’s strategic location as a transit point for the import and export of consignments from landlocked countries such as Chad and the Central African Republic gives an advantage for Cameroonian ports when it comes to port competitiveness within the Central African Sub-Region and in the West-Central African region put together. The level of trade among African countries and the rest of the world especially China has increased within the past years and the freight rates between Africa and the other continents are very high. One way to solve this problem is for the construction of a hub port that can receive larger vessels to benefit from economies of scale and feeder vessels to redistribute the containers from the hub port to the smaller ports. Evaluating the potentials of a Cameroonian port to serve as a hub port, redistributing transit goods to the other central African countries is a suitable way to expose the port’s potentials to the market hence, improving on its competitive advantage.
The main objective of this research was to evaluate the potential of the newly constructed Kribi port in Cameroon to serve as a hub with respect to the other port in the Central African Region using port index modelling and other analytical tools.
The secondary objectives of this research entailed the following:
Ø Analyzing the status of the port’s infrastructure.
Ø Determining the various transport modes, linking the ports to the hinterlands.
Ø Determining the amount of capacity the ports could handle.
Ø Determining the ports shipping networks.
Ø Evaluating the port’s geographical locations.
2. Literature Review
2.1. Introduction
Since the establishment of the hub concept, a significant amount of research has been carried out especially in the developed countries but much has not been done when it comes to the African ports. Different types of hub models have been developed and this research is going to look at some of these models.
The literature that was reviewed was taken from the relevant research publications, Maritime Magazines, Port Reviews, e-journals and articles, textbooks and theories from experts.
2.2. Selecting a Hub Port
For a port to be able to serve as a transhipment port or as a hub port, it should be able to provide adequate logistics shipping services. The location and the environment of such a port are of vital importance. Due to the fact that most container logistics centres serve as bases for merchandise transport, container carriers need to select a more favourable location for a transhipment port to serve their customers’ requirements which is of paramount importance [17] . Lee et al. [18] and Tongzon [19] ; have given some vital factors necessary to be able to serve as a logistics hub port which involves the following; a good strategic location, a large port area with the capability for handling larger vessel, the ability to provide excellent operational quality with flexibility and the role of government in providing good laws/regulation and also providing the platform for free trade zone or the development of free economic zones. Ji-Feng et al. emphasize on the fact that the location of a hub port should be strategical so as to minimize deviation from the main trade lines and to ensure feeder services from the spoke networks [17] . This, therefore, means that hub ports cannot compromise on delivering quality services because high productivity in terms of effectiveness and efficiency, ships turnaround time and handling equipment’s for big ships are the vital factors shipping lines take into consideration. However, sometimes it is very difficult to strictly compare any two or more container terminals due to physical or institutional factors which influence productivity. It will also appear not appropriate to develop international standards for a terminal’s productivity. Terminals should be compared on a case-by-case basis with due diligence. Another point to consider is that measuring port competitiveness should not be based easily on quantifiable factors like a port’s technical efficiency in vessels and cargo handling or on cost and price. Rather, a holistic approach which uses other parameters which cannot easily be quantified such as trade patterns, geographical locations, government policies could be used to assess a port’s competitiveness [15] .
When we consider the hub and spoke development, we notice that the classifications of ports are in three different groups which are hub ports, medium ports and feeder ports. It should be brought to our attention that the main criteria for the port to serve as a hub shouldn’t be the rate of cargo throughput but the rate of cargo transhipment [20] . To support proper logistics activities, there is the need for intermodal networks linking the hub ports to the hinterlands or land lock countries through roads, rail and or inland waterways. There is also the need for logistics centres or district-parks to facilitate storage, sorting and repackaging of goods. Also, the port infrastructure and handling equipment’s should be of high standards and should be reliable.
Some major Asian and European ports have established several international logistics hubs which have enabled global strategic businesses, which have provided value-added services to a lot of firms. Singapore has the necessary infrastructural support that makes it a strategic location for major shipping routes. Its seaports are well structured and they provide an effective network of telecommunication, an attractive pro-business environment which does not compromise on information technology and also a wide range of business capabilities, notwithstanding a skilful and cultured workforce. There are over 6000 logistics companies in Singapore that provide integrated logistics services which entail transportation, warehousing, forwarding and distributions for multinational companies. The Netherlands serve in the same capacity in Europe.
There are some models that have been used for evaluating or selecting a hub port such as; port hub indexing , analytical hierarchy process (AHP), fussy AHP for multi-criteria-decision making, Normalize pair-wise estimation, Factor Analysis with other linear programming models just to name a few. Whenever research analyst tries to measure a port accessibility or a transportation node, they try to assess a port’s or a transportation node’s connectivity to its hinterland [21] . This is useful when assessing only one transportation modal connection but it will not be sufficient to assess an intermodal transport especially ports with multiple transportation networks that are close together. This, therefore, means that accessibility evaluation will not be a valuable indicator for a container hub port as it should have served with a port accessibility index that could have been used to assess only one transportation mode [15] . Therefore, a node that has multiple functions an example being a container port in an intermodal transport network, measuring and indexing will be more appropriate in assessing the intermodal role of a hub port.
Although the AHP model has been widely used in decision making in multi-criteria problems, it, however, poses some significant limitations. Hartwich [22] ; identified some limitations with the AHP. His critique was the lack of sufficient guidance on how to structure the problem or the challenge that needed resolving, developing the hierarchy level criteria’s and aggregating the opinions of group members when they are disposed of geographically or subject to time constraints. As the hierarchy level increases, it becomes more difficult to synthesize weights. The model again was criticized based on the connection associated with significant changes in rating or when alternatives are added or deleted from compared alternative sets. While Geoff Coyle [23] ; criticizes the model on the bases that it only works because the matrices are composed of the same mathematical form which is reciprocal of the positive matrix.
2.3. Hub & Spoke Models
There are several types of hub and spoke models that have been formulated over the years. This paper is going to look at a few of them. The models can be applied in different situations from supply chains to ports.
2.3.1. Hub with Dedicated Spokes
This is a type of hub and spokes model with the hub being linked to several numbers of spokes as shown in Figure 1. The main function of this model is to ensure that the hub sets a high quality of performance standards, managing risk, operating procedures and also to make sure the spoke centres are compliant. The hub also supervises all the projects and delivery of resources at the spoke. The spokes may not be fully equipped with the managerial ability to manage client. This management responsibility is hence controlled by the hub. This, therefore, means that management control is taking care of by the dedicated hubs and the spokes are in conformity with the implemented rules and regulations in the countries they are located. When it comes to operations, for example, the hub makes the necessary decisions on allocating work to the spokes.
This model is suitable for spokes that are located in areas with specific value propositions such as specific skills, low cost or some culture bond with the client that could be suitable for a particular hub and no other. This model can also be advantageous where a spoke is expected to carry out low skilled tasks [24] .
2.3.2. Single Spoke Serving Multiple Hubs
This model represents a spoke in a suitable geographical location that is able to serve multiple Hubs as shown in Figure 2. The spoke is able to handle specific requests from the hubs thereby providing them with the necessary expertise they

Figure 1. Hubs with dedicated spokes system.
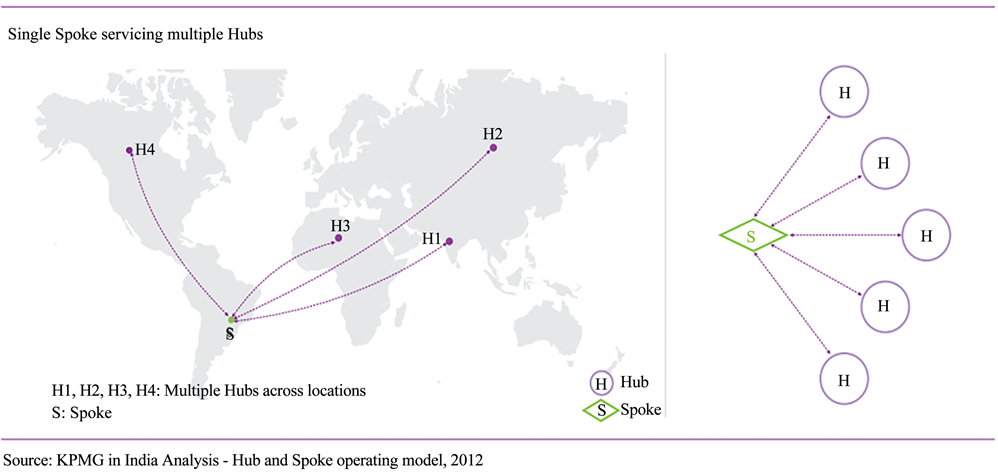
Figure 2. Single spoke servicing multiple Hubs.
need. This indicates that the spoke is supposed to have high-level management that can receive and execute tasks from the hubs. The spoke will also need to have a different management in operations. Hence, this model needs some degree of corporation between the spoke and the hubs to ensure smooth communications and operations.
This model is most suitable when a spoke is competent and has the necessary resources to carry out a specialized task [24] .
2.3.3. Hubs with Shared Spokes
In the model, the hubs have multiple spokes that serve them as shown in Figure 3. The hubs have a network of spokes and each spoke is capable of serving multiple hubs. The hubs provide quality and performance standards, operating procedures, allocation of work, manage risk and will ensure a spoke’s compliance specifically to its area. This model requires some sort of reporting from the spokes to the hubs and hence some management level is needed at the spoke to coordinate smooth operations and flow of communications at both sides. The hubs control projects and the spoke makes sure jobs are completed. Usually, a spoke is shared in situations where it functions as a large delivery point with the ability to support multiple competencies. This model is suitable in cases where spokes have the required resources to cater for multiple hubs.
2.4. Maritime and Port Analysis in West and Central Africa
Ports in Africa as a whole still phases deficit in port infrastructures which continues to hinder port performance and efficiency. The lack of proper planning for the transportation sector causes limited prioritization and investments to support this sector. However, there are significant investments that have been carried out by the French company Bolloré and also Maersk with other major shipping lines in many African countries that have helped to improve on port infrastructures and performance. An example is the Bolloré container terminal in Pointe Noire in Congo republic that was constructed in 2009, has helped increase the port's capacity tremendously.
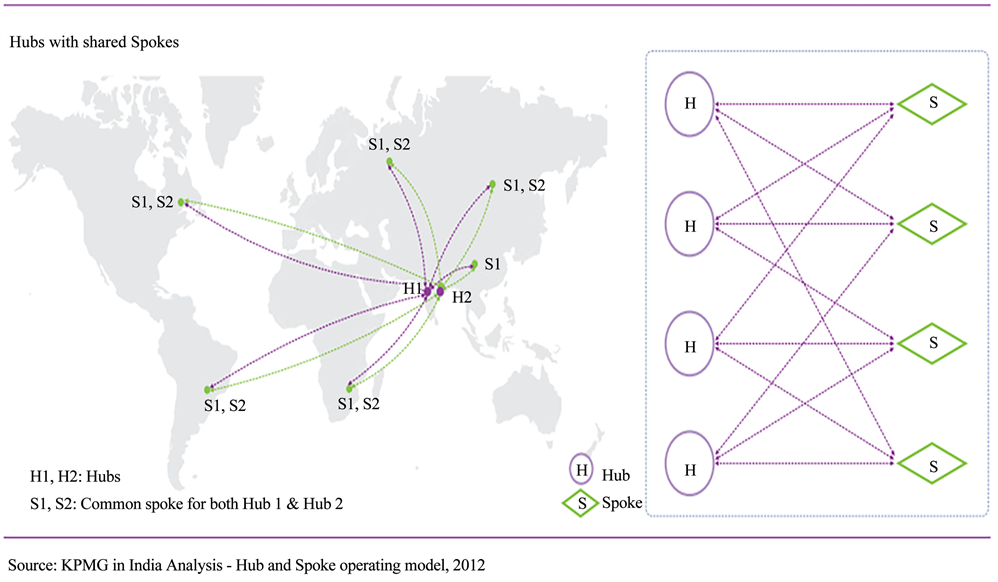
Figure 3. Hubs with shared spokes.
According to the African bank report, Africa has experienced a rapidly growing rate of containerization at a pace of more than 10% annually. However, the rate of container traffic from Africa is still marginal when compared to the overall global traffic. The share of container traffic from African ports ranges from 0.6% to 0.85% [25] . Moreover, African ports record the largest number of empty containers that are being shipped out. This is mostly because most exported goods are not containerized due to Africa’s low volume of manufactured export and Africa mostly depends on manufactured imports which reflect a lack of trade balance for the continent. Despite all this, there are still significant investments being carried out on container terminals like what the Bolloré Africa Logistics Group is doing in most African ports. Most African governments are now opening up for partnership with foreign investors to improve and expand the various port infrastructures in their respective countries which covers container terminals, dry bulk terminals and oil terminals [26] .
Maritime Services in the West and Central Africa
When it comes to maritime services in the west and central Africa, it ranges from the local feeder or cabotage serving in the West African coastal ports. It also considers feeder services from other transhipment hubs whose destinations are the west and central African ports with also direct lines from America, Europe and Asia that serves these same ports [27] . Containerized services for west central Africa currently comprises 84 services. Almost 60% are direct services and 40% are feeder services.
Services that are considered as direct services are those that serve the ports on west central African coast ranging from Asia, northern and southern Europe, the Mediterranean, North and South America. Feeder services are considered local when they depart from a local port in West Africa, or if they are lines that operate out of a transhipment hub such as Tangier Med, Las Palmas and Algeciras with West and Central African coast as their destination [27] . Tables 1-4 show the various feeder services in west and central African ports.
1) Local feeder services

Table 1. Local feeder services in west central africa.
Source: Alpha liner.
Table 2. Local feeder services.
Source: Alpha liner.
Table 3. Northern europe-west central african services.
Source: Alpha liner.
Table 4. Southern europe and mediterranean services-west central africa.
Source: Alpha liner.
2) Northern Europe services
The direct routes from North Europe to the west and central Africa has 18 services out of which only 5 are container lines and the rest are Ro-Ro and multipurpose ships. Figure 4 indicates the ship owner’s market share.
3) Southern Europe & Mediterranean services
There are 11 direct services from southern Europe and the Mediterranean that serves the west central African ports. Altogether there are 52 ports of call serving 23 different ports. Almost 70% of the ships serving this route are containerships and the remaining 30% are ro-ro and reefer ships. Figure 5 shows the ship owner’s market share.
4) Transshipment hub services
There are a total of 18 routes that serve the west central African ports from other hub ports and the major line that serves these routes is the Maersk line. Totally, there are 47 ports of call represented in west central Africa serving 22 different ports. All the services that leave the transhipment hubs are all containerships with different capacities. Tables 5-7 show the various transshipment hub services in west and central African ports.

Figure 4. Ship owner’s market shares. Source: Alpha liner.

Figure 5. Ship owner’s market share. Source: Alpha liner.
Table 5. Hub services-west and central africa.
Source: Alpahliner.
Table 6. Asia-west central african services.
Source: Alpha liner.
Table 7. North & South america-west central african services.
Source: Alpha Liner.
Maersk line/Safmarine has 64% of transhipment hub services to west-central African ports. They offer 11 container services that comprise of 53 container ships with a capacity of 20,169 TEU while MSC provides 12% services with a capacity of about 3800 TEUs. A partnership between UASC/Evergreen provides 10% of the service, 9% by CMA-CGM and the remaining 5% by Mol/Hapag Lloyd/ZIM [27] as shown in Figure 6.
5) Asian services
There are 15 direct services on the Asian-west central African maritime container route. China plays the largest part with about 75% of the direct services, especially from Shanghai and Tianjin ports. India offers 13% of the services with South Korea and Malaysia each offering one service. The services departing from Asia operates about 80% of a container ship with the rest 20% being multipurpose ships.
Maersk Line and CMA CGM operate 31% & 29% respectively on this route. PIL is the next to operate with 18% of total capacity. The other players in this route are Nile Dutch with 8%, the partnership of GSL & Evergreen operate 7% and finally but not the least, the partnership between Hapag Lloyd, NYK, CSCL and K-Line with 7% of total capacity as shown in Figure 7.
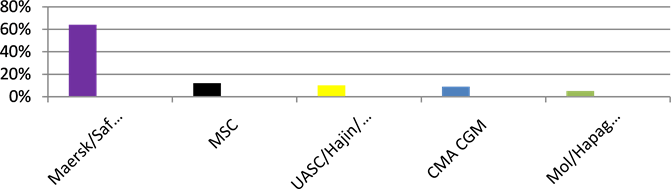
Figure 6. Market share of ship owners.

Figure 7. Ship owners market share. Source: Alpha liner.
6) North and South American services
There are six direct services on the routes from north and South America to west central Africa. Two of these services are from South American and four from North America. This route has the lowest capacity of the market segment with ships offering a total capacity of 25,200 TEUs. Out of the six services, only one is served by container ships and the rest is service by Ro-Ro and multipurpose vessels. There are 28 vessels operating on these routes and only five are container ships.
2.5. A Brief Overview of the Four Ports to Be Evaluated
2.5.1. The Port of Kribi
The Kribi deep sea port is located in southwestern Cameroon, on the Gulf of Guinea along the Atlantic Ocean (Image 2). The port is going to be the biggest port in the country and it is going to help reduce the problem of congestion in the port of Douala which is Cameroon’s main port. The construction of the port started in 2011 and the first phase was completed in 2014. The remaining phases will be completed by 2035 giving the port a total of 24 berths with a maximum draft of 25 m which will realize a handling capacity of 100 million tons. The characteristics of the port are shown in Table 8.
2.5.2. Port of Bata
The location of the port of Bata is in the north-west of Equatorial Guinea and it lies on the Gulf of Guinea (Image 3). The port is one of the main ports in the country. Table 9 shows the port characteristics.
2.5.3. Port of Libreville
Libreville is the capital of Gabon located in Central Africa. The port is located on the Komo River which is situated near the Gulf of Guinea (Image 4). The port which is known as the Owendo Terminal is being operated by Bolloré Africa
![]()
Image 2. Location of the port of Kribi. Source: Google Map.
![]()
Image 3. Location of the port of Bata. Source: Google map.
Table 8. Technical specification of Kribi port.
Source: Louis Berger & Bolloré.
Table 9. Technical specification of bata port.
Source: Bolloré.
Logistics. The port has the ability to host vessels with capacities ranging from 1000 - 1999 TEU, and a limited capacity of vessels ranging from 2000 - 2999 TEU. Table 10 shows the port characteristics.
2.5.4. Port of Pointe-Noire
The port of Pointe-Noire is located in the second largest city in the Republic of Congo along the Atlantic Ocean (Image 5). The container terminal in Pointe-Noire is operated by Congo Terminal and its multipurpose terminal is being managed by Congo Services, Socomab, SDV-Manutention and Socotrans. Table 11 shows the specifications of the port.
3. Methodology
3.1. Introduction
The research paper is adopted a scientific method of research. It is used a hub
![]()
Image 4. Location of the port of Libreville. Source: Google map.
![]()
Image 5. Location of the port of Pointe-Noire. Source: Google map.
Table 10. Technical specification of owendo terminal.
Source: Bolloré Africa Logistics.
Table 11. Technical specifications of Congo Terminal.
Source: Bolloré & Port report Africa.
port indexation evaluation method to evaluate four ports in Central Africa. The main source of data was from containerization yearbook, port websites, maritime magazines, port operators and other academic research. The criteria used for selecting the four ports were based on the port’s size and draught respectively. The port measurement in this paper was limited only to containerize cargoes i.e. the twenty-foot container unit (TEU) and all other cargoes such as general cargo, crude oil, ores and coal were considered. It should be noted that while this paper sort to use a novel method of evaluation to obtain a proxy for a container port to serve as a hub, Yong-An park & Francesca, M [7] applied a similar approach covering containerized cargoes and general cargoes when they evaluated some Asian and European ports. But the approach used for this research has been adjusted to represent the characteristics of the African ports being evaluated.
The method involved Port Classification sub-Index which deals with shipping network scale and Inland network scale and also Port Capacity Sub-Index which deals with the handling capacity of the ports. The shipping network scale will evaluate the network potentials of the container ports by looking at the sizes of ships that have access to these ports and their container slot capacity. Three different shipping lines network groups were considered which included continental, regional and feeder networks. A network of shipping scale of each container ship was weighted using their container slot size. Table 12 shows a Post-Panamax representing a continental network, a regional network represented by Panamax and an average size ship for a feeder network [28] . The container ship sizes and their slot capacity represented the container port’s network potential [29] . The following ship sizes were used as a relative scale of each shipping network.
Hence, a container port having three shipping networks will be able to service three different sizes of container ships. This helped the researcher to evaluate the scale of each container port’s shipping network, as shown in Table 13.
The Inland network scale evaluated the transport infrastructures such as roads, railways, barge or short sea shipping, airports and Logistics parks as shown in Table 14.
Table 12. Shipping networks and representative ships.
Source: Park &al.; 2015
Table 13. Shipping networks and scale of each network.
Source: Park & el;
Table 14. Inland network and scale of each network.
Source: Park & el.
When considering the port classification sub-index, taking the arithmetic mean of inland network scale and shipping network scale, the port capacity sub-index could be calculated (CPI). Assuming that each shipping and inland network can affect the economic activities of a container port equally; their range of economic effect could be decided by different components of inland and shipping networks.
(1)
where,
PCIp: classification sub-index for port p, 0 < PCIp ≤ 1
SSp: shipping network scale of port p, 0 < SSp ≤ 1
ISp: inland network scale of port p, 0 < ISp ≤ 1
The port capacity index was meant to calculate the ports handling capacity to indicate the port’s efficiency and level. This was then put into two sub-indices. One used a scale to rate five dimensions of the container terminals which were the berth lengths, drafts, container yard (CY) density, operating hours and the number of ship-shore-cranes while the second determined changes in handling capacity in case of an increase in handling capacity of the container ports. Because Kribi port is a new port, its mechanical handling capacity will be higher than the other ports because it equipment’s are newly installed hence creating a bias to the other ports which operate with old equipment’s. This is the reason why the ports handling capacities did not consider their mechanical handling capacities. Table 15 shows the port capacity sub-index of the container ports.
3.2. Port Capacity Sub-Index 1
Where,
PSI1p is port capacity sub-index 1.
3.3. Port Capacity Sub-Index 2
Here, we consider a possibility of an extreme increase or decrease of handling capacity of a container port, a relative value of changes in handling capacity can be developed. Here, we assumed that the capacity of extreme increase will become twice that of the previous capacity; and the capacity of extreme decrease
Table 15. Container terminal’s dimensions scale.
Source: Author’s elaboration.
will become half of the previous capacity.
(2)
where,
Capacityt: handling capacity of present year t,
Capacityt − 1: handling capacity of previous year t,
1/4 ≤ PSI2p ≤ 1
Therefore, the changes of handling capacity for a container port terminal could be assessed by PSI2: in the expansion of capacity when PSI2 exceeds 0.5; and in shrinkage of capacity when PSI2 is below 0.5.
Due to limited information on specific data of some of the container terminals for 2014 and 2015 respectively, we used the following hypothesis to determine the handling capacities of the ports. The container throughput of a country is directly proportional to the container throughput of its individual ports respectively. To test this hypothesis, we shall consider the container throughputs of the world’s top three container ports in proportion to their countries overall container throughputs from 2010 to 2014.
3.4. Governance Index
Another index that was used to evaluate the four ports was Governance Index. For a port to be able to operate as a hub port, it is of vital importance that the political status of the country where the port is located should be considered. A country with a stable political environment will be suitable for international trade and hence, suitable for hub port operations. To be able to do this evaluation, we used the World Wide Governance Indicator (WGI) as presented by the World Bank [30] . The WGI is a research dataset that summarizes the views on governance quality provided by a group of enterprises, expert surveys and citizens. These data’s are collected from non-governmental organizations, survey institutes, private sector firms and international organizations. The results were obtained using a statistical model known as the Unobserved Component Model (UCM). We will define Governance as “the traditions and institutions by which authority in a country is exercised” [30] . This paper considered five criteria’s of governance which were;
・ Political Stability and Absence of Violence/Terrorism (PV): This suggests the possibility of government becoming unstable or be removed by unlawful or violent means including politically-motivated violence and terrorism.
・ Government Effectiveness (GE): This relates to the degree of public service quality, civil service quality and with regards to the level of independence from political pressure, policy formation with the quality of implementation, and the reliability that government will adhere to the policies.
・ Regulatory Quality (RQ): This show ability of government to come out with good policies that will encourage the establishment and growth of the private sector.
・ Rule of Law (RL): This captures the perception of the extern of agent’s willpower to comply by societal rules, contract enforcement quality, property right, the police, the courts and the likelihood of riot and crime.
・ Control of Corruption (CC): This indicates the level to which public authority is used for individual aims, including small and big corruption methods, also “capturing” of the state elites and private interest.
A five years governance period will be considered from 2010 to 2015 with their percentile ranks averaged to determine their final score. The final score of the governance index will be calculated by solving the means and variance of the percentile ranks of the various indicators since some of the indicators might have the same mean using excel solver.
3.5. Time Series Extrapolation
A Time Series Extrapolation method was utilized to show the container throughputs of the four ports. This was to help us determine the port’s demand in terms of container traffic for the next five years. The model that was used was a Regression-Based Trend model and its purpose was to determine if the dependent variable follows a time trend. For a linear trend, the equation will follow the form;
(3)
On the other hand, for an exponential trend, the equation will follow the form;
(4)
A logarithmic transformation is required. Taking logarithms of both sides and using the rules of logarithms leads to;
(5)
which is linear in time t. Excel actually makes this transformation [31] .
where;
Y = dependent variable (container throughput)
t = independent variable (time period)
a = y-intercept (value of Y when t = 0)
b = slope or trend
Excel solver was used and its objective was to fit a linear and exponential trend lines to the countries container throughput’s data and to use the best trend line to forecast for future container traffic. To measure the goodness-of-fit of these trend lines, we determined their absolute percentage error (APE) using the following formula;
(6)
The measure of the goodness-of-fit will then be the average of the APE values, to give the mean absolute percentage error (MAPE).
3.6. Geographical Locations
We also considered the geographical locations of all the ports with regards to its immediate and extended hinterland and also some main shipping routes in terms of distance from their origin points to the various destination ports. This was to help determine the potential port markets and also to look at which ports were more suitable when using a particular shipping route to optimize freight rate.
3.7. Linear Programming Model
A Linear programming model was also developed to solve a transportation problem involving the freight rates to ship a container from the ports of origin to the ports of destinations. This was done by optimizing the transportation freight rates from a particular port of origin i to a port of destination port j. Letting Z be the total freight rate and xij( i = 1, 2 …, m; j = 1, 2 …, n) be the number of units to be shipped from source i to destination j. The following linear programming formula was used for this problem;
(7)
Subject to
for I = 1, 2 …, m,
for j = 1, 2 …, n.
And xij ≥ 0, for all iand j.
where,
Si = number of containers shipped from the port of origin
dj = number of containers received by a port of destination
4. Presentation of Results
4.1. Shipping Network & Scale of Each Network
When we compared the World Bank’s Liner shipping connectivity index with the shipping network scale, we saw that by 2015, Congo had the highest index followed by Cameroon, Equation Guinea and Gabon which is consistent with the shipping network scale showing reliability in the results as shown in Table 16 and Table 17.
4.2. Inland Network Scale
Table 18 shows the different intermodal connections between the different ports. The score of 0.8 shows the highest level of intermodal connectivity while the score of 0.4 shows the lowest level of connectivity among the ports. The inland network scale and the shipping network scale values determined the final value of the port classification-sub index as shown in Table 19.
Table 16. Shipping network scale.
Source: Author.
Table 17. Liner shipping connectivity index (World development indicators).
Source: The world bank.
Table 18. Results of inland network scale.
4.3. Port Classification―Sub Index
Table 19. Port classification results.
4.4. Port Capacity Sub-Index
4.4.1. Port Capacity Sub-Index 1
The different ports exhibit different characteristics evidence shown by the different scores as presented in Table 20 with the highest score of 1 and the lowest score of 0.6 evaluating their port capacity sub-index 1. Bata port does not register any score because of the limitation of data. Likewise, Table 21 shows the scores of the port capacity sub-index 2 with the highest score being 0.52549 and lowest being 0.52549.
Table 20. Port capacity sub-index 1.
4.4.2. Port Capacity Sub-Index 2
Table 21. Results for port capacity sub-index 2.
4.5. Governance Index
Table 22. Worldwide governance indicator.
Source: World bank.
From the percentile ranks of the various indicators of the respective years of each country as shown in Table 22, the mean and variance of all the indicators were calculated to show how the observations spread out from their averages as shown in Table 23. Excel was used to solve for the mean and variance.
4.6. Time Series Extrapolation
For the Time Series Extrapolation, we used Linear Regression model to determine the demand for container traffic for the various ports. Table 24 to Table 26 shows the representation of the results and Figure 8 to Figure 10 shows the linear and the exponential lines for the demand forecasts and we used the line with the least absolute percentage error as the forecast for the container throughputs.
4.7. Geographical Location
4.7.1. Intermediate and Extended Hinterland
The CEMAC Region has one of the major trade and transport corridors in Africa. All the CEMAC countries are linked to this corridor. However, the Cameroon-Chad and Cameroon -Central Africa Republic intermodal trade routes are the major trade routes in the CEMAC area. The port of Douala was the main port of transhipment to these countries. The Kribi port is going to strengthen the transhipment to these hinterland countries and also to the other neighbouring countries. Table 27 shows the extended hinterlands of Cameroon, Equatorial Guinea, Gabon and Congo Republic.
4.7.2. Shipping Routes Distances
The relation of a port’s geographical location to main shipping routes is of primary importance to carriers. A little or no diversion on a shipping route is suitable for carriers. The reason is that ports that have fewer diversion distances turn to achieve a higher transhipment proportion hence reducing cost. There are some few ports that have been selected as ports of origin to be able to determine their shipping distances i.e. transit time estimates along some major shipping routes to the four ports which serve as the destination ports. The origin ports are selected from North America (port of Los Angeles), China (Guangzhou), Netherland (Rotterdam) and Germany (Hamburg). Table 28 shows the various transit time estimates from the ports of origin to the ports of destination and Table 29 shows the total transit time.
4.7.3. Relevant Logistics Efficiency Indicators
The importance of a port’s logistics efficiency cannot be overemphasized especially when it comes to a hub port. Most shippers and other port users turn to select a port based on the port’s logistics efficiency which includes the number of import and export documents required by a particular port, the cost of import and export, and also the duration of import and export especially shippers from inland countries. Table 30 represents some logistics efficiency indicators of the four ports.
Table 23. Governance indicators.
Table 24. Demand forecast of cameroon.
Table 25. Demand forecast for Gabon.
Table 26. Demand forecast for congo republic.
Table 27. Extended hinterlands.
Table 28. Transit time estimates.
Source: cargorouter.com/freight-shipping.
Table 29. Total transit time.
Table 30. Logistics efficiency indicators.
Source: World development indicators.
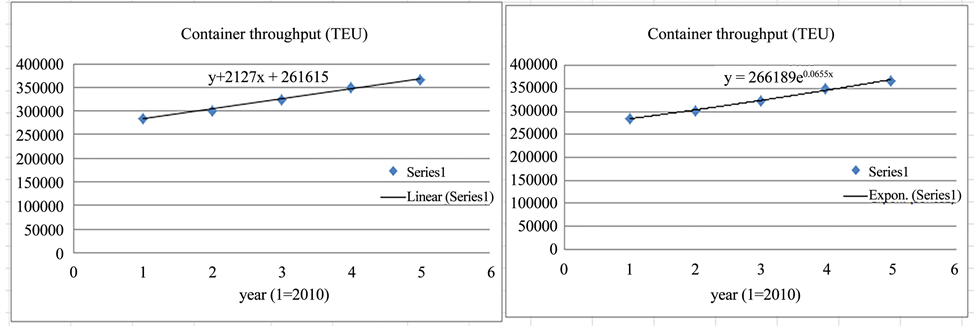
Figure 8. Regression series for cameroon.
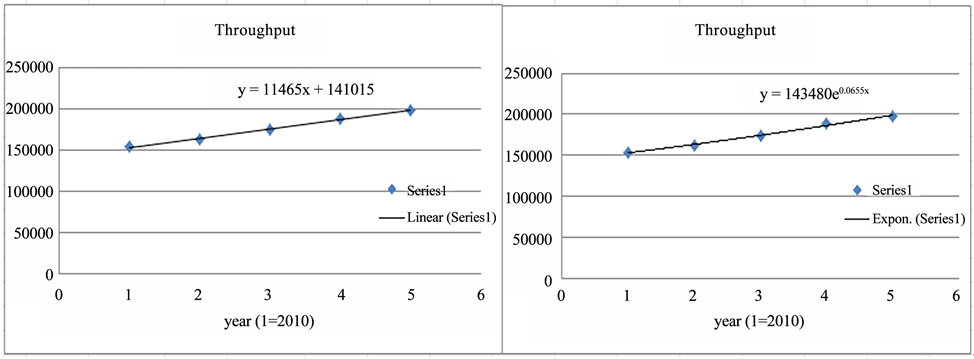
Figure 9. Regression series gabon.
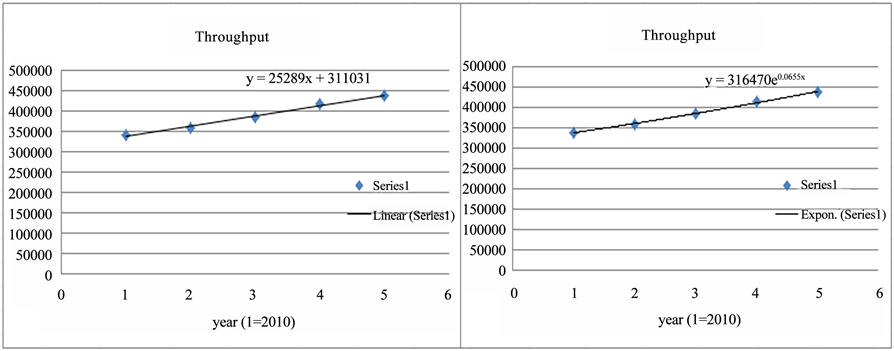
Figure 10. Regression series gabon.
4.7.4. Freight Rate Optimization
According to the United Nations Economic and Social Commission for Asia and Pacific (UN ESCAP), the inter-regional container trade in 2015 for Asia-Africa is about 44%, while Europe-Africa is about 33% and North America-Africa container trade is about 3%. From Table 28, we considered the combined freight rates from the ports of origin to the four evaluated ports so as to develop a linear programming model to solve a transportation problem to help optimize the freight rates. The aim of this model was to determine the port that will be suitable for shippers when considering shipping a container from Asia, Europe and North American so as to minimize the total freight rate of transportation. We assumed a potential shipper has freights in all the four origin ports and wanted to ship them to the four destination ports and will like to optimize his freight rate.
A linear programming model was developed using the following assumptions;
・ The number of containers shipped to a port will be based on the ports geographical location in terms of intermediate and extended hinterland considering a faster transit time to the hinterlands. The larger the number of neighbouring countries, the higher the probability of a country having a large transhipment freight.
・ A total number of 20 containers are to be shipped from the four ports of origin to the four African destination ports. Three (3) containers from Los Angeles, 10 from Guangzhou, 2 from Rotterdam and 4 from Hamburg ports respectively. Kribi port is to receive 10 containers while Bata port receives 2, Libreville 3 and Pointe-Noire 5 containers respectively. The distribution of the containers is based on the ports geographical location considering the number of neighbouring countries a particular country has. Table 31 shows the freight rates from origin and destination ports and Figure 11 shows the network representation of the model while Table 32 shows the excel representation of the problem.
Where LA = Los Angeles, GZ = Guangzhou, RT = Rotterdam, HB = Hamburg, KB = Kribi, BT = Bata, LB = Libreville and PN = Pointe-Noire.

Figure 11. Network representation of the model.
Table 31. Freight rates from origin to destination ports.
Table 32. Results of linear programming.
The mathematical representation of the model
Let Z denote total freight rate
Let xij(i = 1, 2, 3, 4; j = 1, 2, 3, 4) be the number of containers that are shipped from the origin port i to the destination port j.
Objective : Min Z= 6703x11+ 6918x12 + 7009x13 + 9182x14 + 4716x21 + 5460x22 + 5031x23 + 7168x24 + 4966x31 + 5881x32 + 5481x33 + 6893x34 + 5958x41 + 6173x42 + 6354x43 + 8310x44
Subject to constraints
x11 + x12 + x13 + x14 = 3
x21 + x22 + x23 + x24 = 10
x31 + x32 + x33 + x34 = 2
x41 + x42 + x43 + x44 = 5
x11 + x21 + x31 + x41 = 10
x12 + x22 + x32 + x42 = 2
x13 + x23 + x33 + x43 = 3
x14 + x24 + x34 + x44 = 5
And xij ≥ 0 (i = 1, 2, 3, 4; j = 1, 2, 3, 4)
Using excel to model the problem
5. Result Analysis
5.1. Shipping Network Scale
The shipping network scale was to determine the types of ships that the various ports could accommodate in terms of ship size according to the port’s sizes and draughts. The networks were divided into three categories being Continental, Regional and Feeder networks. The port of Kribi and Pointe-Noire had the capacity to handle continental network vessels while Bata port could handle regional network scale ships and Libreville could only handle feeder network vessels. The results were compared with the World’s Bank liner shipping connectivity index and the results were consistent as both Cameroon and Congo showed a high level of liner connectivity as compared to Equation Guinea and Gabon which both had a low level of connectivity respectively.
5.2. Inland Network Scale
The inland network scale was meant to evaluate the intermodal connectivity of the various ports with regards to roads, railways, logistics facilities and international airports. Pointe-Noire and Libreville had the highest intermodal connectivity with Kribi and Bata port following suit respectively.
5.3. Port Classification-Sub Index
The port classification index was determined by taking the arithmetic mean of both inland scale and shipping network scale and the results showed that Pointe-Noire has the highest result followed by Kribi, Libreville and Bata port respectively. This means that in terms of shipping network and inland network, Pointe-Noire and Kribi ports will be preferable.
5.4. Port Capacity Sub-Index
The results from the port capacity sub-index 1, which shows the port container terminal’s dimensions looking at the berth length, draught, container yard density, availability of cranes and the number of operating hours shows that Pointe-Noire has the highest position followed by Libreville, Kribi respectively.
The port capacity sub-index 2 shows whether the port can handle changes in the handling capacity in case of an increase or decrease in capacity. The results showed that Congo and Gabon has a higher weight to handle any change in capacity than Cameroon with respect to the specific ports.
5.5. Governance Index
The Governance index was aimed to evaluate the political status of all the countries to find out which country is more politically stable and hence can provide a favourable environment for establishing the hub port. The governance indicators that were considered included, political stability, governance efficiency, regulatory quality, rule of law and control of corruption. The final scores were determined by awarding points from 1 to 4, 1 being the lowest point and 4 the highest point according to each category’s mean. Table 33 shows the final scores of the governance index.
From the table, Gabon has the highest number of points, followed by Cameroon, Congo and Equation Guinea respectively. This, therefore, means that Gabon is more favourable in terms of governance index.
Table 33. Final scores of Governance index.
5.6. Time Series Extrapolation
The linear regression model was used to determine the demand for container traffic of the various ports. The equation for the linear line for Cameroon was y = 21271x + 261615. Here, y corresponds to container throughput increases by 21271TEU’s per year. The same linear equation line and its y values apply for the other countries.
The equation for the curve for the exponential trend line for Cameroon gave y = 266189e0.0655x. This implies that the container throughput increases by approximately 6.5% per year. The exponential trend line and its y value apply the same way for the other countries. Measuring the goodness-of-fit, the mean absolute percentage errors of the two lines give 0.63% and 0.52% respectively for the linear and exponential line. On average, the exponential line is off by 0.52% while the linear line is off by 0.63%. Hence, the exponential curve was used to determine the demand forecasts. From the demand forecast, Congo has the highest demand followed by Cameroon and lastly Gabon. Equatorial Guinea does not have any demand forecast. This means that the port of Congo attracts more container throughput than the other ports.
5.7. Geographical Location
When we consider each country’s extended hinterland, Cameroon has the largest number of neighbouring countries with 7 which gives Cameroon a higher chance to expand its intermodal operation. It is followed by Congo with 4, Gabon with 3 and Equation Guinea with 2 respectively.
Looking at the shipping route distances in terms of transit time estimates from different ports as ports of origin to the four ports being evaluated, we notice that Kribi port has the shortest distance from the port of Los Angeles with 66.35 days followed by Bata port with 66.7 days, Libreville and Pointe-Noire with 68 days and 71.7 days respectively. Meanwhile from Guangzhou port, Kribi port has the shortest distance with 32.8 days followed by Libreville, Bata and Pointe-Noire with 38.75, 38.45 and 41.55 days respectively. From the port of Rotterdam, Pointe-Noire has the shortest distance with 23.9 days followed by Kribi, Libreville and Bata with 25.75, 28.2 and 28.7 days respectively. Finally, from the Hamburg port, Pointe-Noire had the shortest distance with 24.5 days followed by Kribi, Bata, Libreville with 41.7, 42.1 and 43.3 days respectively. Combining all the distances from the four origin ports to the four destination ports, Pointe-Noire has the shortest distance with 161.65 days followed by Kribi, Bata and Libreville with 166.6, 176.3 and 178 days respectively.
We also look at other logistics efficiencies in terms of total import and export costs. Equatorial Guinea has a combined cost of $2990 followed by Cameroon, Gabon and Congo with $3646, $4420 and $11,385 respectively.
Total points from the Port index results
The final results are determined by allocating points for all the results from 1 to 4, where 1 is the lowest point and 4 is the highest point. Table 34 shows that
Table 34. Points from the port index.
the port of Pointe-Noire has the highest points followed by Kribi port, Libreville port and Bata port respectively. Therefore, Pointe-Noire has the highest potential to become a hub port for the central African region.
5.8. Freight Rate Optimization
From the results presented in chapter 4 in 4.7.1, a shipper will prefer to ship freights from Guangzhou port to Kribi port, freights from Los Angeles to Libreville, freights from Hamburg to Bata & Pointe-Noire port and freights from Rotterdam to Pointe-Noire. This, therefore, means that Kribi port will be more suitable for freights leaving Asia, Bata and Pointe-Noire for freights leaving Europe and Libreville for freights leaving North America. The statistics of trade in Africa shows that Asia-Africa trade has the highest percentage of all trade in Africa and so this result shows that for the central African region, if the port of Kribi is well managed and developed it can serve more markets and will be in the best position to serve as a hub port.
6. Recommendations & Conclusions
6.1. Recommendations
After going through all the port indexing and using other approaches to evaluate the four central African ports to show which one is suitable to serve as a hub port, the port of Pointe-Noire was the most suitable to serve as a hub port. However, Kribi port was ranked second which means it still has the potential to become a hub port. This paper presents some recommendations that can help achieve this goal.
The Kribi port was evaluated based on the first completed phase that is now under operation. This means that when the second phase and third phases are completed, the port will have enormous potential to serve as a hub. Therefore,
Ø The intermodal network system of the country should be strengthened. During the Forum on China-Africa Cooperation (FOCAC) summit in Johannesburg in South Africa, China’s president Xi Jinping promised that China was going to lean over $60bn to African countries and more than half of the funding will be invested in building infrastructures. This could benefit Cameroon to develop its intermodal network. Modernized railway lines and highways should be constructed and the existing ones should be properly maintained. These transport networks should be linked from the port to the landlocked countries to ensure efficient transhipment of goods serving the inland markets such as Chad and the Central African Republic.
Ø The vast available land space that is beside the port should be used to create a free trade zone. This could lead to the development of logistics parks which will attract logistics companies, manufacturing companies to take advantage of this and they will make good use of the port facilities and this will help increase the country’s economy, giving the port a competitive advantage and also creating employment for the citizens of Cameroon.
Ø A good custom clearance system should be adopted to reduce the number of documents and paperwork needed for import and export so as to help reduce customs clearance time. These systems should also be harmonized with cross-border systems so that it will help reduce the transhipment time especially along the Cameroon-Chad corridor which usually has a significant level of delays leading to a high cost of transportation.
Ø There are some Common Wealth Scholarships schemes that are provided by the European unions to developing countries and also China has a scholarship scheme with Cameroon Government where talented student are granted scholarships to pursue higher degrees in China. These are good opportunities for more Cameroonians to be trained to acquire professional skills in the maritime sector by obtaining higher degrees that will help cater for the lack of unskilled labour. A good recruitment system should be adopted to attract skilled and specialized workforce to ensure there is a high level of competency carried out during operations at the port. Also, short-term training courses should be provided to the human force at the port so as to equip them with new information and technology.
Ø One of the major investment projects carried out by China in Africa is the Chad-Sudan railway which is a 1344-km railway that is being constructed in three phases and it’s valued at $5.6 bn. This will be beneficial to Cameroon as it will link the two countries with Cameroon and hence lead to an expansion of trade between these two countries and so developing the country’s internal rail network to link it with the Chad-Sudan rail network will be advantageous for Cameroon. The port of Kribi has a good geographical location and so the government should take advantage of this and strengthen its bilateral relationships with its neighbouring countries so as to take advantage of its markets.
Ø The port of Kribi has a deep draft which makes the port suitable to accommodate larger vessels and so the port should provide a good governance policy which will attract shipping lines with large vessels to patronize the port’s facilities and also more technological handling equipment’s should be installed in the port.

Figure 12. New proposed one belt, one road. Source: Mckinsey.
Ø The One belt, one road initiative is another opportunity that could intensify China-Africa economic ties. Developing the Kribi port to serve as a hub port will go a long way to support and enhance this great initiative and so Cameroon government should cooperate more with China especially with the investment being carried out at the port of Kribi so that the port can be influential in the maritime silk route. Figure 12 shows the connection of OBOR to Africa.
6.2. Conclusions
The research paper has done a study on four African ports that all have the capability to become a hub port that can serve the central African region. The paper sort to determine which port is most suitable and port indexing was the method that was used to evaluate these ports. The ports evaluated were the port of Kribi, the port of Bata, the port of Libreville and the port of Pointe-Noire. There were other models that were also used which included linear regression and linear programming which all contributed to providing the final results of the port with the most suitable potential to serve as a hub port.
The final results ranked the port of Pointe-Noire in the Republic of Congo as the port with the most potential to serve as a hub, followed by Kribi, Libreville and Bata ports respectively. Despite the fact that the port of Kribi was ranked second, it still has a huge potential to serve as a hub port for the central African region because only the first phase that was completed in 2014 is under operation while the second phase is currently under construction and the third phase to commence by 2020. This will give the port a huge competitive advantage and will expand the port’s market share hence an increase in Cameroon’s economy and GDP.
Cite this paper
Kingsleychenikwi, C. and Wang, X.F. (2018) The Hub Status and Transportation Network of Kribi Port. Open Journal of Applied Sciences, 8, 226-270. https://doi.org/10.4236/ojapps.2018.86019
References
- 1. Nam, H.-S. and Song, D.-W. (2011) Defining Maritime logistics Hub and Its Implication for Container Port.
- 2. Cullinane, K. and Song (1998) Container Terminals in South Korea: Problems and Panaceas.
- 3. Cavinato, J. (1989) Transportation Logistics Dictionary. 3rd Edition, Transportation-Logistics Dictionary. https://doi.org/10.1007/978-1-4684-1509-4_1
- 4. United Nation Economic and Social Commission for Asia & the Pacific (2006) Integrated International Transport and Logistics Systems for North-East Asia.
- 5. United Nation Economic and Social Commission for Asia & Pacific (2005) Free Trade Zone and Port Hinterland Development.
- 6. Fremont, A. (2007) Global Maritime Networks: The Case of Maersk.
- 7. Park, Y.-A. and Medda, F. (2015) Hub Status and Indexation of Container Ports.
- 8. Aaderighi, M., Cento, A., Nilikamp, P. and Rietveld, P. (2007) Assessment of New Hub-and-Spokeand Point-to-Point Airline Network. Transport Reviews, 27, 529-549. https://doi.org/10.1080/01441640701322552
- 9. Nishimura, E., Imai, A., Janssens, G.K. and Papadimitrious, S. (2009) Container Storage and Transhipment Marine Terminals. Transportation Research E, 45, 771-786. https://doi.org/10.1016/j.tre.2009.03.003
- 10. Flemming, D.K. and Hayuth, Y. (1994) Spatial Characteristics of Transportation Hubs: Centrality and Intermediacy. Journal of Transport Geography, 2, 3-18. https://doi.org/10.1016/0966-6923(94)90030-2
- 11. Wang, J.J. and Slack, B. (2000) The Evolution of a Regional Container Port System: the Pearl River Delta. Journal of Transport Geography, 8, 263-275. https://doi.org/10.1016/S0966-6923(00)00013-2
- 12. Roso, V., Woxenius, J. and Lumsden, K. (2009) The Dry Port Concept: Connecting Container Seaports with the Hinterland. Journal of Transport Geography, 17, 338-345. https://doi.org/10.1016/j.jtrangeo.2008.10.008
- 13. Gelareh, S. and Nickel, S. (2011) Hub Location Problems in Transportation Networks. Transportation Research Part E, 47, 1092-1111. https://doi.org/10.1016/j.tre.2011.04.009
- 14. UNCTAD (2005) Transport Newsletter, No. 27, First Quarter, 4-13.
- 15. Cullinane, K. and Wang, Y. (2009) A Capacity-Based Measure of Container Port Accessibility. Journal of Logistics Research and Applications, 12, 103-117. https://doi.org/10.1080/13675560902749340
- 16. Low, J.M.W., Lam, S.W. and Tang, L.C. (2009) Assessment of Hub Status among Asian Ports from a Network Perspective. Transportation Research Part A, 43, 593-606. https://doi.org/10.1016/j.tra.2009.04.004
- 17. Ding, J.-F. and Chou, C.-C. (2013) An Evaluation Model of Quantitative and Qualitative Fuzzy Multi-Criteria Decision-Making Approach for Location Selection of Transshipment Ports.
- 18. Lee, S.W., Songh, D.W. and Ducruet, C. (2008) A Tale of Asia’s World Ports: The Spatial Evolution in Global Hub Port Cities. Geoforum, 39, 372-385. https://doi.org/10.1016/j.geoforum.2007.07.010
- 19. Tongzon, J. (2007) Determinants of Competitiveness in Logistics: Implications for the ASEAN Region. Maritime Economics and Logistics, 9, 67-83. https://doi.org/10.1057/palgrave.mel.9100172
- 20. Huang, W., Chang, H. and Wu, C. (2008) A Model of Container Transhipment Port Competition: An Empirical Study of International Ports in Taiwan. Journal of Marine Science and Technology, 16, 19-26.
- 21. Bergqvist, R. and Tornberg, J. (2008) Evaluating Locations for International Transport Terminals. Transportation Planning and Technology, 31, 465-485. https://doi.org/10.1080/03081060802335125
- 22. Hartwich, F. (1999) Weighing of agricultural research results: Strength and limitation of the Analytical Hierarchy Process (AHP).
- 23. Coyle, G. (2004) Practical Strategy. Open Access Material. AHP.
- 24. KPMG (2012) Hub and Spoke Operating Model: A New Business Paradigm for the Indian IT-BPO Industry.
- 25. African Bank (2010) Port Development in Africa.
- 26. Che Kingsley, C. (2016) Quality of Freight Mobility and Intermodal Connectivity in Sub-Saharan Africa.
- 27. MLTC/CATRAM; Final Report (2013) Market Study on Container Terminals in West and Central Africa.
- 28. Drewry Shipping Consultant LTD (2010) Container Market Review and Forecast 2010/11, 38-69.
- 29. Lam, J.S.L. (2011) Patterns of Maritime Supply Chains: Slot Capacity Analysis. Journal of Transport Geography, 19, 366-374. https://doi.org/10.1016/j.jtrangeo.2010.03.016
- 30. Daniel, K., Aart, K. and Massimo, M. (2010) The World Wide Governance Indicators. Methodology and Analytical Issues.
- 31. Albright, S.C. and Winston, W.L. (2010) Management Science Modeling. 4th Edition, McGraw-Hill Companies, Inc.