Surgical Science
Vol. 3 No. 1 (2012) , Article ID: 17011 , 7 pages DOI:10.4236/ss.2012.31004
Validating HeartSmart® against the Cardiopulmonary Bypass Machine
1Intensive Care Unit, Bradford Royal Infirmary, Bradford, UK
2Department of Health Sciences, University of York, York, UK
Email: *kensheartsmart@hotmail.co.uk
Received July 6, 2011; revised September 16, 2011; accepted November 4, 2011
Keywords: HeartSmart®; Cardiac Output; Cardiopulmonary Bypass; Hemodynamics; Intensive Care
ABSTRACT
Purpose: To assess the utility of HeartSmart®, a new method that uses empirical physiological formulae to estimate hemodynamic variables, in estimating cardiac index during open heart surgery when compared with the cardiopulmonary bypass machine. Methods: This was a prospective, blinded study of patients undergoing elective cardiac bypass surgery. We monitored and compared the flow rates provided by the cardiopulmonary bypass machine (roller pump) with estimates derived from the empirical physiological formulae embedded in the HeartSmart® monitor in 32 patients. Cardiac index values were compared at the start of cardiopulmonary bypass, during re-warming, and at the end of cardiopulmonary bypass. Results: A total of 256 paired sets of measurements were suitable for comparison. The mean of the differences or bias (95% limits of agreement) was 0.09 l/min/m2 and the limits of agreement −0.86 to 1.05 l/min/m2. The mean difference of the sets of 256 measurements was 585.5 l/min/m for the pump and 575.0 l/min/m2 for the empirical physiological formulae—a difference of 5% l/min/m2. The range of flow rates for the pump was 1.2 to 2.85 l/min/m2; for the empirical physiological formulae, the range was 1.2 to 3.0 l/min/m2. Conclusion: The cardiac index estimates derived from the empirical physiological formulae in the HeartSmart® software are in good agreement with pump cardiac output rates. These results suggest that HeartSmart® measurements are sufficiently accurate for assessing hemodynamic variables in many groups of patients.
1. Introduction
All bedside hemodynamic monitors are compared against pulmonary artery floatation catheter thermodilution, as this is the “standard” monitoring technique. Alternative technologies have as many sources of error as does the thermodilution method [1,2]. However, the cardiopulmonary bypass machine or pump, which delivers a known amount of hemodiluted blood per revolution, has fewer sources of error than the standard thermodilution method.
Neither the thermodilution method nor the alternative technologies can provide values of cardiac output/index that can be compared simultaneously to the flow rates delivered to the patient by standard roller pump during this phase of corrective cardiac surgery. Additionally, the roller pump flow rates do not vary unless the speed of the rollers is changed, resulting in fluid input changes; in the thermodilution method, however, the cardiac index/output values can change by more than 15% without any change in physiological parameters. The type of cardiopulmonary bypass and cannulae used is determined by the surgeon and depends on the corrective cardiac surgery to be performed.
We present a new, unique method, which uses empirical physiological formulae for estimating the majority of hemodynamic variables as the platform for continuous cardiac dynamic monitoring. This software program, known as HeartSmart® (Harlow, Essex, UK), has been clinically trialed since 1997 in many different groups of patient [3,4]. We begin with a description of the cardiovascular physiology underpinning the empirical physiological formulae embedded in HeartSmart®. Many medical algorithms do not necessarily have a physiological explanation of their conception and/or development, so one biochemical aspect of HeartSmart® (i.e. the action of the heart rate and its importance in the cardiac index formula) is also described.
2. Materials and Methods
2.1. Physio-Biochemistry
The continuous cardiac dynamic monitoring empirical physiological formulae require the physiological parameters of heart beats per minute (HR), mean central venous pressure (CVP), mean arterial blood pressure (MAP) and temperature of the blood (T) in ˚C. From these parameters, an empirical value of K can be calculated [5]. The K look-up table has been developed using the heuristic empirical research method [6] to derive and compare cardiac index values with those of the thermodilution method. However, if there were data on accurate direct measurements of cardiac index/output, K values could be re-evaluated to those values and would thus be more accurate than those based on estimates of cardiac index/output using the thermodilution method.
Briefly, we explain just one of the biochemical functions in the myofibrils that has a direct effect on cardiovascular physiology in respect to the driving force behind preload (CVP) affecting cardiac index/output, including the determination of the value of K in Figure 1.
The values of K and its constituent parts can be explained by Starling’s Law of the Heart [7,8] insofar that the contractile stress with respect to each contraction of the myofibrils, and the relationship between the length of the myofibril and the speed of recoil of the myofibrils, are directly related to the power of the contraction of the myofibrils in the cardiac muscle [9]. The Herculean protein, titin, functions as a molecular spring in cardiac muscle, and is responsible for most of the passive tension of myocardium. The titin spring is extended during the diastolic stretch phase, recoils elastically during the systolic phase, and potentially influences the overall shortening behavior of cardiac muscles.
Studies have established that titin:
1) Develops passive force when sarcomeres are stretched [10-12].
2) Is important for centering the myosin filaments in the sarcomere during active contraction [13].
3) Contributes to the muscle’s viscous/viscoelastic properties [10,14] and
4) Is a finely tuned molecular spring that is capable of adjusting its mechanical properties to the particular requirements of the muscle [10,11,15].
There are many other physio-biochemical reactions taking place in the myofibrils of the sarcomeres that affect the contraction of the cardiac muscles in relation to cardiac index/output and other functions that alter cardiac pathophysiology, e.g. in ischemia.
One of the components in K is compliance in the heart and lungs, which is dependent on the function of titin in respect to the speed and force of recoil of the myofibrils. It is this force and power of contraction of cardiac muscle that is directly related to the cardiac output/index of the heart. Starling observed that preload status is a function of volume of blood or venous return back to the heart [7,8].

Figure 1. Bandwidths of central venous pressure and heart rate producing the value of the constant K. CVP, central venous pressure.
The K look-up table covers a wide range of values generated from mean CVP and HR values [3], and so provides K values even for patients with shock and sepsis [4]. In the K look-up table, K values for HRs of less than 59 beats per minute range from 15 to 40, which tends to give a low cardiac index. In the normal range of heart beats per minute, K values are between 40 and 100 provided that the mean CVP does not exceed 16 mmHg. In patients with a CVP of ≤15 mmHg and with sinus tachycardia, K values are 100. In those patients with sepsis/ shock and a whole range of CVPs, K values can vary— especially at high CVP values—from 50 through to 1000.
Changes in HR, where the bandwidth of CVP remains constant for a single change or multiple changes in HR, will produce a uniform change in stroke volume index (SVi = Ci/HR) [4]. The four constituents involved in regulating cardiac index/output, HR, contraction, preload, and afterload are represented in the K look-up table and in the new empirical physiological formulae for estimating cardiac index/output.
Impedance cardiography using waveform analysis shows that there is a ratio of 1:1 between the area under the diastolic portion of the arterial pulse pressure trace/waveform (the diastolic pressure-time index) to the area under the systolic component of the arterial pulse pressure trace/waveform (the systolic time-tension index): this means the volume of blood is equal in both ventricles and this relationship has been used to predict the relationship of myocardial blood supply to oxygen demand. Following on from this rationale, the right and left ventricular end diastolic volume indexes should be equal, and the right ventricular end diastolic volume index and/or pressure is a more reliable indicator of preload or venous return. However, when assessing hemodynamic status, all the hemodynamic variables should be considered.
Excessive CVPs may contribute to stiffening compliance and low capacitance, leading to low cardiac index and pulmonary edema or other respiratory complications. While pressure is normally proportional to volume, it tends to become disproportional to flow outside of the normal range of mean CVP, mean pulmonary artery, and mean pulmonary artery occlusion (wedge) pressures.
It is known that bradycardia and tachycardia alter the systemic time interval between the approximate 2/3 filling time (diastole) to the 1/3 ejection time (systole). Both arrhythmias have a tendency to result in low cardiac index/outputs (hypodynamic). Consequently, low oxygen supply and demand results in the cell’s metabolic requirements not being met, which can lead to complications of shock/sepsis. The effects of sepsis in causing inadequate oxygen supply to the myofibrils are associated with a pronounced catabolic response in skeletal muscle, which mainly reflects degradation of the myofibrillar proteins, actin and myosin. Some studies suggest that sepsis-induced muscle proteolysis may reflect ubiquitin-proteasome-dependent protein breakdown, whereas conflicting observations suggest that the ubiquitin-proteasome pathway does not degrade intact myofibrils. Thus, it is possible that actin and myosin need to be released from the myofibrils before they can be ubiquitinated and degraded by the proteasome [16].
Of course, the effects of sustained pyrexia also indirectly affect myofibril metabolic synergism due to changes in pH and associated effects on the Krebs cycle, possibly involving respiratory acidosis or alkalosis; however, temperature does appear to affect the actions of actin and myosin in the sarcomeres of cardiac muscle [17].
Optimization of blood flow centers around assessing preload in respect to monitoring the pressures, initially focusing on the mean right atrial or CVPs. We still tend to maintain high CVPs during fluid resuscitation therapy.
Published studies have not produced conclusive results as to whether or not there are relationships between CVP and pulmonary artery occlusion (wedge) pressures with preload. However, for many reasons, the scope of this topic is too large to discuss here.
2.2. Study Design
Following institutional ethical approval, 45 adult patients undergoing cardiac surgery [3] necessitating placement of a pulmonary artery catheter for standard monitoring gave written informed consent to participate in this study. After routine induction of anesthesia and insertion of an arterial line into radial or femoral arteries, a triple lumen central venous catheter and an Edwards Laboratories™ (Santa Ana, CA, USA) Swan-Ganz catheter were inserted. All these invasive lines were branched off to a bespoke, dedicated HME LifePulse 900 monitor (commissioned by Medics Limited, Harlow, UK) loaded with the continuous cardiac dynamic monitoring empirical physiological formulae. The thermodilution pulmonary artery catheter was placed via the right internal jugular vein. Both monitors gave the same readings after calibration for HR, CVP and blood pressures with blood temperatures.
This was a blind study in which the perfusionist revealed the pump cardiac index/output results after the investigator had declared the HeartSmart® calculated cardiac index results. Hard copies of the pump and HeartSmart® hemodynamic values were kept with the research notes. Cardiac index values were then compared at the start of cardiopulmonary bypass, during rewarming, and at the end of cardiopulmonary bypass.
The physiological parameters of blood temperature, blood pressure and CVPs, along with the revolution rate of the rollers in the pump, are available from the pump and monitors. It is these parameters that are used in the continuous cardiac dynamic monitoring empirical physiological formulae software known as HeartSmart®. During bypass, the pump displays the number of revolutions, the temperature of the blood in ˚C, the right atrial pressure/ CVP, the mean arterial pressure and the flow rate equivalent to cardiac output/index delivered to the patient. The patient’s height and weight are known prior to surgery and, represented as body surface area in m2, are used to compute flow rates and to convert cardiac output to cardiac index and vice versa.
The rollers in the pump have a tendency to damage formed elements of the blood and cells through its action of haemolysis. This is where whole-body hypothermia comes into play. Whole-body hypothermia reduces the tissue oxygen requirements, which, in turn, allows for less blood flow and, ultimately, fewer revolutions in the pump rollers. Another effect of hypothermia is to reduce metabolic activity within the tissues. The empirical physiological formulae can deal with low and high blood temperatures, CVP and arterial pressure, and varying HR.
The empirical physiological formula for estimating cardiac index in the software is:
Ci = CVP·K·T/HR2
We replaced HR2 with the rate of revolutions of the roller pump (Rev2):
Ci = CVP·K·T/Rev2
The K empirical value per set of values is derived from the grid in Figure 1. The K values cover a wide range of CVP and HR bandwidths, and were validated in 1998 by the School of Mathematics at the University of Sheffield.
3. Results
A total of 32 adult patients were included for analysis in this part of the study, where flow rates from the pump delivered to the patient during corrective cardiac surgery were compared with estimated cardiac index values derived from HeartSmart®. Each subject had to have eight sets of paired measurements of each hemodynamic variable (HR/revolution rate of the pump rollers, CVP [mmHg], systolic/diastolic pressures and mean arterial pressure [mmHg], temperature of the blood [˚C]) against the pump flow rates, i.e. cardiac index in l/min/m compared with the estimated cardiac index in l/min/m derived from the continuous cardiac dynamic monitoring empirical physiological formulae). A total of 256 full, valid, paired sets of the pump absolute cardiac output flow rates were divided by the patient’s body surface area (m2) and converted to cardiac index flow rates for comparison. Patients were excluded (n = 13) if we could not take eight sets of measurements, if they had complications that meant they had to go back on bypass, or if there were difficulties in coming off bypass. The eight sets of measurements from the 32 included patients provided a total of 256 sets of paired measurements (Figure 2).
The range of cardiac index values was −0.86 l/min/m2 through to 1.05 l/min/m; the mean of the difference was 0.09 l/min/m2; the range of mean CVP was 0.1 mmHg through to 12 mmHg; core blood temperature ranged from 22.0˚C to 37.4˚C; the mean arterial blood pressure ranged from 33 to 100 mmHg; and the range of revolu-

Figure 2. Pairs of cardiac index (l/min/m2) delivery flow rates converted to cardiac index: heart-lung machine versus HeartSmart® software estimates, with line of equality. CI, cardiac index.
tion rates squared (substituting for HR2) was 54 to 133 revs/bpm (Figure 1). The range of errors between the methods, according to Critchley criteria [18], was approximately 17.6%.
The mean difference of the 256 sets of measurements was 585.5 l/min/m2 for the pump and 575.0 l/min/m2 for the empirical physiological formulae—a difference of 5% l/min/m2. The range of flow rates for the pump was 1.2 to 2.85 l/min/m2; for the empirical physiological formulae, the range was 1.2 to 3.0 l/min/m2.
We now analyze and compare these cardiac index estimations from the pump and empirical physiological formulae in greater detail.
A measurement cannot have closer agreement with another measurement than it does with itself, and it is useful to compare the limits of agreement with the repeatability coefficient, within which approximately 95% of differences between pairs of measurement by the same method will fall. In the present data, we have repeated measurements for both methods. The cardiac index does not change greatly over the period of measurement, so we can estimate the repeatability.
First, we check whether the differences between the pump and the empirical physiological formulae appear to be independent of the magnitude of the measurement. We do this by plotting difference against average of the two measurements (Figure 3). There appears to be a relationship between the difference and the average, such that the differences become more variable as the magnitude of cardiac index increases.
We can then try a logarithmic transformation of cardiac index (Figure 4). This appears much better, and so
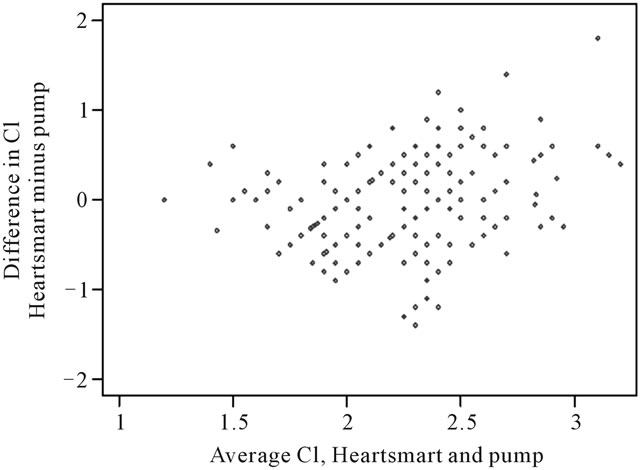
Figure 3. Differences in cardiac index measurements against average cardiac index measurement derived from the pump and the empirical physiological formulae of HeartSmart®. For differences between Cipump and CI HeartSmart®: Mean of differences = 0.09 l/min/m2 (n = 256); Standard deviation = 0.49 l/min/m2; Standard error = 0.03 l/min/m2 95% limits of agreement = –0.86 l/min/m2to 1.05 l/min/m2. CI, cardiac index.
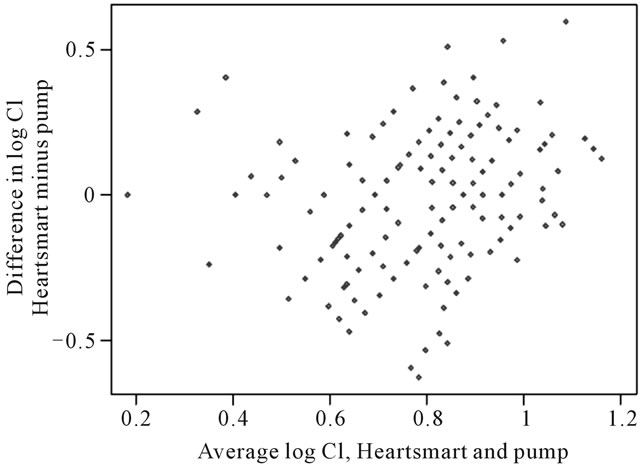
Figure 4. Logarithmic transformation of cardiac index. For differences between Cipump and CI HeartSmart®: for log pump cardiac index, the within-subject standard deviation was 0.1457 l/min/m2. The repeatability coefficient was 0.4038 l/min/m2 which has an antilog of 1.45 l/min/m2. For the empirical physiological formulae, the standard deviation of log cardiac index was 0.1870 l/min/m2. The repeatability coefficient was 0.5184 l/min/m2, with an antilog of 1.68 l/min/m2. For pairs of cardiac index observations adjacent in time, the pump cardiac index measurements had a standard deviation of 0.1318 l/min/m2 and a repeatability of 0.3653 l/min/m2, which has an antilog of 1.44 l/min/m2. For the empirical physiological formulae, the standard deviation was 0.1868 l/min/m2and the repeatability was 0.5179 l/min/m2, with an antilog of 1.68 l/min/m2. CI, cardiac index.
the logarithmic transformation will be used for the remaining calculations.
The estimated standard deviation of the differences was 0.2202 l/min/m2, and the mean difference was −0.0522 l/min/m2. As this mean difference is very close to zero, there is no evidence that there is a consistent bias between the empirical physiological formulae and the pump. The limits of agreement are −0.4837 to 0.3793 l/min/m2, and the range of antilogs of these limits is 0.62 l to 1.46 l/min/m2 (Figure 5). Hence, we estimate that for 95% of pairs of measurements, the empirical physiological formulae estimates will be between 62% and 146% of the pump measurement.
We now turn to estimating repeatability with the pump. For log pump cardiac index, the within-subject standard deviation was 0.1457 l/min/m2. The repeatability coefficient was 0.4038 l/min/m2, which has an antilog of 1.45 l/min/m2, so that for 95% of pairs of pump measurements, the larger measurement will be less than 145% of the smaller. This is very similar to the limits of agreement. In this sample of measurements from the empirical physiological formulae, the standard deviation of log cardiac index was 0.1870 l/min/m2 and the repeatability coefficient was 0.5184 l/min/m2, with an antilog of 1.68 l/min/m2. This is a little smaller than that found for the larger sample [18]. For pairs of cardiac index observa-
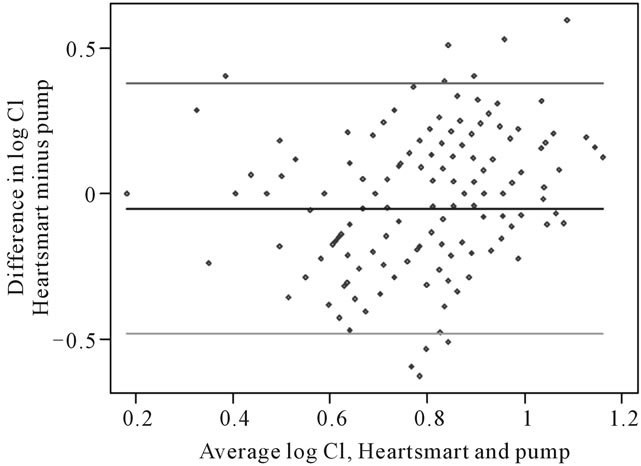
Figure 5. Logarithmic transformation of cardiac index showing estimated limits of agreement. For differences between Cipump and CI HeartSmart®: Mean of differences, −0.0522 l/min/m2 (n = 256); standard deviation, 0.2202 l/min/m; 95% limits of agreement, −0.4837 to 0.3793 l/min/m2; range of antilogs of these limits, 0.62 to 1.46 l/min/m2. CI, cardiac index.
tions adjacent in time, the pump cardiac index measurements showed a standard deviation of 0.1318 l/min/m2 and a repeatability of 0.3653 l/min/m2, which has an antilog of 1.44 l/min/m2. For the empirical physiological formulae, the standard deviation was 0.1868 l/min/m2 and the repeatability was 0.5179 l/min/m2, with an antilog of 1.68 l/min/m2.
Therefore, the numbers are almost the same for the adjacent pairs of observations and for the full sample of measurements on the same subject. The statistical analysis of the main study [3] was reported within the results of 2720 paired sets of cardiac index measurements [4], but did not include the paired sets of measurements from the current study.
4. Discussion
Our main result is that the cardiac index converted from the pump cardiac output rates is in good agreement with the cardiac index estimated by the empirical physiological formulae in HeartSmart® software. As far as we are aware, the continuous cardiac dynamic monitoring empirical physiological formulae in the HeartSmart® software represent the only bedside hemodynamic monitoring system that has been compared proactively in open heart surgery patients as they go on, undergo, and come off cardiopulmonary bypass.
We were able to record values simultaneously between the pump and the empirical physiological formulae throughout the time that the patient was on bypass, right through to the re-warming phase and coming off bypass. The cardiac index values from the pump and the empirical physiological formulae were consistently comparable throughout the time the patient was on the pump. The use of logarithmic transformation to provide a more reliable estimate of flow on the downward slope of the dye dilution method was developed by Hamilton (1939) in modifying the original Stewart dye dilution method (1897).
The main study used a well-validated method to compare these two measurement techniques [19,20]: the 95% limits of agreement analysis assesses how closely two methods of measurement of a variable agree, and the means of the differences are an estimate of the average bias of the pulmonary artery catheter thermodilution method relative to that of the continuous cardiac dynamic monitoring method. The results showed good correlation between the two groups of variables; data collected before, during and after cardio-pulmonary bypass showed that the 95% limits of agreement and the mean bias were statistically sufficiently close across the full range of cardiac indexes observed, thus suggesting that the empirical physiological formulae would be equally comparable to the pulmonary artery catheter thermodilution method at estimating cardiac index. The same statistical method was used to compare the pump flow rates to the HeartSmart® flow rates.
These results support the role of the new inverse square rule of the heart in regulating cardiac index [3] using the box grid [5] of CVP versus HR2/Revs2. Small changes within a stable band of CVP/HR2 will produce uniform increases or decreases in stroke volume index and cardiac index, provided that temperature remains constant.
The results from this study demonstrate the robust nature of the empirical formulae for deriving cardiac index at the bedside (Ci = CVP × K × T/HR2). Conceivably, the empirical physiological formulae in the software could be used in place of, or in conjunction with, the thermodilution catheter for the estimation of cardiac output in a number of different situations. We believe the discovery of the empirical physiological formulae is the most recent advance in hemodynamic monitoring during the past four decades: the insight provided by this new inverse square rule of the heart for regulating cardiac index will help to advance our understanding of blood flow through the heart, as first described by Harvey in 1625.
There are few limitations in this study, apart from the fact that the pulmonary artery catheter thermodilution method cannot be compared directly with the cardiopulmonary bypass pump for comparison with the pump and HeartSmart® results.
HeartSmart® allows for the introduction of early goaldirected therapy prior to major surgery for the group of patients at highest risk of death and complications [4], and may also be useful in helping to measure the achievement of physiological targets for “goal-directed therapy in early sepsis”, as recommended by Rivers et al. [21]. There are many potential economic and clinical benefits in implementing early goal-directed therapy in sepsis and septic shock patients [22]. This paper demonstrates that HeartSmart® could be used reliably and quickly to assess sepsis and shock patients when admitted into Accident & Emergency Departments, removing the obstacle of delays in commencing fluid resuscitation therapy as quickly as possible.
5. Acknowledgements
Medical writing and editing assistance in the preparation of parts of this paper was provided by Julie Smith.
We also thank Dr. John C Berridge, Consultant Anesthetist and Intensivist in the Department of Anaesthesia at the Leeds General Infirmary, for his advice and guidance.
6. Disclosure
Dr. Kenneth J. Warring-Davies is the inventor of CCDM HeartSmart® and has personally financed this invention. No financial contributions were made to any institution or person.
REFERENCES
- C. W. Stetz, R. G. Miller, G. E. Kelly and T. A. Raffin, “Reliability of the Thermodilution Method in the Determination of Cardiac Output in Clinical Practice,” American Review of Respiratory Disease, Vol. 126, No. 6, 1982, pp. 1001-1004.
- M. Hadian and M. R. Pinsky, “Evidence-Based Review of the Use of the Pulmonary Artery Catheter: Impact Data and Complications,” Critical Care, Vol. 10, Suppl. 3, 2006, p. S8. doi:10.1186/cc4834
- J. C. Berridge, K. Warring-Davies, J. M. Bland and A. C. Quinn, “A New, Minimally Invasive Technique for Measuring Cardiac Index: Clinical Comparison of Continuous Cardiac Dynamic Monitoring and Pulmonary Artery Catheter Methods,” Anaesthesia, Vol. 64, No. 9, 2009, pp. 961-967. doi:10.1111/j.1365-2044.2009.05943.x
- K. Warring-Davies and M. Bland, “HeartSmart® for Routine Optimization of Blood Flow and Facilitation of Early Goal-Directed Therapy,” Open Access Journal of Clinical Trials, Vol. 2, 2010, pp. 115-123. doi:10.2147/OAJCT.S9843
- J. C. Berridge, K. J. Warring-Davies and J. M. Bland, “Author Reply. Graphical Presentation of Data in Non-Invasive Algorithms for Cardiac Output Estimation,” Anaesthesia, Vol. 65, No. 3, 2010, pp. 310-311. doi:10.1111/j.1365-2044.2010.06256_1.x
- K. J. Warring-Davies and J. M. Bland, “Author Reply: Prediction and Theory in Cardiac Output Estimates,” Anaesthesia, Vol. 65, No. 7, 2010, pp. 752-753. doi:10.1111/j.1365-2044.2010.06395.x
- E. H. Starling, “The Linacre Lecture on the Law of the Heart,” Longmans, Green and Co., London, 1918.
- E. H. Starling, “On the Circulatory Changes Associated with Exercise,” Journal of the Royal Army Medical Corps, Vol. 34, 1920, pp. 258-272.
- C. A. Opitz, M. Kulke, M. C. Leake, C. Neagoe, H. Hinssen, R. J. Hajjar and W. A. Linke, “Damped Elastic Recoil of the Titin Spring in Myofibrils of Human Myocardium,” Proceedings of the National Academy of Sciences of the United States of America, Vol. 100, No. 22, 2003, pp. 12688-12693. doi:10.1073/pnas.2133733100
- W. A. Linke and J. M. Fernandez, “Cardiac Titin: Molecular Basis of Elasticity and Cellular Contribution to Elastic and Viscous Stiffness Components in Myocardium,” Journal of Muscle Research and Cell Motility, Vol. 23, No. 5-6, 2002, pp. 483-497. doi:10.1023/A:1023462507254
- H. Granzier and S. Labeit, “Cardiac Titin: An Adjustable Multi-Functional Spring,” Journal of Physiology, Vol. 541, Part 2, 2002, pp. 335-342. doi:10.1113/jphysiol.2001.014381
- H. Li, W. A. Linke, A. F. Oberhauser, M. CarrionVazquez, J. G. Kerkvliet, H. Lu, P. E. Marszalek and J. M. Fernandez, “Reverse Engineering of the Giant Muscle Protein Titin,” Nature, Vol. 418, No. 6901, 2002, pp. 998-1002. doi:10.1038/nature00938
- R. Horowits, “The Physiological Role of Titin in Striated Muscle,” Reviews of Physiology, Biochemistry & Pharmacology, Vol. 138, 1999, pp. 57-96. doi:10.1007/BF02346660
- M. Kulke, S. Fujita-Becker, E. Rostkova, C. Neagoe, D. Labeit, D. J. Manstein, M. Gautel and W. A. Linke, “Interaction between PEVK-Titin and Actin Filaments: Origin of a Viscous Force Component in Cardiac Myofibrils,” Circulation Research, Vol. 89, No. 10, 2001, pp. 874-881. doi:10.1161/hh2201.099453
- L. Tskhovrebova and J. Trinick, “Role of Titin in Vertebrate Striated Muscle,” Philosophical Transactions of the Royal Society B: Biological Sciences, Vol. 357, No. 1418, 2002, pp. 199-206. doi:10.1098/rstb.2001.1028
- A. B. Williams, G. M. Decourten-Myers, J. E. Fischer, G. Luo, X. Sun and P. O. Hasselgren, “Sepsis Stimulates Release of Myofilaments in Skeletal Muscle by a Calcium-Dependent Mechanism,” FASEB Journal, Vol. 13, No. 11, 1999, pp. 1435-1443.
- C. S. Churcott, C. D. Moyes, B. H. Bressler, K. M. Baldwin and G. F. Tibbits, “Temperature and pH Effects on Ca2+ Sensitivity of Cardiac Myofibrils: A Comparison of Trout with Mammals,” American Journal of Physiology, Vol. 267, No. 1, 1994, pp. R62-R70.
- L. A. Critchley and J. A. Critchley, “A Meta-Analysis of Studies Using Bias and Precision Statistics to Compare Cardiac Output Measurement Techniques,” Journal of Clinical Monitoring and Computing, Vol. 15, No. 2, 1999, pp. 85-91. doi:10.1023/A:1009982611386
- J. M. Bland and D. G. Altman, “Agreement between Methods of Measurement with Multiple Observations per Individual,” Journal of Biopharmaceutical Statistics, Vol. 17, No. 4, 2007, pp. 571-582. doi:10.1080/10543400701329422
- J. M. Bland and D. G. Altman, “Measuring Agreement in Method Comparison Studies,” Statistical Methods in Medical Research, Vol. 8, No. 2, 1999, pp. 135-160. doi:10.1191/096228099673819272
- E. Rivers, B. Nguyen, S. Havstad, J. Ressler, A. Muzzin, B. Knoblich, E. Peterson and M. Tomlanovich for the Early Goal-Directed Therapy Collaborative Group, “Early Goal-Directed Therapy in the Treatment of Severe Sepsis and Septic Shock,” New England Journal of Medicine, Vol. 345, No. 19, 2001, pp. 1368-1377. doi:10.1056/NEJMoa010307
- D. T. Huang, G. Clermont, T. T. Dremsizov, D. C. Angus for the ProCESS Investigators, “Implementation of Early Goal-Directed Therapy for Severe Sepsis and Septic Shock: A Decision Analysis,” Critical Care Medicine, Vol. 35, No. 9, 2007, pp. 2090-2100. doi:10.1097/01.CCM.0000281636.82971.92
NOTES
*Corresponding author.