Advances in Microbiology
Vol.05 No.03(2015), Article ID:54962,7 pages
10.4236/aim.2015.53018
Use of Affordable Materials to Improve Water Quality in Peri-Urban Settlements in Windhoek, Namibia
Pam Claassen1, Marius Hedimbi2*, Kayeuna Basson3
1Research and Publication Office, University of Namibia, Windhoek, Namibia
2Department of Microbiology, School of Medicine, University of Namibia, Windhoek, Namibia
3City of Windhoek, Scientific Services (Gammams Laboratory), Windhoek, Namibia
Email: *mhedimbi@unam.na *mhedimbi@yahoo.com
Copyright © 2015 by authors and Scientific Research Publishing Inc.
This work is licensed under the Creative Commons Attribution International License (CC BY).
http://creativecommons.org/licenses/by/4.0/


Received 23 February 2015; accepted 13 March 2015; published 24 March 2015
ABSTRACT
Water samples from Daan Viljoen dam, Avis dam and Goreangab dam were collected and filtered with burlap, cotton and polyester. The water samples were analyzed for the presence of total coliform, Escherichia coli, heterotrophic plate count (HPC), somatic coliphage, Clostridium perfringens, turbidity and conductivity. The bacteriological analysis was carried out by membrane filtration and pour plate techniques. The water from the three dams was found to contain high levels of microorganisms which indicated that it was not safe for human consumption. Turbidity was improved after filtration. Cotton filtered out the most microorganisms (p < 0.05) in all dams compared with the other two types of cloths.
Keywords:
Cloth Materials, Dams, Filtration, Windhoek, Water Quality

1. Introduction
About 80% of the Namibian population lives in rural areas where few employment opportunities exist, and as a result, they migrate to the capital, Windhoek, in search of better livelihood opportunities. The current growth rate of Windhoek’s urbanization is 5.4%, of which 3.9% is in-migration [1] . According to the annual report of City of Windhoek [2] , an estimated one third of migrants settle in informal areas, namely the north-western suburbs that developed from the Katutura Township. In addition, more than 70% of Windhoek’s population is already settled in this part of the capital [2] . These suburbs are predominately low-income. However, it is argued by the Shack Dwellers Federation (SDF) of Namibia, who conducted a survey on informal settlements in 2008, that those living there have been resident in the informal settlements for an average of 5.2 years, and in Windhoek itself for 12.4 years. Since the major reasons for migration to Windhoek is unemployment in rural areas, at least 43% of these informal settlers come and search for employment opportunities [1] [2] . Another reason given for migration is better living conditions, such as access to schools and health care. These informal settlers are predominantly economically active, with 72% being between the ages of 20 - 44 years old [1] [2] .
However, migrants to Windhoek have limited access to clean and safe water as they can’t afford the municipal fees for water, given the fact that they don’t have the skills needed for an urban setting, which hampers employment opportunities. These migrants often rely on natural source of water like rivers and dams around the capital for their water consumption. This water is usually not fit for human consumption in its natural form [1] [2] . With limited income and limited access to chemicals to treat their water before use, there is a need to find cheap and alternative methods to improve their water quality. It is observed that many people from these informal peri-urban settlements filter their fetched water with cloths in an effort to improve the water quality before drinking [1] [2] .
According to Massoud et al. [3] , poor communities globally have adopted simple and rudimentary means to purify visible impurities from drinking water, such as filtering water through cloth. Some of the water purification treatments observed include: water filtration utilizing a sieve and filtration using different cloths. These means of water purification are considered acceptable by some communities as it provides a certain degree of quality drinking water which reduces the incidence of harmful pathogens considerably, though not completely. The cloth method is the most commonly observed method, and this could be attributed that cloth is light, easily transported, and a relatively cheap means of purifying drinking water. The usage of cloth as purification filter is also reported by Vigneswaran and Sundaravadivel [4] , whereby impurities such as plant debris, insects, and dust particles are removed. Although these traditional methods remove visible impurities, they do not necessarily provide quality drinking water. Although particles are removed from water, it is imperative to establish what pathogens are present in the water, and how much of these are removed when using different cloths as purification [3] [4] .
This prompts this investigation to establish how much purification takes place when water is filtered through cloths. This study aims to evaluate the effectiveness of different filtering cloth materials in improving the quality of water. The water samples are obtained from 3 dams around Windhoek, capital of Namibia (Gorengab dam, Avis dam and Daan Viljoen dam). The quality of water is evaluated by determining the presence of microorganisms in the water after filtering with different types of cloths.
2. Materials and Methods
2.1. Study Site and Water Sampling
Water samples were collected from three different dams that were in the vicinity of City of Windhoek, Namibia: Daan Viljoen Dam, Goreangab Dam and the Avis Dam. The water samples were collected in duplicates in 1 liter sterile bottles. Samples were filtered with burlap, cotton or polyester cloths, respectively. Samples were then analyzed at Scientific Services (Gammams Laboratory), City of Windhoek. The water quality parameters tested were: somatic coliphage, heterotrophic plate count, Clostridium perfringens, total coliforms, Escherichia coli, turbidity, and conductivity.
2.2. Somatic Coliphage
100 mL sample was poured into a sterile container and 1 mL of sterile Calcium Chloride solution was added to the sample. Host culture, E. coli WG5 strain (5 mL) was added to the sample. Pre-warmed (46˚C - 48˚C) Phage Agar Concentration (PAC) was then poured carefully to the sample mixture and the bottle inverted to avoid bubbles forming. The mixture was then gently poured into 90 mm petri dishes and the medium was allowed to solidify and incubated overnight at 35˚C ± 2˚C. After incubation, clear, circular, plaques were counted.
2.3. Heterotrophic Plate Count
The petri dishes were marked with sample names and their dilutions. 1 mL of undiluted and specific dilutions was pipetted into the properly marked plates and kept closed to prevent contamination from the surrounding environments. Approximately 12 - 15 mL of freshly prepared growth media, Tryptone Glucose Extract Agar (TGEA) kept at a temperature of 46˚C - 48˚C in a water bath was poured into each plate and thoroughly mixed. The media was allowed to solidify at room temperature and inverted plates were incubated for 48 ± 2 hours at 35˚C ± 2˚C. All visible colonies on each plate were counted.
2.4. Clostridium perfringens
Perfringens Agar Base plates (65 mm) were prepared and labeled. The membrane filtration unit funnels and filter holders were sterilized using a Bunsen burner, and rinsed with sterile distilled water to cool the unit. The sterile membrane filters were inserted into filter holders and 100 mL of water for each sample was filtered. The filter membranes were aseptically removed by means of forceps and placed facing up on the agar plates. The inverted plates were then incubated at 35˚C ± 2˚C under anaerobic conditions for 48 ± 2 hours. The black colonies were counted as typical Clostridium perfringens colonies.
2.5. Total Coliforms
m-Endo Agar LES (65 mm plates) were prepared and labeled. The membrane filtration unit funnels and filter holder were sterilized using a Bunsen burner, and rinsed with reagent water to cool the unit. A sterile membrane filter was placed onto a filter disk and 100 mL of water for each sample was filtered. The filter membranes were aseptically removed by means of forceps and placed facing up on the agar plates. The inverted plates were then incubated at 35˚C ± 2˚C under aerobic conditions for 24 ± 2 hours and thereafter, the red metallic sheen colonies were counted.
2.6. Indole Test
Well isolated total coliform colonies were inoculated into Tryptone water using disposable inoculating loops. The tubes containing Tryptone water and the total coliform colonies were incubated at 44.5˚C± 1˚C for 24 ± 2 hours. After incubation, 5 drops of Kovacs’ reagent were added. The mixture was then gently swirled and allowed to stand for 10 minutes. Red color of amyl alcohol indicated the presence of E. coli.
2.7. Turbidity Test
Turbidity was carried out using a turbidity meter whereby the samples were poured into small transparent clean vials, which were then inserted into the turbidity meter and the results were displayed on the screen.
2.8. Data Analysis
Data were analyzed by ANOVA. Means were compared using post-hoc Scheffe multiple comparison test. Each test was based on four replicates per sample. Analysis was done at confidence interval (CI) = 95% and α = 0.05.
3. Results
Somatic coliphage was significantly lower (p < 0.05) in water filtered with cotton, burlap and polyester than unfiltered water in all dams except in Daan Viljoen where there was no significant difference (p > 0.05) between unfiltered and water filtered with burlap (Figure 1). All filtration systems significantly reduced (p < 0.05) the amount of somatic coliphage at Goreangab dam compared with unfiltered water. Furthermore, there was a significant reduction (p < 0.05) in the amount of somatic coliphage with the use of cotton and polyester at Daan Viljoen dam and Avis dam compared with burlap and unfiltered water (Figure 1).
Heterotrophic plate count (HPC) was significantly high (p < 0.05) in unfiltered water (695,000 cells/mL) from Goreangab dam compared to water from Daan Viljoen dam (257,750 cells/mL) and Avis dam (3975 cells/mL) (Figure 2). HPC was significantly lower (p < 0.05) in water filtered with polyester and cotton in Daan Viljoen and a reduction in HPC was also observed with all filtration system in Goreangab dam (Figure 2). Furthermore, there was no difference (p > 0.05) in HPC between filtered and unfiltered water in Avis dam (Figure 2).
Clostridium perfringens was significantly lower (p > 0.05) in water filtered with cotton and polyester and significantly high in unfiltered water from Goreangab dam compared to unfiltered water from Daan Viljoen dam
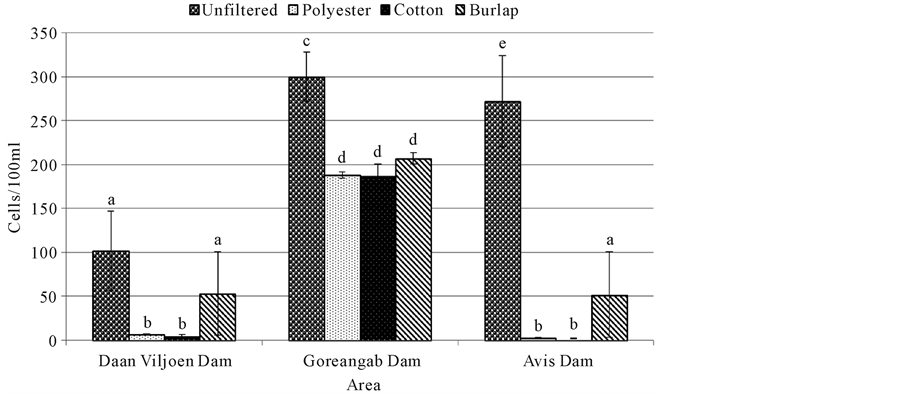
Figure 1. Somatic coliphage for water samples filtered with different cloths and unfiltered water. Means (±SE) of four replicates are presented. Means with the same letters were not significantly different from each other at p = 0.05.
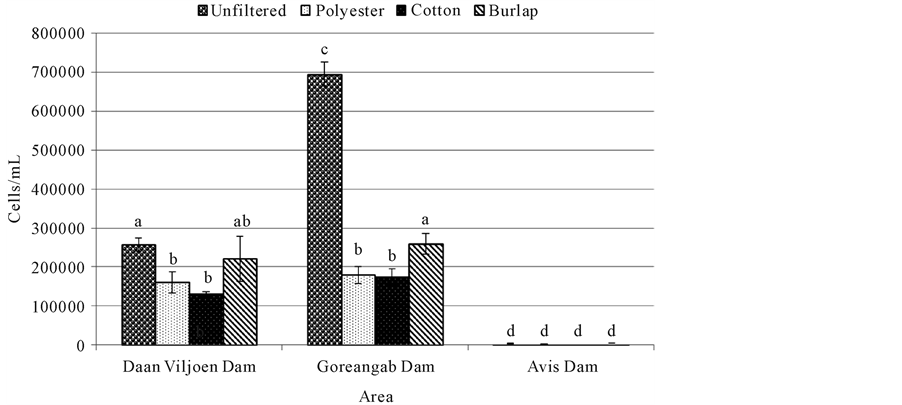
Figure 2. Heterotrophic plate count for water samples filtered with different cloths and unfiltered water. Means (±SE) of four replicates are presented. Means with the same letters were not significantly different from each other at p = 0.05.
and Avis dam (Figure 3). All filtration systems reduced Clostridium perfringens in all dams. No significant difference (p > 0.05) was observed between unfiltered water and water filtered with polyester, cotton, and burlap in Avis dam (Figure 3). There was also no significant difference (p > 0.05) between unfiltered water and water filtered with burlap in Goreangab dam (Figure 3).
Total coliforms were significantly high in unfiltered water from Goreangab dam (845,000 cells/mL) but a significant reduction was observed after filtration. There was a significant difference (p < 0.05) between unfiltered water and water filtered with cotton, polyester and burlap from Daan Viljoen dam (Figure 4). There was no significant difference (p > 0.05) between unfiltered water and the filtered water from Avis dam (Figure 4).
The presence of Escherichia coli was significantly lower (p < 0.05) in water filtered with polyester, cotton and burlap compared to unfiltered water from Daan Viljoen dam but were the same (p > 0.05) in unfiltered and filtered water from Avis dam (Figure 5). There was initially a high number of E. coli in unfiltered water from Goreangab dam but significantly lower after filtration with cotton, polyester and burlap (Figure 5).
Turbidity was significantly high in unfiltered water from Daan Viljoen dam (228.5 NTU) and Goreangab dam
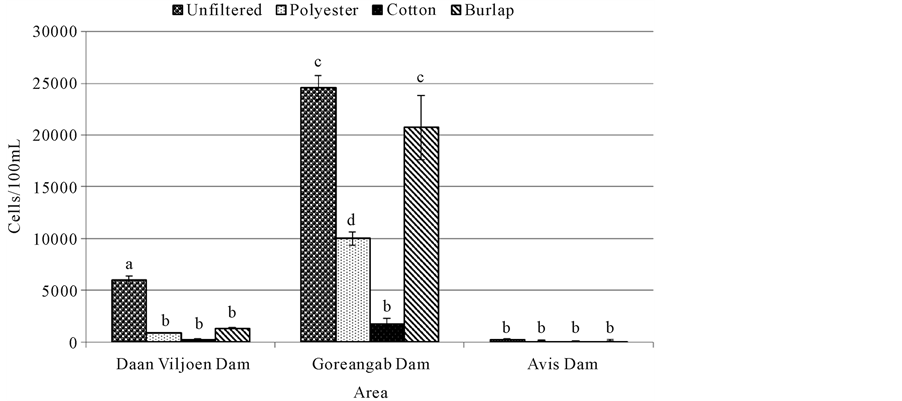
Figure 3. Clostridium perfringens for water samples filtered with different cloths and unfiltered water. Means (±SE) of four replicates are presented. Means with the same letters were not significantly different from each other at p = 0.05.
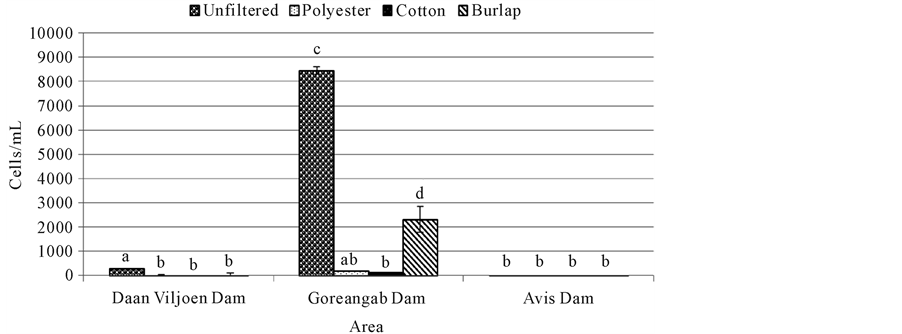
Figure 4. Total coliform for water samples filtered with different cloths and unfiltered water. Means (±SE) of four replicates are presented. Means with the same letters were not significantly different from each other at p = 0.05.
(200 NTU) but significantly lower (p < 0.05) after filtration with cotton, polyester, and burlap. It was observed that there was no significant difference between unfiltered water (200 NTU) and water filtered with burlap (131 NTU) from Goreagab dam (Figure 6). There was also no significant difference (p > 0.05) in turbidity between unfiltered water and water filtered with burlap, polyester and cotton in Avis dam (Figure 6).
4. Discussion
Somatic coliphages were high in all unfiltered water samples of all three dams (Figure 1). Avis dam had the most coliphages followed by Goreangab dam then Daan Viljoen dam. This showed that there were a high number of somatic coliphages which appeared to be present whenever total and fecal coliforms were found in high numbers. Filtration of the water samples reduced the number of the coliphages with cotton being the most effective and burlap being the least effective. There were also a high number of the total viable bacteria ((Heterotrophic plate count (HPC)) in all water samples of unfiltered water from Daan Viljoen dam and Goreangab dam with Goreangab dam being the highest (Figure 2). There was a slight decrease of viable bacteria when the water samples from Daan Viljoen dam were filtered with burlap, but decreased more when filtered with polyester and cotton. There was a decrease in the population of viable bacteria in Gorengab dam water after filtration. There
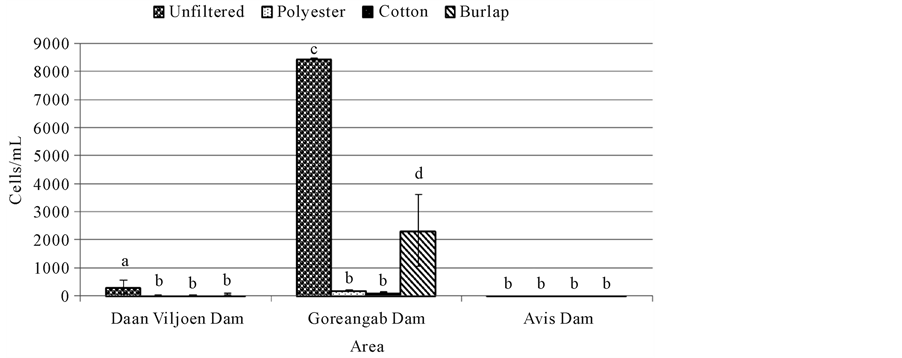
Figure 5. Presence of E. coli in water samples filtered with different cloths and unfiltered water. Means (±SE) of four replicates are presented. Means with the same letters were not significantly different from each other at p = 0.05.
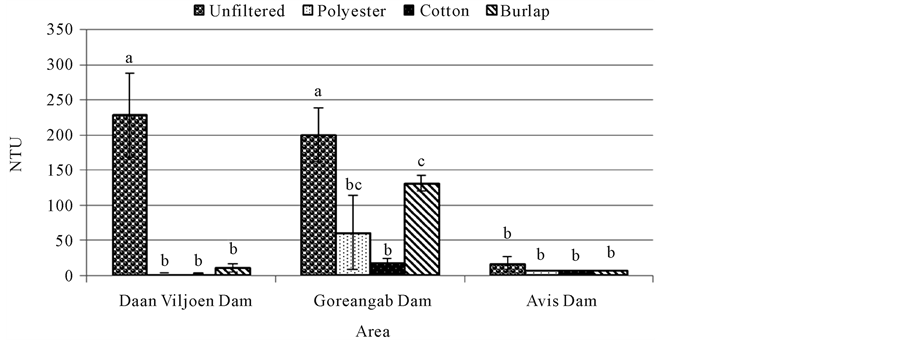
Figure 6. Turbidity for water samples filtered with different cloths and unfiltered water. Means (±SE) of four replicates are presented. Means with the same letters were not significantly different from each other at p = 0.05.
was little to no difference in HPC between unfiltered water and filtered water from Avis dam (Figure 2).
High number of viable count obtained with HPC test does not necessarily mean the water is unusable. Microorganisms recovered through HPC tests generally include those that are part of the natural (typically non-ha- zardous) microbial flora found in water. Some of the HPC bacteria found in drinking water can cause problems such as skin and wound infections. HPCs are used as good indicators of the overall quality of water [5] [6] . According to Bartram et al. [7] , a high HPC concentration does not itself present a risk to human health; however, some members of HPC population are suspected opportunistic pathogens for immune-compromised individuals [8] .
The number of Clostridium perfringens was the highest in Goreangab dam followed by Daan Viljoen dam and least in Avis dam water. After filtration of water from Daan Viljoen dam, there was a significant decrease in the number of C. perfringens compared to the amounts found in the unfiltered water (Figure 3). The amount of C. perfringens found in unfiltered water from Goreangab dam was the same as that filtered wit burlap but results showed a decrease in C. perfringens when filtered with cotton and polyester. There was no significant difference between the unfiltered water of Avis dam and that filtered with all three cloths (Figure 3).
The amount of total coliforms was very high in unfiltered water from Gorengab dam water compared to Daan Viljoen dam and Avis dam (Figure 4). The amount of total coliforms from Goreangab dam decreased after filtration, with cotton being the most effective. Total coliforms from the water of Daan Viljoen dam were high in unfiltered water and significantly lowered after filtration and the amount of total coliforms was significantly the same after filtration with cotton, burlap and polyester. There was little to no difference in the amount of total coliforms that were present in unfiltered water and that filtered from Avis dam (Figure 4). The high number of total coliforms in Goreangab dam compared to other dams was probably due to the fact that Goreangab dam was used to store treated water that was reclaimed from households. Coliforms are normal inhabitants of digestive tracts of animals, including human, and are found in their wastes, besides soil material [9] . The presence of fecal coliform in water may indicate recent contamination of the groundwater by human sewage or animal droppings which could contain other bacteria, viruses, or diseases causing organisms [9] . This is why coliform bacteria are considered as “indicator organisms”; their presence in water supply system indicates the potential presence of disease causing organisms. Ineffectiveness or malfunctioning of the treatment process employed could also result in the presence of coliform bacteria in the samples of water [10] . Therefore, results of this study indicate that cotton and polyester can potentially be used to reduce the number of total coliforms in water and thereby help reduce water-borne infections.
The amounts of E. coli were high in unfiltered water from Goreangab dam followed by Daan Viljoen dam. The presence of E. coli in water from Avis dam was very low in both unfiltered and filtered water and was significantly lowered after filtration in Daan Viljoen dam as well as in Goreangab dam water except that the water filtered with burlap contained more E. coli than that filtered with cotton and polyester (Figure 5). The classified indicator for water analysis is E. coli and its presence suggests the presence of other enteric pathogens [11] . E. coli are specific indicators of fecal pollution and the presence of E. coli is regarded as the most appropriate group of coliforms to indicate fecal pollution from warm-blooded animals [12] and are commonly used to express microbiological quality of water and as a parameter to estimate disease risk [13] . The presence E. coli indicates contamination of water with fecal matter. This indicates that it may also contain various harmful, disease-causing organisms such as bacteria, viruses, and parasites. Drinking water contaminated with these organisms can cause stomach and intestinal illness including diarrhea and nausea, and even lead to death. These effects may be more severe and possibly life threatening for babies, children, the elderly or people with immune deficiencies or other illnesses [10] .
Highest turbidity was observed in unfiltered water in Daan Viljoen dam and Goreangab dam and was reduced in all water samples after filtration. Turbidity decreased most when the water samples were filtered with burlap, followed by polyester (Figure 6). The results showed that turbidity was really low in all three dams after filtration with cotton. Turbidity may be created from a wide variety of eroded materials, including clay, silt, or mineral particles from soils or from natural organic matter created by the decay of vegetation and can allow pathogens to “hide”. High turbidity events usually occur in smaller water points that receive water from agricultural watershed or urban drainage area. Larger water points also experience high turbidity as a result of water quality changes during annual thermal changes, and may experience high turbidity events associated with severe flooding. The ability of a material to reduce turbidity means the general appearance of water is improved and might therefore be more acceptable for consumption.
5. Conclusion
Cotton filters out the most microorganisms in all dams compared with the other two types of cloths. However, filtration with any type of cloth does not remove all microorganisms and water still has to be treated to ensure that it is completely safe for human consumption. Therefore, while these materials can be used as first aid in water purification, there is still a strong need to widen the provision of clean water to all parts of the country.
Acknowledgements
The authors are thankful to Scientific Services (Gammams Laboratory), City of Windhoek, for carrying out microbiological analysis.
Conflict of Interests
The authors report no conflict of interests.
References
- (2013) Monthly Newsletter, City of Windhoek, June 2013. John Meinert Publishers, Windhoek.
- (2012) Annual Report, City of Windhoek. John Meinert Publishers, Windhoek.
- Massoud, M.A., Tarhini, A. and Nasr, J.A. (2009) Decentralized Approaches to Wastewater Treatment and Management: Applicability in Developing Countries. Journal of Environmental Management, 90, 652-659. http://dx.doi.org/10.1016/j.jenvman.2008.07.001
- Vigneswaran, S. and Sundaravadivel, M. (2004) Recycle and Reuse of Domestic Wastewater. Wastewater Recycle, Reuse, and Reclamation. Encyclopedia of Life Support Systems (EOLSS) (Developed under the Auspices of the UNESCO), Eolss Publishers, Oxford. http://www.eolss.net
- Ferreira, A.-C., Morais, P.V. and Costa, M.S.D. (1994) Alterations in Total Bacteria, Iodonitrophenyltetrazolium (INT)- Positive Bacteria, and Heterotrophic Plate Counts of Bottled Mineral Water. Canadian Journal of Microbiology, 40, 72-77. http://dx.doi.org/10.1139/m94-012
- Obiri-Danso, K.A., Okore-Hanson, A. and Jones, K. (2003) The Microbiological Quality of Drinking Water Sold on the Streets in Kumasi, Ghana. Letters in Applied Microbiology, 37, 34-339. http://dx.doi.org/10.1046/j.1472-765X.2003.01403.x
- Bartram, J., Cotruvo, J., Exne, M., Fricker, C. and Glasmacher, A. (2004) Heterotrophic Plate Count Measurement in Drinking Water Safety Management: Report of an Expert Meeting Geneva, 24-25 April 2002. International Journal of Food Microbiology, 92, 241-247.
- Pavlov, D., de Wet, C.M.E., Grabow, W.O.K. and Ehlers, M.M. (2004) Potentially Pathogenic Features of Heterotrophic Plate Count Bacteria Isolated from Treated and Untreated Drinking Water. International Journal of Food Microbiology, 92, 275-287. http://dx.doi.org/10.1016/j.ijfoodmicro.2003.08.018
- Singh, J.M., Somashekar, R.K., Prakash, K.L. and Shivanna, K. (2009) Bacteriological Assessment of Groundwater in Arkavathi and Vrishabhavathi Basins, Bangalore, Karnataka. Journal of Ecology and the Natural Environment, 1, 156-159.
- Edberg, S.C. (1996) Assessing Health Risks in Drinking Water from Naturally Occurring Microbes. Journal of Environmental Health, 58, 18-24.
- Nwadiaro, C.S., Oranusi, N.A. and Umeham, S.N. (1982) Preliminary Survey of Drinking Water Quality of Some Areas in Imo and Rivers States in Nigeria. Proceedings of 3rd National Conference on Water Pollution, The Petroleum Inspectorate, NNPC and Federal Ministry of Works, Port Harcourt, December 1982, 40-49.
- Ashbolt, N.J. Grabow, W.O.K. and Snozzi, M. (2001) Indicators of Microbial Water Quality. In: Fewtrell, L., Bartram, J., Eds., Water Quality: Guidelines, Standards and Health Risk Assessment and Management for Water-Related Infectious Disease (Chapter 13). IWA Publishing, London, 289-315.
- Admassu, M., Wubshet, M. and Gelaw, B. (2004) A Survey of Bacteriological Quality of Drinking Water in North Gondar, Ethiopia. Ethiopian Journal of Health Development, 18, 112-115.
NOTES

*Corresponding author.