CellBio
Vol.2 No.2(2013), Article ID:32646,10 pages DOI:10.4236/cellbio.2013.22007
The Cell Sorting Process of Xenopus Gastrula Cells Progresses in a Stepwise Fashion Involving Concentrification and Polarization
Faculty of Life and Environmental Science, Department of Biological Science, Shimane University, Shimane, Japan
Email: *ihara@life.shimane-u.ac.jp
Copyright © 2013 Ayano Harata et al. This is an open access article distributed under the Creative Commons Attribution License, which permits unrestricted use, distribution, and reproduction in any medium, provided the original work is properly cited.
Received February 16, 2013; revised March 18, 2013; accepted April 2, 2013
Keywords: Cell Sorting; Xenopus laevis; Concentrification; Polarization; Embryogenesis
ABSTRACT
Animal pole cells (AC) and vegetal pole cells (VC) dissociated from early Xenopus gastrulae were intermingled, and the cell sorting process occurring within the aggregate was analyzed. The overall process of cell sorting was found to morphologically consist of two steps, “concentrification” and “polarization”, as designated here. First, AC and VC clusters emerged at random positions in the aggregate, and the individual clusters gradually assembled themselves by 5 hours in culture (5 hC), forming a concentric arrangement, in which the AC cluster was enveloped by the VC cluster. This concentrification step is essentially consistent with the descriptions in earlier studies. As the next step, the AC and VC clusters moved up and down from 7.5 to 12 hC, resulting in the vertical polarization, namely, a serial array just like in vivo. Immunohistochemical analyses showed that AC expressed both Cand E-cadherins, while VC only expressed C-cadherin, as in vivo, suggesting the normal participation of cadherin system. On the other hand, the actin localization showed that the actin bundles accumulated at the edge of the AC cluster until the concentrification was completed, and gradually decreased during the polarization step. Another important finding was that AC cluster could generate cartilage tissues during the long-term (7 days) culture, evidence for a healthy inductive interaction between the AC and VC. Taken together, the present experimental system allows the AC and VC to be viable and grow into an embryo-like organization.
1. Introduction
Upon dissociation, metazoan cells exert an intrinsic potential of sorting out by themselves. It has been repeatedly studied to date as a model to elucidate the principle of morphogenesis. For example, dissociated Hydra cells reassemble and restore the normal whole body [1,2]. Similarly, dissociated chick limb bud cells sort out [3] and form a proximodistal axis [4,5].
In amphibian early embryos, it is also widely known that dissociated cells derived from different germ layers first unite indiscriminately and reconstruct normal tissue structures under relatively simple culture conditions [6]. Although it has been clarified that cadherins as cell adhesion molecules play an essential role in cell sorting the in Xenopus laevis embryo [7,8], the dynamic aspect of the entire process of cell sorting is still poorly understood. We have now focused on observing in detail the behaveiors of individual germ layer cells when animal cells (AC) and vegetal cells (VC) obtained from early gastrula were intermingled. The two-cell stage embyos were microinjected with dextran rhodamine, if necessary for the precise identification of the cell sources. In Xenopus laevis, the regional identity starts to be created before midbrastula and the sorting behavior becomes conspicuously progressive as the development advances [9,10]. On the other hand, the germ layer specification is not very advanced at the early gastrula stage [11,12]. Therefore, we decided to use the gastrula stage, considering it fit for analysis.
In this paper, we have focused on the following two kinds of macromolecules: 1) C-cadherin and E-cadherin, both of which are major forms of Xenopus cell adhesion molecules at the embryonic stage [13-16], and 2) the cortex actin, cytoskeleton protein known to cooperate with cadherin during the regulation of the cell shape and cell motility [17]. Our objective was to examine how these macromolecules are expressed within the aggregates in the present in vitro system. We found that the dissociated AC and VC reassembled and concentrically arranged, and subsequently, the two clusters were mutually polarized up and down. Thus our results clearly showed that the cell sorting process of AC and VC could be divided into two steps. Furthermore, the AC cluster in the polarized aggregate differentiated into mesodermal tissues thereafter, implying that the present culture system starting from cell sorting allowed the so-called “Nieuwkoop’s mesodermal induction” [18,19] between AC and VC. The expression patterns of the Cand Ecadherins were consistent with those in vivo, in terms of the specificity of expressing germ layers. The actin bundles localized at the edge of the AC cluster were reduced during cell sorting process. These findings suggest that the present aggregate culture system is useful for analyzing the germ layer interactions.
2. Materials and Methods
2.1. Animals and Emblyos
Sexually mature Xenopus laevis colonies were purchased from Sato Yosyoku (Chiba, Japan) and embryos were obtained by artificial fertilization. Oocytes were stripped from females injected 10 hours earlier with 800 units of human chorionic gonadotrophin (Gonatropin, Asuka Pharmaceutical Co., Tokyo, Japan), and fertilized with minced testis in De Boer’s solution (110 mM NaCl, 1.3 mM KCl, 0.45 mM CaCl2, 3 mM HEPES, pH 7.3 at 23˚C). The embryos were maintained in 10% Steinberg’s solution at 23˚C (1× Steinberg’s solution; 58 mM NaCl, 0.67 mM KCl, 0.34 mM Ca(NO3)2·4H2O, 0.83 mM MgSO4·7H2O, 10 mM HEPES, pH 7.3 at 23˚C). The development stage was determined according to Nieuwkoop and Faber [20].
2.2. Cell Preparation and Cell Sorting Culture
At stage 10 (the early stage of gastrulation), the animal caps were collected from five dejellied and devitellined embryos using an eyebrow knife and tungsten needle. Likewise, parts of the vegetal hemisphere were carefully collected to be free of not only the animal caps but also the marginal zones. They were individually transferred into Ca2+- and Mg2+-free Modified Barth Saline (CMFMBS: 88 mM NaCl, 1 mM KCl, 5 mM HEPES, 2.5 mM NaHCO3, pH 7.8 at 23˚C) containing 50 μg/ml gentamicin statically for one hour. The outer layer of the animal cap was discarded because it was difficult to dissociate, and only the inner layer was dissociated by gentle pipetting. AC (animal cells) were mixed with an equal volume of VC (vegetal cells), then transferred to an agar-coated 4-well Nunc dish (Thermo Fisher Scientific, Roskilde, Denmark) filled with Ca2+, Mg2+-containing MBS. The mixtures were rotated at 70 rpm and 23˚C for one hour, and then they were subjected to a stationary culture at 23˚C. Aggregates were incubated for 2.5, 5, 7.5, 12, 24, 48, 72, 96, 120 and 148 h, observed by a streomicroscope, and fixed with MEMFA [21,22]. For the long culture, culture media were refreshed every 12 hours. They were dehydrated through an ethanol series and embedded in paraffin wax (Shandon Histoplast, Thermo Scientific, Cheshire, UK).
2.3. Cell Tracking by Dextran Rhodamine Labeling
At the two-cell stage, dejellied embryos were transferred into 4% Ficoll in 10% Steinberg’s solution, and both blastomeres of them were injected with a total volume of 20nl containing 1% Dextran rhodamine (DR, D3312, Molecular Plobes, Eugene, USA) at their animal pole side. At different times in culture, the aggregates consisting of the DR-labeled and unlabeled cells were fixed with 4% paraformaldehyde (PFA) in amphibian CMFPBS (6.4 g NaCl, 0.2 g KCl, 2.9 g NaHPO3·12H2O, 0.2 g KH2PO4, and 200 ml water), then embedded in paraffin, and sectioned into 4 μm slices. The slices were deparaffinized, mounted using Fluoromount (Diagnostic Biosystems, Pleasantom, USA), and observed with a fluorescent microscope (OLYMPUS BX50, Tokyo, Japan). The nuclei had been stained with DAPI (4, 6-diamidino-2-phenylindole dihydrochloride, 0.5μg/ml).
2.4. Histological Examination
The paraffin sections were deparaffinized and stained with Alcian blue.
2.5. Immunohistochemistry
The paraffin sections were deparaffinized, rinsed with CMF-PBS, blocked with 1% normal horse serum in CMF-PBS for 20 minutes at room temperature, incubated with the primary antibody overnight at 4˚C, then extensively washed with CMF-PBS. The secondary antibody was then added and incubation was carried out for 2 hours at room temperature. The samples were stained for nuclei with DAPI, mounted using Fluoromount, and observed by fluorescent microscope. The following primary antibodies were used: the anti-E-cadherin monoclonal antibody (supernatant 5D3, Developmental Study Hybridoma Bank, Iowa, USA, 1/3 dilution), anti-Ccadherin monoclonal antibody (supernatant 6B6, Developmental Study Hybridoma Bank, 1/2 dilution), and anti-actin monoclonal antibody (MAB1501, Millipore, Billerica. USA, 1:100 dilution). An Alexa 488 conjugated goat anti mouse IgG2b (A21141; Molecular Probes, Eugene, USA, 1:500 dilution) and an Alexa 594 conjugated goat anti mouse IgG1 (A21125; Molecular Probes, Eugene, USA, 1:1000 dilution) were used as the secondary antibodies. The fluorescence intensities specific to the actin filament at the edge of the AC clusters were determined using the software Image J (National Institutes of Health, USA).
2.6. Western Blot Analysis
Xenopus embryos at stages 10.5, 12.5, 15, 19, and 21 and aggregates were lysed in extraction buffer (1 × CMFPBS, 1% triton X-100, 20 units/ml aprotinin, 1 mM EDTA (pH 8.0)) containing 1 mM diisopropyl fluorophosphates. The samples were quantified by the BCA protein assay kit (Thermo Fisher Scientific, Illiois, USA). They were combined with an equal amount of Leammli’s 2× sample buffer containing 5% 2-mercaptoethanol, boiled for 2 minutes at 90˚C, and separated in 8% SDSPAGE gel by running for 60 minutes at 60 mA. Gels were transferred to an immobilon-P membrane (Millipore, Billerica, USA) using a semidry apparatus (Nihon Eido Co., Ltd., Tokyo, Japan) for 3 hours at 100 mA. All membranes were blocked with 1% NHS in PBT for 40 minutes at room temperature, and incubated with the primary antibody overnight at 4˚C. The following primary antibodies were used: anti-E-cadherin mAb (supernatant 5D3, Developmental Study Hybridoma Bank, Iowa, 1/10 dilution), anti C-cadherin mAb (supernatant 6B6, Developmental Study Hybridoma Bank, Iowa, 1/10 dilution), and anti β-tubulin mAb (T4026; Sigma, St. Louis, USA, 1:1000 dilution). The HRP-conjugated mouse immunoglobulin (Dako, Glostrup, Denmark, 1:3000 dilution) was used as the secondary antibody for 2 hours at room temperature. The membranes conjugated with HRP were detected by DAB solutions (3 mg of 3-3’ diaminobezidine (Dojindo Laboratories, Kumamoto, Japan), 10 ml of 50 mM TrisHCl (pH 7.6), and 8 μl of 30% H2O2). The intensity of bands was quantitatively estimated by image J (National Institutes of Health, USA).
2.7. The Three-Dimensional Analysis of Aggregate
The thick paraffin sections (20 μm) were reacted with the anti-actin antibody, followed by incubation with Alexa 488 conjugated goat anti-mouse IgG1 (A21121; Molecular Probes, 1:500 dilution). The samples were observed using a Leica TCS SP5 conforcal microscope (Leica Microsystem, Wetzlar, Germany) equipped with immersion lens. All images were taken with the size of 1024 × 1024 pixels, and individual 1.5 μm optical slices were assembled into stacks. Some of them ware axially tilted in the X and Y directions.
3. Results
3.1. Change in Spatial Arrangement Decision of Dissociated Embryonic Cells during Cell Sorting Culture
The phenomenon called “sorting out of cells”, including those found in the pioneering studies by Townes and Holtfreter [6], have many intriguing issues to explore. We focused on the behaviors of dissociated embryonic cells during reaggregation in which AC and VC isolated from early Xenopus gastrulae had been intermingled.
To clarify whether or how the dissociated cells move to their own positions in the present aggregate culture system, we visualized the process of cell sorting using dextran rhodamine labeled cells (Figure 1). In control experiments with the mixture of labeled AC and unlabeled AC (Figures 1 (A)-(C)) and vice versa (Figures 1(D)-(F)), the cell arrangement of both the AC and VC aggregates remained at random, confirming that the labeling of cells had no effect on the sorting out, and the
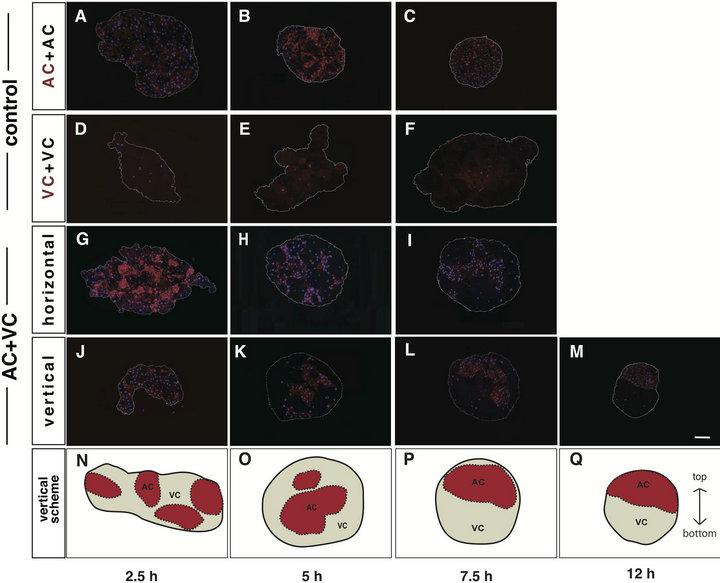
Figure 1. Overall cell rearrangement during cell sorting culture. Labeling with dextran rhodamine (DR) was performed at 2 cell stage. Reaggregatios were observed with a fluorescence microscope at 2.5 h ((A), (D), (G), (J)), 5 h ((B), (E), (H), (K)), 7.5 h ((C), (F), (I), (L)) and 12 h (M) after beginning of the stationary culture. Nuclei were counterstained with DAPI (blue). DR-labeled cells (DR(+), red) were discriminated from unlabeled cells (DR(-), dark). Control aggregates, DR(+)AC+DR(-)AC ((A)-(C)) and DR (+)VC+DR(-)VC(D-F), maintained random arrangement. On the other hand, the AC cluster of DR(+)AC+DR(-)VC aggregates became located at the center, enveloped by VC cluster, in horizontal sections ((G)-(I)), while the two clusters gradually rearranged up and down in vertical sections (J-M). White dotted line: the contour of the aggregate. Scale bar: 100 μm. The schemes of the rearrangement of clusters in vertical sections are shown ((N)-(P)). Red areas: AC clusters. White areas: VC clusters. Black dotted lines: boundaries between AC and VC clusters. Black solid line: the contour of the aggregate.
two kinds of cells could individually recognize themselves. The shape of the AC aggregates became nearly spherical with time (Figures 1 (A)-(C)), whereas the VC aggregates remained flat and rugged (Figures 1(D)-(F)). A temporal and spatial evaluation of the cell arrangement within the AC+VC aggregate was made by preparing the horizontal (Figures 1(G)-(I)) and vertical (Figures 1(J)-(M)) sections against the area facing the agar at different times during the stationary culture. Each of the AC and VC formed clusters and was arranged at random (Figure 1(G)) for the first 2.5 hours in culture (2.5 hC)
and gradually self-assembled into large clusters, then they concentrically arranged, that is, the AC cluster was enveloped by the VC cluster (Figures 1(G) and (I)). This concentrification of clusters suggested that cell sorting progressed. Interestingly, as shown in the vertical sections, the AC and VC clusters started to be rearranged relatively up and down from about 7.5 hC (Figures 1(J) and (L)), and such rearrangement was completed by 12 hC (Figure 1(M)). These data suggest that the overall cell sorting process of the AC and VC is temporally divided into two steps, i.e., concentrification and polarization, both of which are the original terms that we propose in this study. As the borders between AC and VC clusters in the actual fluorescence-stained sections are not necessarily discriminative, the schematic drawing of the vertical sectional views is shown in Figures 1(N)-(Q).
3.2. The Expression Patterns of Cadherin within the Aggregates
The expression of the cell-cell adhesion molecule, cadherin, during the present in vitro culture was immunohistochemically examined (Figure 2). A maternal cadherin, C-cadherin, is known to be ubiquitously expressed in during the early development of Xenopus laevis [14, 15], and zygotic cadherin, E-cadherin, is activated in only the ectoderm from the gastrula stage [13]. In this study, C-cadherin showed a punctate distribution at the adjacent AC plasma membrane and E-cadherin was also weakly expressed there at 2.5 hC (Figure 2(A)). Both cadherins were concentrated similar to a line drawing along the AC plasma membrane after 5hC and particularly elevated from 7.5 hC to 12 hC (Figures 2(B)-(D)). Endoderm-derived VC always expressed C-cadherin very weakly as in vivo. The boundaries between the two clusters are illustrated in Figure 2 (bottom panels). Next, we quantitatively assessed both cadherins in the aggregate by a western blot assay (Figure 3). The cadherin levels in the entire aggregate were sequentially compared, because it was difficult to separately analyze the AC and VC clusters. As a result, both the C- (Figures 3(a) and (b)) and E-cadherins (Figures 3(c) and (d)) showed almost a unidirectional increase during the test period. In-

Figure 2. The spatial patterns of expression of C-cadherin and E-cadherin during cell sorting culture. Aggregates were double stained (upper, C-cadherin, red; middle, E-cadherin, green) at 2.5 h (A), 5 h (B), 7.5 h (C) and 12 h (D) after beginning stationary culture. The arrangements of AC and VC clusters in the same fields are illustrated (bottom). Both cadherins were positive in AC, while C-cadherin was faint in VC. At 2.5 h, C-cadherin displayed a punctate pattern and E-cadherin also weakly appeared (A). At and after 5 h (especially in 12 h), both cadherins increased as a continuous line along cell membrane ((B), (C), (D)). Nuclei were stained with DAPI (blue). Dotted lines: the boundaries between AC and VC clusters. Solid line: the contour of the aggregate. Scale bar: 50 μm.
deed, this tendency of upregulation might explain the fact that the aggregates became more spherical with time. The persistence and up-regulation of cadherin further suggested that the expression of cadherin was also essential for maintaining the morphology of the aggregates during the polarization step, as will be described in Discussion.
3.3. The Expression of Actin Filaments in the Surface of Clusters
The process of sorting out is generally thought to result in an architecture with some concentric arrangements composed of different cell elements, as shown by the preceding theoretical studies (for example, [23]). On the contrary, the concentric arrangement of the AC and VC clusters was shifted to a polarized one during the later stage of the present stationary culture. How did the individual cells behave so that the clusters relocated? From the midblastula to neurula stages, Xenopus laevis embryos should be devoted to the germ layer specification progress, namely, a series of cooperative morphogenetic events involving such as convergent extension, invagination, cell migration, etc. [11,24]. Therefore, it is very likely that the AC and/or VC obtained from the gastrula stage may exert some active cell motility during the polarized rearrangement. Based on this presumption, we tried to verify the possibility that the production of lamellipodia from the AC and their polarity might be accompanied by rearrangement of the clusters (Figure 4). The expression of actin was positive in the AC mem-
 (a)
(a) (b)
(b)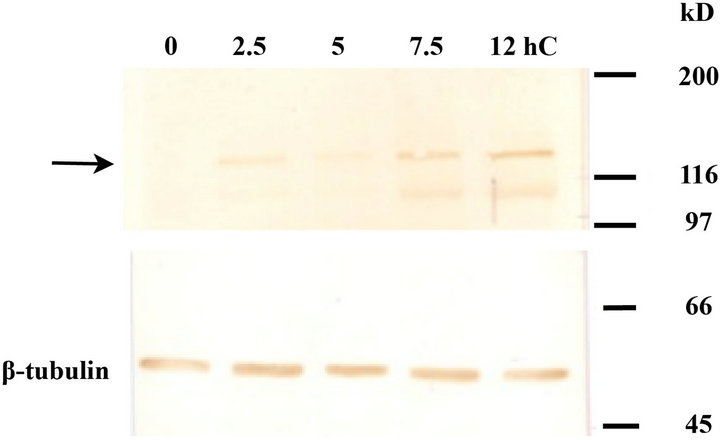 (c)
(c) (d)
(d)
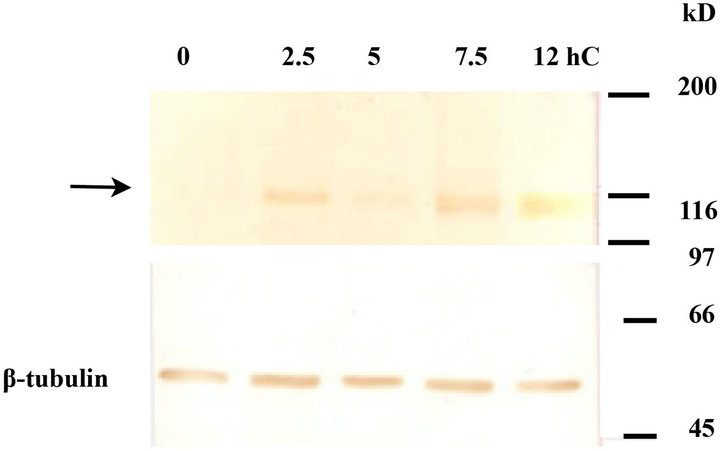
Figure 3. The quantitative change in cadherin during cell sorting culture. The expression levels of (c)-cadherin and E-cadherin were quantified by western blot analysis ((a) -(d)). (c)-cadherin ((a), arrow) and E-cadherin ((c), arrow) were seen at 120 kD and 140 kD, respectively, both of which showed an up-regulation with time ((b), (d)). Anti-β-tubulin (55 kD) was used as an internal standard. n = 4.
brane, but extremely low in the VC (Figures 4(A)-(D)). At 2.5 hC, actin bundles were observed at the edge of AC clusters (Figure 4(A), yellow arrowheads) and gradually decreased from 5 hC (Figure 4(B), yellow arrowheads) to 7.5 hC (Figure 4(C), yellow arrowheads). At 12 hC at
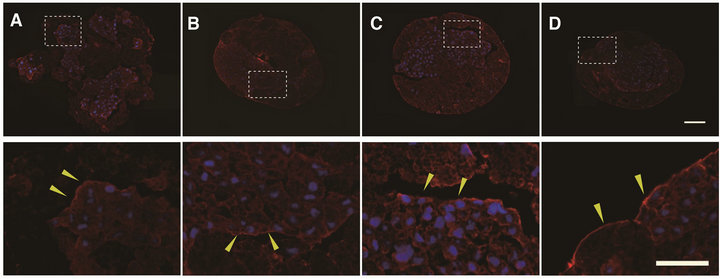
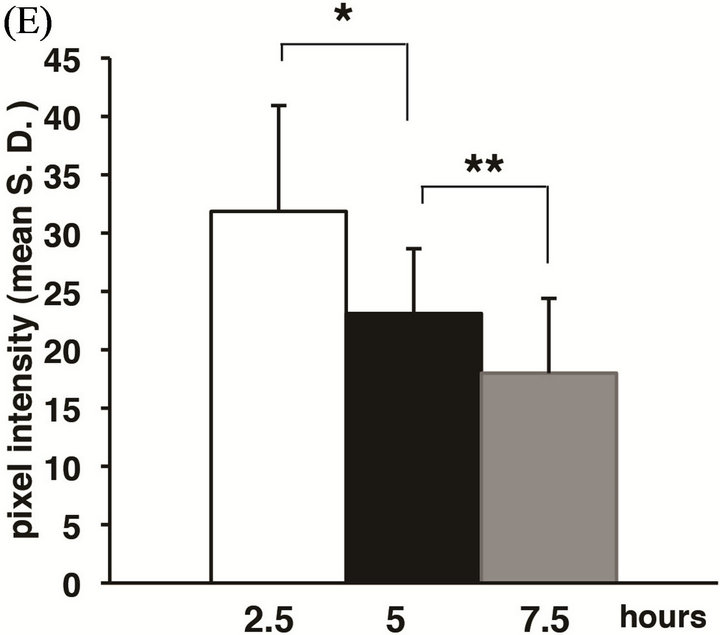
Figure 4. The expression patterns of actin filaments during cell sorting culture. Aggregates were stained with anti-actin antibody at 2.5 h (A), 5 h (B), 7.5 h (C) and 12 h (D) after the beginning stationary culture (the whole images of aggregate (upper) and high magnifications (lower). The pixel intensity of fluorescence for actin bundles at the edge of AC clusters was semiquantified by image J (E). Actin filaments were detectable along the membrane of AC, but not VC ((A)-(D)). Bundle-like expression was found along the edge of AC cluster at 2.5 h and 5 h (A, B, yellow arrowheads), and was intermittent at 7.5 h (C, yellow arrowheads). At 12 h, bundle-like expression was seen at the margin of the aggregates (D, white arrowheads). Actin (red), DAPI (blue). Scale bars: 100 μm (whole images); 50 μm (high images). Asterisks (*) indicate statistical significance (*, p < 0.003. **, p < 0.03. n = 3).
which the polarization was completed, cells closely contacted with each other, so that the space between the clusters was almost lost, and moreover, newly formed actin bundles were seen in the outermost margin of the aggregates (Figure 4(D), yellow arrowheads). The results shown in Figures 4(A)-(D) are summarized as follows: The sign of the expected active movement of the cell population was not evident, but instead, actin bundles at the edge of the AC cluster seemed to be continuously down-regulated at least up to 7.5 hC. This possibility was supported by a semiquantitative estimation by image J (Figure 4(E)). It should be noted that it is not surprising that the actin network would be upregulated at the stage from 5 hC to 7.5 hC, because the initial stage of polarization might have then started, but that was not the case.
To assess how these actin bundles were localized in the AC clusters, we also analyzed the expression of the actin filament in thick sections (20 μm) using confocal laser microscopy (Figure 5) by which the structural
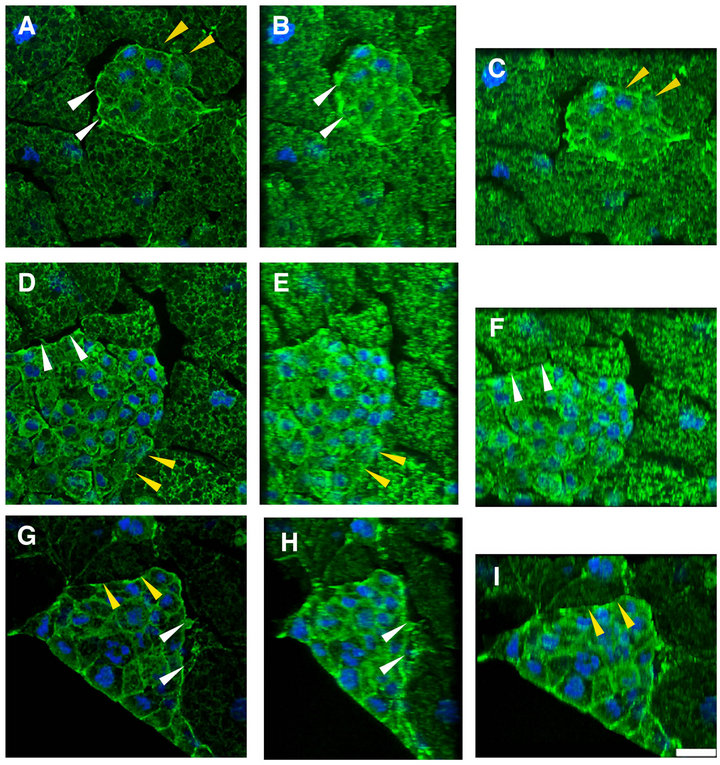
Figure 5. The accumulation of cortex actin in AC cluster revealed by conforcal images of the aggregates stained with anti-actin antibody. Samples were fixed and stained at 2.5 ((A)-(C)), 5 ((D)-(F)), 7.5 ((G)-(I)) after the beginning stationary culture. The optical slices were assembled into a stack without tilting ((A), (D), (G)), X axially tilted by 40 degrees ((B), (E), (H)), and Y axially tilted at 35 degrees ((C), (F), (I)). Such a tilting method clearly disclosed that the actin filaments, cortex actin (white arrowheads), preferentially accumulated at the margin of the AC cluster, and that they tended to gradually decrease during the stationary culture. The actin accumulation of the actin was not seen in the area where the cluster had come in contact with VC (yellow arrowheads). Fifteen to 20 optical slices (1.5 μm distance) were asembled into a stack. DAPI (blue). Scale bar: 25 μm.
artifacts after fixation would be minimized. When 15 to 20 optical slices (1.5 μm distance) were assembled into stacks (Figures 5(A), (D) and (G)), and were X axially tilted at 40 degrees (Figures 5(B), (E) and (H)), and Y axially tilted at 35 degrees (Figures 5(C), (F) and (I)), the presence of the cortex actin, namely, the accumulation of the actin along the margin of the AC cluster was disclosed. At 2.5 hC, there were remarkable gaps between the AC and VC clusters (Figure 5(A), white arrowheads), but the two clusters seemed to gradually contact with each other (Figure 5, yellow arrowheads). The cortex actin gradually decreased from 5 hC to 7.5 hC (Figures 5(D)-(H), white arrowheads). These results indicated that the accumulation of actin along the margin of AC cluster was prominent during the concentrification step and declined by the beginning of the polarization step.
3.4. Aggregate Formation of Dissociated Embryonic Cells
The dissociated AC and VC were intermingled and underwent a long-term stationary culture. At first, they indiscriminately united and formed a flat aggregate. They then gradually rounded up (Figures 5(A)-(D)). After 12 hC, the pigmented AC began to occupy the upper part of the aggregate as if it reproduced the arrangement of the ectoderm and endoderm just like in vivo (Figures 5(E)- (G)). The AC and VC clusters were mutually apposed up and down, as shown by using the Dextran rhodamine labeled cells (Figure 6(H)). From 96 hC, opaque tissue arose from the AC cluster (Figure 6(L), arrowhead) and gradually expanded (Figure 6(J), arrowheads). The aggregates were fixed with MEMFA then processed and sectioned for staining with Alcian blue, revealing that the mesodermal differentiation into the mature cartilage fairly progressed in the AC cluster (Figure 6(K), arrow, L).
4. Discussion
4.1. The Cell Sorting Process of AC and VC Is Considered to Comprise Two Steps, Concentrification and Polarization
Our experimental results (Figure 1) strongly suggest that
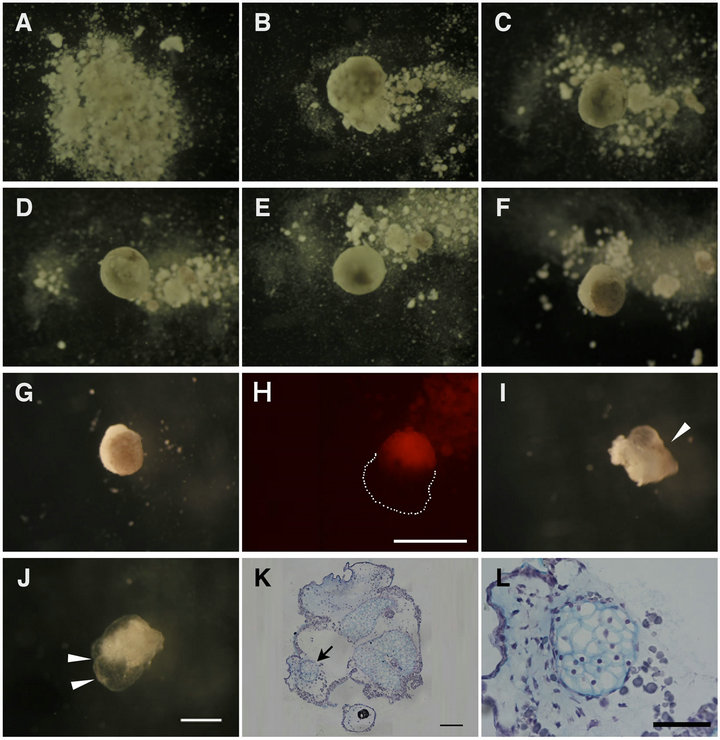
Figure 6. Long term culture of aggregates allowed cartilage formation, a typical mesodermal cell differentiation. AC + VC aggregates were incubated under the present stationary culture conditions for 0 h (A), 2 h (B), 4 h (C), 6 h (D), 12 h (E), 24 h (F), 48 h (G, H), 96 h (I) and 168 h (J). The dissociated cells reassembled and the pigmented AC appeared in the upper half after 12 h. H was a DR(+)AC+DR(-)VC aggregate. A close apposition of AC and VC clusters was noted in the aggregate (H). Around 96 h, opaque tissues emerged from AC and gradually expanded ((I), (J), arrowheads). Paraffin sections of aggregates cultured for 168h were stained with Alcian blue (K). (L) is the higher magnification of the area indicated by arrow in (K), showing that AC cluster had been differentiated into cartilage tissue. Scale bar: 500 μm ((H), (J)), 100 μm (K), and 50 μm (L).
the whole process of cell sorting of the AC and VC dissociated during the early gastrula stage can be roughly divided into two steps, i.e., concentrification and polarization. The cells seem to be devoted to “cell sorting in a conventional meaning” for the initial several hours to form a concentric-layered structure, and then the concentrificated aggregates started to restore or mimic the in vivo animal-to-vegetal polarity by rearrangement of the AC and VC clusters. Our finding that these two steps sequentially proceeded but being temporally separated has never been argued by the past studies until now. It took about half a day for the aggregates to establish a polarized embryoid structure. The subsequent embryogenesis in the present in vitro culture system also proceeded very slowly, so that, for example, 96-hour cultured embryos (Figure 6(H)), which would otherwise reach swimming tadpole larvae, showed that their development was considerably delayed. This delay, however, did not directly result in death as individuals, because normal tissue differentiation, such as cartilage formation, was allowable even during the further long-term culture as will be described later. Anyway, it is noteworthy that embryonic cells have a latent adaptability to temporally detach the two tasks of sorting out and embryogenesis.
4.2. Upregulation of Cadherins Accompanied with the Rearrangement of the AC and VC Clusters
Homophilic binding molecule cadherins are responsible for cell sorting, which produces segregation of the cell populations and formation of a tissue boundary [25,26]. In Xenopus laevis embryos, the regional identity starts to be created before midblastula and the cell sorting behavior gradually becomes remarkable as the development advances [9,10]. Accordingly, cadherins are thought to play active roles in the specification of the germ layers. Indeed, C-cadherin is known to ubiquitously express as a maternal cadherin in Xenopus laevis, while E-cadherin starts to exclusively express in the ectoderm from the gastrula stage [13-16]. The ectoderm-derived AC would express both cadherins, and the endoderm-derived VC express only C-cadherin.
Although the homophilic binding dependence of the behavior of the cadherin-expressing cells has not been verified in this study, homotypic reassembly (AC-AC or VC-VC recombination) took place and the cell-typespecific expression patterns of these cadherins in vivo was reproduced in the present in vitro system (Figure 2). AC showed an intense staining for the Cand E-cadherins, so that AC was thought to be more cohesive than VC, resulting in segregation between the AC and VC clusters in the sorting out process. Our observation of the concentrification of the clusters, in which AC was enveloped by VC, was consistent with the differential adhesion hypothesis (DAH) that the selectivity of the inside and outside of the clusters in sorting out is decided by the relative strengths of the intercellular adhesiveness [27,28]. The expression of both cadherins lasted for a while after rearrangement, suggesting that in some way the cadherins were needed for the maintenance of the aggregate morphology (Figure 2). Moreover, the expression of cadherin in the AC cluster seemed to be increased after polarization as compared to the wrapped AC cluster during the cencentrification step. Quantitative analysis by western blot also showed that the Cand E-cadherins increased with the rearrangement of the clusters (Figure 3). In the normal development of intact embryos, however, the maternal C-cadherin showed no change in the expression level during and after the gastrula stage, and the expression of E-cadherin started from the gastrula stage, increasing with the progression of development (not shown, [29]). An upregulation of the C-cadherin, which is ordinarily considered as a maternal protein, might be a unique phenomenon occurring in the present culture system. However, we have realized one difficulty in answering the question of what is the cause or trigger for the polarization. Foty et al. [30] claimed that, if the total cell binding energy of the cell populations is equal between two cell populations, the clusters should appose. According to this theory, the AC adhesiveness should be downregulated as polarization of the clusters proceeded. Our result, a steadily increasing expression of the cadherins, was unexpected, and the occurrence of polarization cannot simply be explained by only the categories about cell adhesiveness that we know at present. Cell sorting can significantly occur between cells that express different cadherins and the heterophilic adhesion sometimes occurs as strongly as the homophilic one [8]. These results suggested that the specificity and strength of the cell adhesion depend not only on the interactions between the cadherins perse, but also other unknown parameters [31].
4.3. Is the Rearrangement of the AC and VC Clusters Modulated by the Change in the Surface Tension?
We have withheld the consideration of the role of cadherins, and tried to examine the expression and localization of the cytoskeletal actins, another major intracellular element in the cell motility, in order to find a clue to the question of what is the definitive change within the cells for the concentrified-to-polarized rearrangement of the cell clusters.
Morphogenetic movements linked to the active rearrangement of the cell populations progress during the gastrula stage in Xenopus laevis [32]. As we used gastrula embryonic cells as the starting materials, we simply expected that the active cell motility might be reutilized in the cell sorting process, especially in the polarization step. However, immunohistochemical analyses (Figure 4) did not show any signs directly supporting this possibility. The overall expression of the actin filaments continued to decrease throughout the entire period of cell sorting, including the polarization, although it was also plausible that no lamellipodia were detected in the aggregates due to the poor resolution of our optical system.
We also examined the possible participation of fibronectin (FN) in the polarization step, as this extracellular matrix component serves as a substrate for mesoderm migration during gastrulation [12]. FN was not localized at the border region between clusters until 7.5 hC (not shown), while it was positive at the periphery of the AC cluster only when they were in the middle of differentiation around 12 hC. Thus, FN does not contribute to the rearrangement of the clusters, but may emerge as tissue boundaries when the AC clusters differentiate [33].
Although the immunohistochmical analyses did not show any definitive involvement of the actin filaments and fibronectins in the motility of individual cells such as lamellipodal movement (though not yet experimentally ruled out), another finding to be considered is that a significant amount of actin bundles at the edge of the AC cluster was accumulated at least until completion of the concentrification (Figure 4). The morphology of these actin bundles resembled the appearance of the ectoderm with a high surface tension observed in the cell sorting assay using zebrafish germ layer progenitors [34,35], suggesting that such an ectodermal alignment was dependent on the surface tension. The actin bundles along the surface of the AC cluster in our system might also emerge through a similar surface-tension-dependent mechanism as in zebrafish. Holtfleter's “tissue affinity” of amphibian germ layers corresponds to the tissue surface tension, that is, the force minimizing the surface area of the cell population, and the cell population with a higher surface tension is surrounded by a lower tension one [36]. According to DAH, the tissue surface tension depends on the cell adhesion energy, which decides the outside-inside hierarchy [27,30]. Therefore, the AC cluster was assumed to have a higher tension than the VC cluster during the concentrification step.
We should now pay attention to the fact that the tangential accumulation of actin at the edge of the AC clusters showed a tendency to decrease as polarization of the clusters proceeded, as observed by an image analysis of these actin bundles (Figure 4(E)). Moreover, the threedimensional analysis by confocal microscopy proved the existence of actin bundles, i.e., cell cortex actin, at the edge of the AC clusters, and confirmed that such structures decreased with the polarization. Thus our experimental results were fairly consistent with the abovestated DAH, and led us to postulate that a reducetion in the surface tension of the AC cluster is a major cause for rearrangement into the apposition of the AC and VC clusters.
DAH explains that the tissue surface tension is simply proportional to the cell adhesion energy, while the differential interfacial tension hypothesis, DITH, was proposed in which the interfacial tension in individual cells is responsible for regulation of the tissue surface tension [37]. Some recent studies emphasized that the balance between the cell adhesion and cell cortex tension was a key factor for determination of the tissue surface tension [31,34,38]. Detailed experimental analyses on the relationship between the cell adhesiveness and surface tension as well as arguments toward integration of the relevant information are needed for fully understanding the process of cell sorting, including the polarization step in this study.
Apart from the polarization, we also observed a series of interesting phenomena with the entire aggregate. By the completion of the polarization, the aggregate itself became compacted, and the space between the AC and VC clusters was almost lost. More interestingly, the actin bundles at the outermost surface of the aggregate became remarkable (Figure 4(D)). Accumulation of the actin filament was probably considered as a sign of the elevating surface tension of the entire aggregate like that of the AC cluster.
4.4. The Cell Sorting Process Can Be Followed by Tissue Differentiation Via the Inductive Interactions between the AC and VC
The cell sorting properties of the dissociated cells from Xenopus laevis embryos at the blastula and gastrula stages have been studied to date, mainly on their involvement in determination of the germ layer identities in vivo and/or influence of the properties by exogenous inducing substances [9,39]. In this study, we employed the sorting out assay using the same staged Xenopus embryos as those in preceding studies. As a series of detailed temporal analyses of cell sorting, we tried a long term stationary culture up to 7 days. The AC clusters, which had established a polarized arrangement by 12 hC, were found to exhibit the differentiation of cartilage tissues though slowly but normally (Figure 6). This reminds us of an earlier study that dissociated cells obtained from early amphibian embryos could unite indiscriminately with any other and sort out by tissue affinities and they in turn reconstructed normal tissues distinctive of derived germ layers [6].
AC is derived from the blastocoelic roof (animal cap) possessing a multi-differentiatiation potencies from the blastula to early gastrula stage. The animal cap is known to be competent to respond to a member of TGF-β, activin, and differentiate into the mesoderm and endoderm in a dose-dependent manner [40]. It was reported that the treatment of animal caps in a mass with 100 ng/ml of activin resulted in differentiation into cartilage tissues [41,42]. It is no wonder that the present in vitro system using cells dissociated during the gastrula stage allows the occurrence of similar TGF-β-directed interactions between the AC and VC followed by a typical mesoderm induction such as cartilage differentiation.
In conclusion, our study showed that the cell sorting process of AC and VC from Xenopus early gastrulae could be divided into two steps, concentrification and polarization, and that, in this in vitro system, the expression of cadherin like in vivo and a reduction of actin accumulation at the edge of AC cluster occurred. The actin downregulation was considered to account for the rearrangement of the clusters. Moreover, by extending the period of the cell sorting culture, the AC cluster was differentiated into mature cartilage tissues probably via inductive interactions between the AC and VC. Thus, the aggregate culture system of Xenopus AC and VC allows progress of a certain number of principal events involved in the embryogenesis in vivo.
5. Acknowledgements
We would like to thank the members of our Morphogenesis Laboratories for their supports, including helpful discussions in weekly seminars, during this study.
REFERENCES
- A. Gierer, S. Berking, H. Bode, C. N. David, K. Flick, G. Hansmann, H. Schaller and E. Trenkner, “Regeneration of Hydra from Reaggregated Cells,” Nature New Biology, Vol. 239, No. 91, 1972, pp. 98-101.
- Y. Takaku, T. Hariyama and T. Fujisawa, “Motility of Endodermal Epithelial Cells Plays a Major Role in Reorganizing the Two Epithelial Layers in Hydra,” Mechanisms of Development, Vol. 122, No. 1, 2005, pp. 109- 122. doi:10.1016/j.mod.2004.08.004
- H. Ide, N. Wada and K. Uchiyama, “Sorting out of Cells from Different Parts and Stages of the Chick Limb Bud,” Developmental Biolog, Vol. 162, No. 1, 1994, pp. 71-76. doi:10.1006/dbio.1994.1067
- H. Yajima, S. Yoneitamura, N. Watanabe, K. Tamura and H. Ide, “Role of N-Cadherin in the Sorting-Out of Mesenchymal Cells and in the Positional Identity along the Proximodistal Axis of the Chick Limb Bud,” Developmental Dynamics, Vol. 216, No. 3, 1999, pp. 274-284.
- H. Yajima, K. Hara, H. Ide and K. Tamura, “Cell Adhesiveness and Affinity for Limb Pattern Formation,” The International Journal of Developmental Biology, Vol. 46, No. 7, 2002, pp. 897-904.
- P. L. Townes and J. Holtfreter, “Directed Movements and Selective Adhesion of Embryonic Amphibian Cells,” Journal of Experimental Zoology, Vol. 128, No. 1, 1955, pp. 53-120. doi:10.1002/jez.1401280105
- M. Marsden and D. W. DeSimone, “Integrin-ECM Interactions Regulate Cadherin-Dependent Cell Adhesion and Are Required for Convergent Extension in Xenopus,” Current Biology, Vol. 13, No. 14, 2003, pp. 1182-1191. doi:10.1016/S0960-9822(03)00433-0
- C. M. Niessen and B. M. Gumbiner, “Cadherin-Mediated Cell Sorting Not Determined by Binding or Adhesion Specificity,” Journal of Cell Biology, Vol. 156, No. 2, 2002, pp. 389-399. doi:10.1083/jcb.200108040
- A. Turner, A. M. Snape, C. C. Wylie and J. Heasman, “Regional Identity Is Established before Gastrulation in the Xenopus Embryo,” Journal of Experimental Zoology, Vol. 251, No. 2, 1989, pp. 245-252. doi:10.1002/jez.1402510212
- C. C. Wylie, A. Snape, J. Heasman and J. C. Smith, “Vegetal Pole Cells and Commitment to Form Endoderm in Xenopus laevis,” Developmental Biology, Vol. 119, No. 2, 1987, pp. 496-502. doi:10.1016/0012-1606(87)90052-2
- R. Keller, L. Davidson, A. Edlund, T. Elul, M. Ezin, D. Shook and P. Skoglund, “Mechanisms of Convergence and Extension by Cell Intercalation,” Philosophical Transactions of the Royal Society B: Biological Sciences, Vol. 355, No. 1399, 2000, pp. 897-922. doi:10.1098/rstb.2000.0626
- R. Winklbauer and R. E. Keller, “Fibronectin, Mesoderm Migration, and Gastrulation in Xenopus,” Developmental Biology, Vol. 177, No. 2, 1996, pp. 413-426. doi:10.1006/dbio.1996.0174
- Y. S. Choi and B. Gumbiner, “Expression of Cell Adhesion Molecule E-Cadherin in Xenopus Embryos Begins at Gastrulation and Predominates in the Ectoderm,” Journal of Cell Biology, Vol. 108, No. 6, 1989, pp. 2449-2458. doi:10.1083/jcb.108.6.2449
- Y. S. Choi, R. Sehgal, P. McCrea and B. Gumbiner, “A Cadherin-Like Protein in Eggs and Cleaving Embryos of Xenopus laevis Is Expressed in Oocytes in Response to Progesterone,” Journal of Cell Biology, Vol. 110, No. 5, 1990, pp. 1575-1582. doi:10.1083/jcb.110.5.1575
- G. Levi, D. Ginsberg, J. M. Girault, I. Sabanay, J. P. Thiery and B. Geiger, “EP-Cadherin in Muscles and Epithelia of Xenopus laevis Embryos,” Development, Vol. 113, No. 4, 1991, pp. 1335-1344.
- G. Levi, B. Gumbiner and J. P. Thiery, “The Distribution of E-Cadherin during Xenopus laevis Development,” Development, Vol. 111, No. 1, 1991, pp. 159-169.
- Q. Tao, S. Nandadasa, P. D. McCrea, J. Heasman and C. Wylie, “G-Protein-Coupled Signals Control Cortical Actin Assembly by Controlling Cadherin Expression in the early Xenopus Embryo,” Development, Vol. 134, No. 14, 2007, pp. 2551-2561. doi:10.1242/dev.002824
- E. Agius, M. Oelgeschlager, O. Wessely, C. Kemp and E. M. De Robertis, “Endodermal Nodal-Related Signals and Mesodermal Induction in Xenopus,” Development, Vol. 127, No. 6, 2000, pp. 1173-1183.
- P. D. Nieuwkoop, “The Formation of the Mesoderm in Urodelean Amphibians. I. Induction by the Endoderm,” Wilhelm Roux’ Archiv für Entwicklungsmechanik der Organismen, Vol. 162, No. 4, 1969, pp. 334-373. doi:10.1007/BF00578701
- P. D. Nieuwkoop and J. Faber, “Normal Table of Xenopus laevis,” Daudin, North-Holland Publishing Company, Amsterdam, 1956.
- R. M. Harland, “In Situ Hybridization: An Improved Whole Mount Method for Xenopus Embryos,” Methods in Cell Biology, Vol. 36, 1991, pp. 685-695. doi:10.1016/S0091-679X(08)60307-6
- H. L. Sive, R. M. Grainger and R. M. Harland, “Early Development of Xenopus laevis: A laboratory Manual,” Cold Spring Harbor Laboratory Press, New York, 1998.
- R. A. Foty, C. M. Pfleger, G. Forgacs and M. S. Steinberg, “Surface Tensions of Embryonic Tissues Predict Their Mutual Envelopment Behavior,” Development, Vol. 122, No. 5, 1996, pp. 1611-1620.
- J. L. Stubbs, L. Davidson, R. Keller and C. Kintner, “Radial Intercalation of Ciliated Cells during Xenopus Skin Development,” Development, Vol. 133, No. 13, 2006, pp. 2507-2515. doi:10.1242/dev.02417
- A. Nose, A. Nagafuchi and M. Takeichi, “Expressed Recombinant Cadherins Mediate Cell Sorting in Model Systems,” Cell, Vol. 54, No. 7, 1988, pp. 933-1001. doi:10.1016/0092-8674(88)90114-6
- M. Takeichi, “The Cadherins: Cell-Cell Adhesion Molecules Controlling Animal Morphogenesis,” Development, Vol. 102, No. 4, 1988, pp. 639-655.
- R. A. Foty and M. S. Steinberg, “The Differential Adhesion Hypothesis: A Direct Evaluation,” Developmental Biology, Vol. 278, No. 1, 2005, pp. 255-263. doi:10.1016/j.ydbio.2004.11.012
- M. S. Steinberg, “Differential Adhesion in Morphogenesis: A Modern View,” Current Opinion in Genetics & Development, Vol. 17, No. 4, 2007, pp. 281-286. doi:10.1016/j.gde.2007.05.002
- S. Nandadasa, Q. Tao, N. R. Menon, J. Heasman and C. Wylie, “Nand E-Cadherins in Xenopus Are Specifically Required in the Neural and Non-Neural Ectoderm, Respectively, for F-Actin Assembly and Morphogenetic Movements,” Development, Vol. 136, No. 8, 2009, pp. 1327- 1338. doi:10.1242/dev.031203
- R. A. Foty and M. S. Steinberg, “Cadherin-Mediated CellCell Adhesion and Tissue Segregation in Relation to Malignancy,” The International Journal of Developmental Biology, Vol. 48, No. 5-6, 2000, pp. 397-409. doi:10.1387/ijdb.041810rf
- T. Lecuit and P. F. Lenne, “Cell Surface Mechanics and the Control of Cell Shape, Tissue Patterns and Morphogenesis,” Nature Reviews Molecular Cell Biology, Vol. 8, No. 8, 2007, pp. 633-644. doi:10.1038/nrm2222
- R. Winklbauer, M. Nagel, A. Selchow and S. Wacker, “Mesoderm Migration in the Xenopus Gastrula,” International Journal of Developmental Biology, Vol. 40, No. 1, 1996, pp. 305-311.
- L. A. Davidson, R. Keller and D. W. DeSimone, “Assembly and Remodeling of the Fibrillar Fibronectin Extracellular Matrix during Gastrulation and Neurulation in Xenopus laevis,” Developmental Dynamics, Vol. 231, No. 4, 2004, pp. 888-895. doi:10.1002/dvdy.20217
- M. Krieg, Y. Arboleda-Estudillo, P. H. Puech, J. Kafer, F. Graner, D. J. Muller and C. P. Heisenberg, “Tensile Forces Govern Germ-Layer Organization in Zebrafish,” Nature Cell Biology, Vol. 10, No. 4, 2008, pp. 429-436. doi:10.1038/ncb1705
- E. M. Schotz, R. D. Burdine,F. Julicher, M. S. Steinberg, C. P. Heisenberg and R. A. Foty, “Quantitative Differences in Tissue Surface Tension Influence Zebrafish Germ Layer Positioning,” HFSP Journal, Vol. 2, No. 1, 2008, pp. 42-56. doi:10.2976/1.2834817
- G. S. Davis, H. M. Phillips and M. S. Steinberg, “GermLayer Surface Tensions and ‘Tissue Affinities’ in Rana pipiens Gastrulae: Quantitative Measurements,” Developmental Biology, Vol. 192, No. 2, 1997, pp. 630-644. doi:10.1006/dbio.1997.8741
- A. K. Harris, “Is Cell Sorting Caused by Differences in the Work of Intercellular Adhesion? A Critique of the Steinberg Hypothesis,” Journal of Theoretical Biology, Vol. 61, No. 2, 1976, pp. 267-285. doi:10.1016/0022-5193(76)90019-9
- M. L. Manning, R. A. Foty, M. S. Steinberg and E. M. Schoetz, “Coaction of Intercellular Adhesion and Cortical Tension Specifies Tissue Surface Tension,” Proceedings of the National Academy of Sciences of USA, Vol. 107, No. 23, 2010, pp. 2517-12522. doi:10.1073/pnas.1003743107
- H, Kuroda, H. Sakumoto, K. Kinoshita and M. Asashima, “Changes in the Adhesive Properties of Dissociated and reaggregated Xenopus laevis Embryo Cells,” Current Opinion in Genetics & Development, Vol. 41, No. 3, 1999, pp. 283-291. doi:10.1046/j.1440-169X.1999.413428.x
- K. Okabayashi and M. Asashima, “Tissue Generation from Amphibian Animal Caps,” Current Opinion in Genetics & Development, Vol. 13, No. 5, 2003, pp. 502-507. doi:10.1016/S0959-437X(03)00111-4
- Y. Fukui, M. Furue, Y. Myoishi, J. D. Sato, T. Okamoto and M. Asashima, “Long-Term Culture of Xenopus Presumptive Ectoderm in A Nutrient-Supplemented Culture Medium,” Current Opinion in Genetics & Development, Vol. 45, No. 5-6, 2003, pp. 499-506. doi:10.1111/j.1440-169X.2003.00717.x
- M. Furue, Y. Myoishi, Y. Fukui, T. Ariizumi, T, Okamoto and M. Asashima, “Activin A induces Craniofacial Cartilage from Undifferentiated Xenopus Ectoderm in Vitro,” Proceedings of the National Academy of Sciences of USA, Vol. 99, No. 24, 2002, pp. 15474-15479. doi:10.1073/pnas.242597399
NOTES
*Corresponding author.