Computational Molecular Bioscience
Vol.2 No.3(2012), Article ID:22494,10 pages DOI:10.4236/cmb.2012.23009
A Novel Analytical Method for Structural Characteristics of Gene Networks and Its Application
College of Information Science and Engineering, Shandong University of Science and Technology, Qingdao, China
Email: wangshd2008@yahoo.com.cn
Received July 29, 2012; revised August 30, 2012; accepted September 10, 2012
Keywords: Systems Biology; Gene Network; Logic Network; Structural Parameter; Lung Cancer
ABSTRACT
Analyzing gene network structure is an important way to discover and understand some unknown relevant functions and regulatory mechanisms of organism at the molecular level. In this work, mutual information networks and Boolean logic networks are constructed using the methods of reverse modeling based on gene expression profiles in lung tissues with and without cancer. The comparison of these network structures shows that average degree, the proportion of non-isolated nodes, average betweenness and average coreness can distinguish the networks corresponding to the lung tissues with and without cancer. According to the difference of degree, betweenness and coreness of each gene in these networks, nine structural key genes are obtained. Seven of them which are related to lung cancer are supported by literatures. The remaining two genes AKT1 and RBL may have important roles in the formation, development and metastasis of lung cancer. Furthermore, the contrast of these logic networks suggests that the distributions of logic types are obviously different. The structural differences can help us to understand the mechanism of formation and development of lung cancer.
1. Introduction
Lung cancer is one of the most common and lethal malignancy carcinomas, and its formation, development and metastasis is an extremely complex polygene regulatory process [1]. Studies have shown that formation of lung cancer involves activation of oncogenes, inactivation of cancer suppressor genes and mutation of apoptosis-related genes resulting in cell proliferation and abnormal death. Therefore, finding the genes critical to the formation and development of a disease from potentially disease-related genes is of significance to the diagnosis and cure of the disease and drug design. This is an important component in the research of bioinformatics [2]. Now, many researchers recognized genes closely related to lung cancer classification, early diagnosis, prognosis and treatment using microarray technology. Battacharjee et al. [3] analyzed gene expression of tissues with and without cancer using Affymetrix U195A oligonucleotide microarray, and divided pulmonary adenocarcinoma into four subtypes. Hayes et al. [4] determined three pulmonary adenocarcinoma subtypes with clinical significance using DNA microarray. Borczuk et al. [5] built class prediction models for lung cancer histology and for cancer outcome and found that gene expression profiles of biopsy specimens of lung cancers can identify unique tumoral signatures that provide information about tissue morphology and prognosis. In order to identify a gene signature predictive of recurrence in primary lung adenocarcinoma, Larsen et al. [6] analyzed gene expression profiles in a training set of 48 node-negative tumors (stage I-II) and compared tumors from cases who remained disease-free for a minimum of 36 months with those from cases whose disease recurred within 18 months of complete resection, and obtained a 54-gene signature that predicts the risk of recurrent disease independently of tumor stage. Also, Chen et al. [7] identified sixteen genes correlated with survival among patients with nonsmall-cell lung cancer (NSCLC) by analyzing microarray data and risk scores and found five-gene (DUSP6, MMD, STAT1, ERBB3, and LCK) signature is closely associated with relapse-free and overall survival among patients with NSCLC. Tsai et al. [8] studied overexpression or knockdown of gene HLJ1 in human lung adenocarcinoma CL1-5 cells and discovered that HLJ1 expression inhibits lung cancer cell proliferation, anchorage-independent growth, tumorigenesis, cell motility, and invasion, and slowed cell cycle progression.
In post-genomic era, biologists paid more attention to functions and dynamic laws of whole genome, further understood the essence of life from an integrative and systemic perspective [9]. In recent years, scientists have developed many models of gene regulatory network. For instance, Boolean network, Bayesian network, linear model and differential equation model [10-13]. Jang et al. [14] applied decision tree method to construct gene network for disease tissues. They focused mainly on the relationships between coactions of genes and pathogenesis of a complex disease and explored a new way to study genetic complexity of disease from the view of relationship and pathway. Bowers et al. [15] proposed a computational approach-logic analysis of phylogenetic profiles (LAPP) to identify detailed triplet relationships among proteins on the basis of genomic data. It can help biomedical researchers to understand potential logical relationships and discover novel biological mechanism. Now, this method has been studied in both theories and applications [16- 21].
In this work, according to the viewpoint that the structures of matters can determine their functions, we can catch disease-risk genes through analyzing the differential structure of gene network in lung tissues with and without cancer. Different from other methods [10-13], we can find the structural difference of gene networks between normal and lung cancer easily. First, mutual information networks of carcinoma-related genes are constructed using their expression profiles under the contexts of normal and two types of lung cancer (adenocarcinoma and small cell lung cancer, abbreviated as AC and SCLC respectively). From the analysis of several structural parameters for these networks, it shows that average degree, the proportion of non-isolated nodes, average betweenness and average coreness can distinguish significantly the networks corresponding to normal and diseased tissues. Computing the degree, betweenness and coreness of each gene in the three gene networks, we find nine structural key genes. Seven of them which are related to lung cancer are supported by literatures. The validity of this approach is about 78%, while the experimental methods only can determine one or two disease-risk genes. Furthermore, we predict the remaining two genes AKT1 and REL may have important roles in the formation, development and metastasis of lung cancer. Second, gene logic networks of normal and two types of lung cancer are constructed. Comparing the distributions of 2-order logic types in these networks, we find that logic types in gene logic network of normal tissues include logic types 1, 3, 5, 8, while logic types 5, 8 and logic type 8 do not appear in that of AC and SCLC respectively. Also, logic types 2, 6 and 2, 4, 6 emerge in that of AC and SCLC respecttively. The difference of the distribution of 2-order logic types in the above gene logic networks of normal and two types of lung cancer may be a reason or result of the formation and development of lung cancer. It provides some enlightenment roles to study the intrinsic mechanism of lung cancer.
2. Reverse Network Modeling Structural Parameters of Network
Now, there are two ways to build a network model for a biological system, forward and reverse network modelings. The former is based on studies of individual components of the system and, hence, is appropriate to a system for which there exist lots of experiment data in literature. However, reverse network modeling is based on the analysis of high-throughput data (from DNA chips and some other recently developed techniques) to mine regulatory mechanisms among the components of the system. Recently, reverse network modeling has been broadly applied to the studies of various biological systems [10-14,22-24]. In 2006, Werhli et al. [22] compared the accuracy of reconstructing gene regulatory networks with three different modeling and inference paradigms Relevance networks, graphical Gaussian models and Bayesian networks through constructing Raf signal transduction network, and found that Bayesian networks and graphical Gaussian models outperform Relevance networks. Using the method of reverse network modeling, Perkins et al. [23] investigated gene regulatory network of drosophila and explained the activation of genes. Wang et al. [24] constructed gene logical network for Arabidopsis subject to external stimuli and further analyzed dynamical behaviors of the logical networks.
2.1. Mutual Information
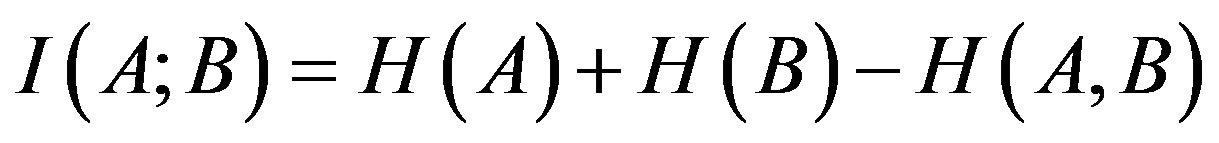
A gene expression profile is a vector whose components are its expressions in many different experiments. For convenience, we denote the gene expression profiles by their corresponding genes. We describe the relationships between genes with mutual information. For example, the mutual information of genes A and B means that of their expression profiles and is quantified as follows:
 (1)
(1)
where
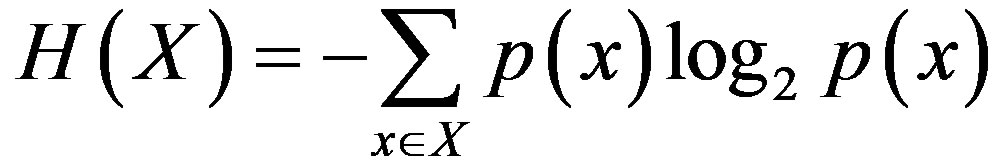
is the Shannon entropy of vector X, H(A,B) is the joint entropy of genes A and B. Larger values of I(A;B) imply closer interrelation between genes’ expression profiles. In case of I(A;B) = 0, genes’ expression profiles are independent.
2.2. LAPP Method
Bowers et al. [15-17] utilized uncertainty coefficient (abbreviated as U) to measure the logical relationships and identify logic types of 1-, 2-order among genes A, B, C. The relationships between/among two and three genes are called 1-, 2-order one, respectively. In this work, we identify logical relationships among genes by LAPP method based on 0 - 1 expression profile data of carcinoma-related genes.
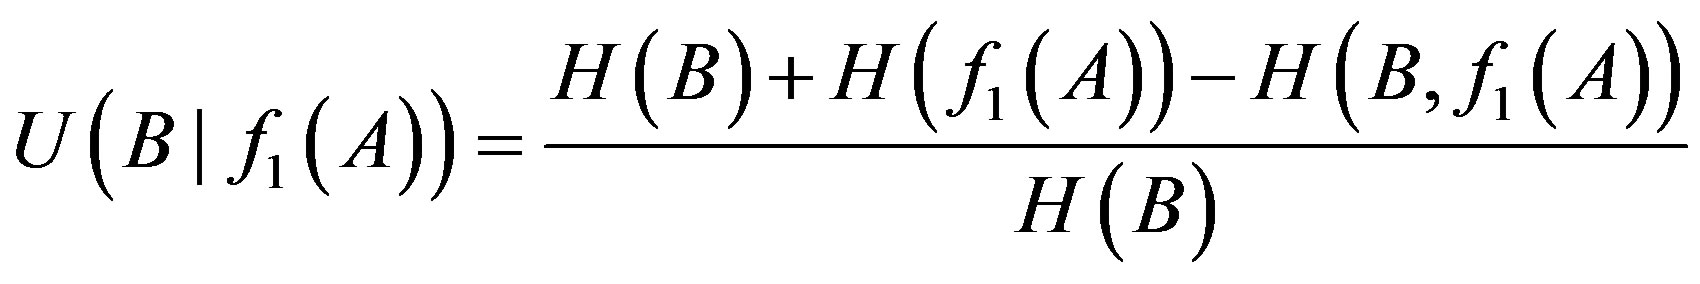
LAPP method can determine logical relationships of 1-, 2-order by calculating the uncertainty coefficient of proper functions of every order among genes. The 1-order proper relationship between genes A and B is determined in the following formula:
 (2)
(2)
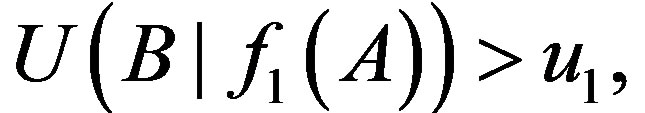
where H refers to the entropy of the individual or joint distributions.  denotes the uncertainty coefficient of the influence of X on Y. The size of U value denotes the statistical possibility of the uncertainty logic of 1-order of X to Y.
  is one of 1-order proper functions of A to B. The 1-order proper functions are divided into two types (Table 1). The first is B = A, namely, the presence of A leads to the one of B (equivalent with
 ); the second is
 , namely, the presence of A leads to the absence of B (equivalent with
 ).
).
Similarly, the uncertainty coefficient of 2-order proper function is calculated in the following expression:
 (3)
(3)
where f2 is one of 2-order proper functions. There are ten 2-order proper functions and eight logic types (Table 1).
Let ui denote thresholds of i-order uncertainty coefficients (i = 1, 2) and d' a small number and a difference threshold. When the difference of the uncertainty coefficients  and
and  is greater than a given value d’, namely: only if
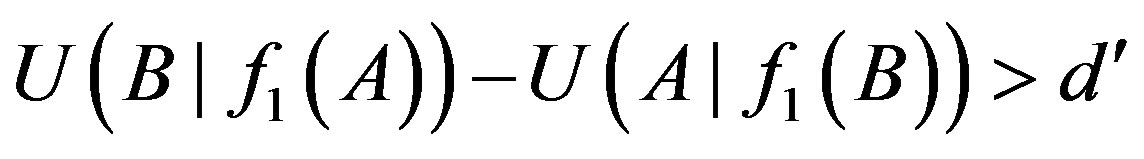
and
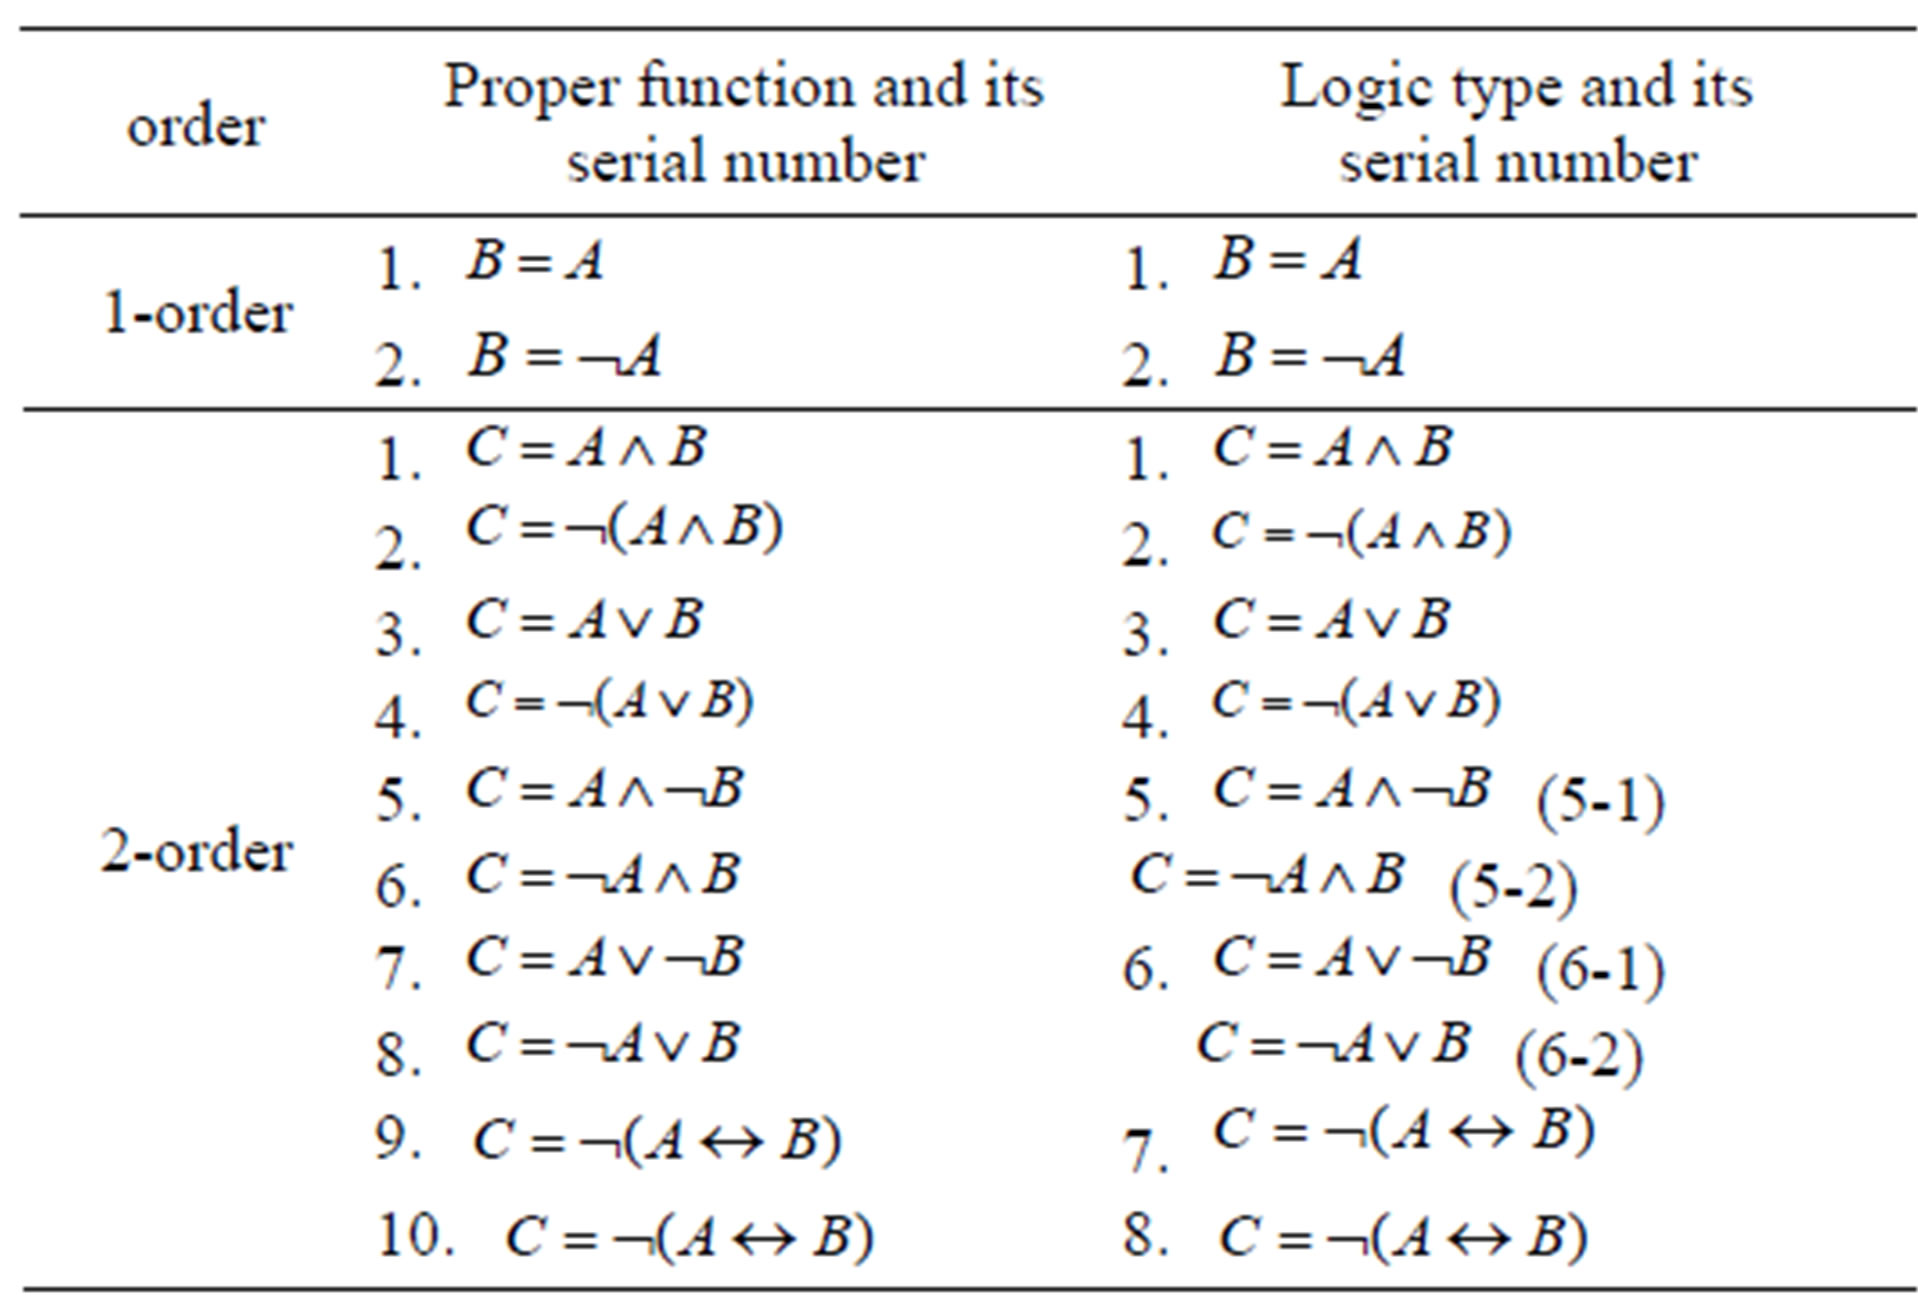
Table 1. List of 1-, 2-order proper functions and logic types. Obviously, 1-order proper functions and logic types are the same.
the relationship between genes A and B is A→B. We set threshold u2 to judge the existence of 2-order logical relationships in the following formula:
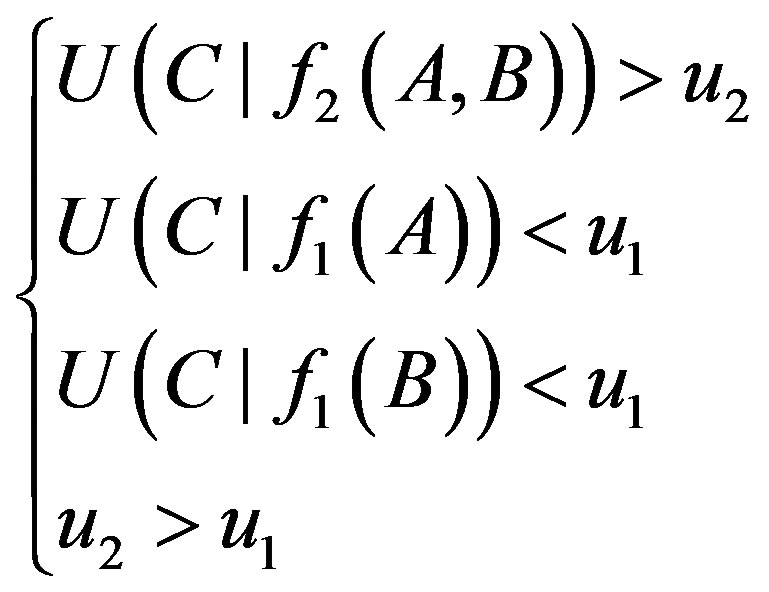 (4)
(4)
According to the above description, we can determine all the logical relationships and logic types among the investigated genes. We regard all of the logical relationships as a gene network with 1-, 2-order logics, where each node in the network represents a gene.
2.3. Structural Parameters of Network
Now, let us briefly introduce some structural parameters of network that are used to describe network structures in this work (see [25,26] for detailed explanations). Set  be a complex network with node-set
  and edge-set E.
1) Average degree (K)
The degree of a node is the number of nodes adjacent to it. The average degree is the average value of degrees of all nodes, denoted by K.
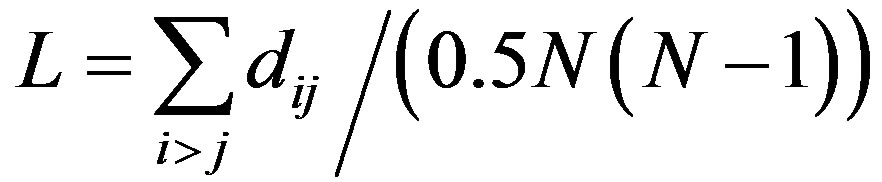
2) Average path length (L)
The distance between nodes i and j in V is defined as the smallest number of edges that connect nodes i to j, denoted by dij. The average path length L of the network is defined as
3) Average clustering coefficient (C)
The clustering coefficient of node i, denoted by Ci, is equal to the proportion of the edges among its adjacent nodes in the possible edges. The average clustering coefficient is the average value of clustering coefficients of all the nodes.
4) Modularity (Q)
In a complex network, the concept of community is a good tool to describe network structures and provides better understanding of network functions. Newman [26] proposed modularity to measure the probability of a network having communities. Suppose that network G contains l communities G1, G2, ··· Gl. Define symmetric matrix , where hij represents the ratio of the number of edges between two communities Gi, Gj to the total number of edges of the network. The modularity is defined as:
where ai is the sum of all elements in the ith row of M, representing the ratio of the number of edges adjacent to community Gi to that of all edges.
5) Proportion of non-isolated nodes (R)
Proportion of non-isolated nodes, denoted by R, is the ratio of the number of the nodes with degree not 0 to that of all nodes.
6) Average betweenness (B)
is the betweenness of the node n, where dij presents the number of the shortest paths between the node i and j, and dinj presents that of paths which pass the node n. The betweenness of a node reflects its influence in the network. The average value of the betweennesses of all nodes in the network is average betweenness of the network.
7) Average coreness (H)
k-core of a graph is the subgraph after getting rid of the nodes whose degrees are smaller than or equal to k repeatedly. If a node exists in a k -core, but is removed in (k + 1)-core, the coreness of the node is k. The average value of the corenesses of all nodes is average coreness of the network.
3. Material and Numerical Experiments
3.1. Data Sources and Processing
1) Data sources The gene expression data we work on are all from GPL96 and GPL570 in NCBI. The sample data set for normal tissue, AC and SCLC includes 73, 68 and 39 samples respectively. These data are from GSE2771, GSE12667 and GSE15240 respectively. For description convenience, we refer to the networks corresponding to these three data sets as normal network, adenocarcinoma network (abbreviated as AC network) and small cell lung cancer network (abbreviated as SCLC network). Almost all of these data sets include p-values and P-M-A (P, A and M stand for presence, absence and margin respecttively) except for some samples. We process these three data sets (corresponding to normal tissue, AC and SCLC)) by MAS 5.0 of Expression Console, and obtain values, p-values and P-M-A for each sample of each gene. Then we represent P with 1, A and M with 0 in these three processed data sets. Our work is based on these three databases (corresponding to normal, AC and SCLC group)1.
2) Selection of carcinoma-related genes It is out of our scope to construct and analyze the networks for all genes in the databases (each of the three databases contains expressions of more than 20,000 genes). Our main focus is on carcinoma-related genes [27]. From the databases we choose 301 genes that are known to be linked with cancers. These genes correspond to 801 probes. In the cases where several probes correspond to one gene, the highest expression value is chosen to form the gene’s expression profile. We obtain 283 genes in normal group and 286 genes in AC and SCLC group. Choosing the intersection of these genes, and using Bonferroni test to compare the difference of genes’ expression profiles between normal and lung cancer groups respectively, we choose the significant level 0.0001 and obtain 91 genes which both have significant difference between normal and two types of lung cancer. We focus on mutual information and logical networks of these genes in each database2.
3) Data processing To calculate mutual information between arbitrary two genes, we discretize the p-values in each database as follows: a) Select the ranges [Min, Max] for p-values in the intervals [0,0.05] and (0.05,1] and divide them into 10 portions respectively such that each portion contains almost the same number of p-values. Order the portions in the number order and denote them by 1st, 2nd, ··· 20th interval, respectively; b) Replace the p-values in an interval by its labeling value. Obviously, the granularity of our discretization is finer than that of 0 - 1 discretization and hence our discretization loses less information contained in the 0 - 1 discretization. Therefore, it is reasonable to believe that the mutual information networks based on our finer discretization better reflect the nature of the gene regulatory system.
3.2. Establishment of Mutual Information Gene Network
Based on above discretized data, we can calculate mutual information values of any two genes by formula (1) and hence obtain a complete network of all genes in each database. Note that the ranges for mutual information values for our three databases are different. For the purpose of comparing the networks, we normalize the mutual information values for each database as
where x and x' represent the original and normalized mutual information values. max and min are the maximum and minimum values of the mutual information values before normalization respectively.
In order to highlight the structural characteristics of the networks so that valuable biological conclusions can be drawn, it is necessary to choose a threshold value to carry out coarse graining on normalized mutual information. We build three gene networks (with normalized mutual information values as edge weights), corresponding to the cases of normal, AC and SCLC group. For each network, we compute seven structural parameters: average degree K, average path length L, average clustering coefficient C, modularity Q, proportion of non-isolated nodes R, average betweenness B and average coreness H. These structural parameters are plotted versus threshold values T in Figure 1. From Figure 1, we can see that these structural parameters K, R, B and H can distinguish normal network from AC and SCLC networks in a broad range of the threshold variation. It shows that the difference between normal and lung cancer which do not dependent on the choosing of threshold.
We define the degree of differentiation of each structural parameter as the proportion of the distinguishing interval of threshold in [0,1], denote the degree of differentiation that the values of structural parameters of normal tissues are greater or smaller than that of lung cancer by G differentiation or S differentiation respectively. The results are show in Table 2. In order to show the specific of these networks, we randomize the genes’ expression profiles keeping the equal number of p-values in [0, 0.05] and (0.05, 1]. We obtain the changes of those structural parameters versus thresholds in randomized networks (Figure 2) and compute the degrees of differentiation of those structural parameters (Table 2). Compared with these results in real data, these structural parameters can distinguish normal and lung cancer in their structures. According to the view that system’s structure decides its function, it shows that the functions of gene networks have significant difference in normal and lung cancer.
We search genes which have largest contribution to these differences through calculating the difference of the degree, betweenness and coreness of each gene in the three gene networks. We get the top ten genes whose degrees, betweennesses or corenesses are largest (Table 3), which are called structural key genes. We get the intersection of these genes and find that there are seven genes contributing to the difference of structures of gene networks of AC and normal, also there are seven genes between SCLC and normal tissues. Genes FN1 and REL are special between AC and normal tissues, and genes TOP2A and RBL1 between SCLC and normal tissues.
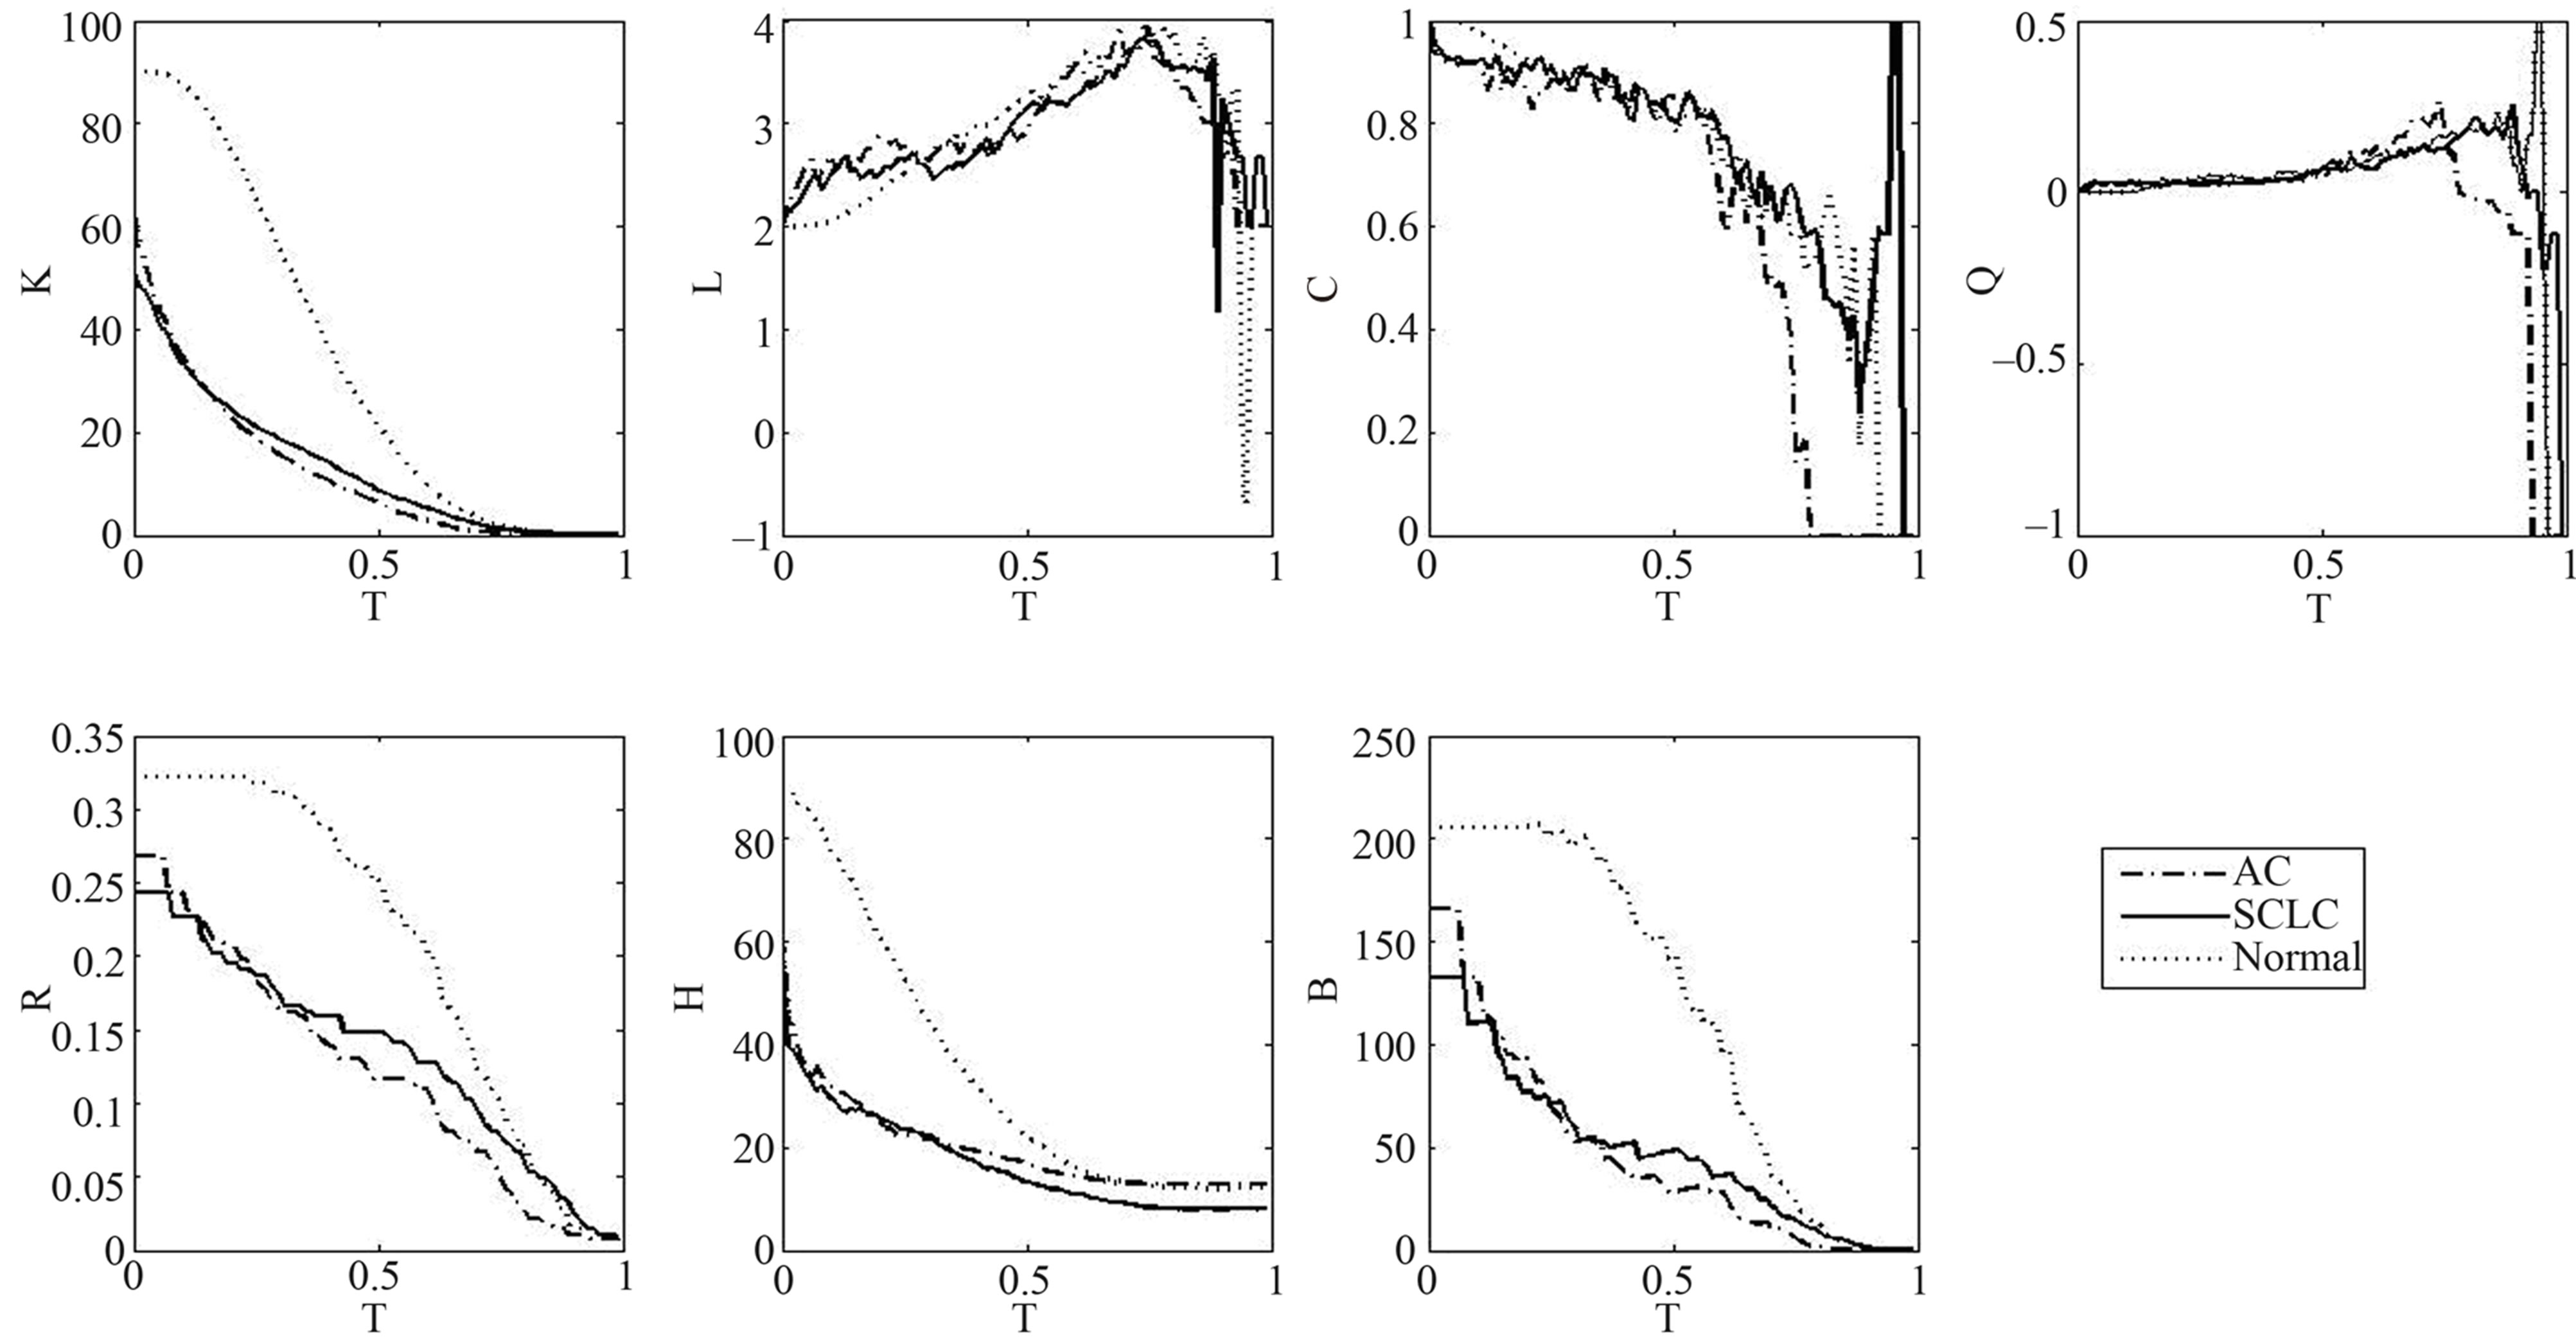
Figure 1. Plots of seven structural parameters versus threshold values T in real networks.
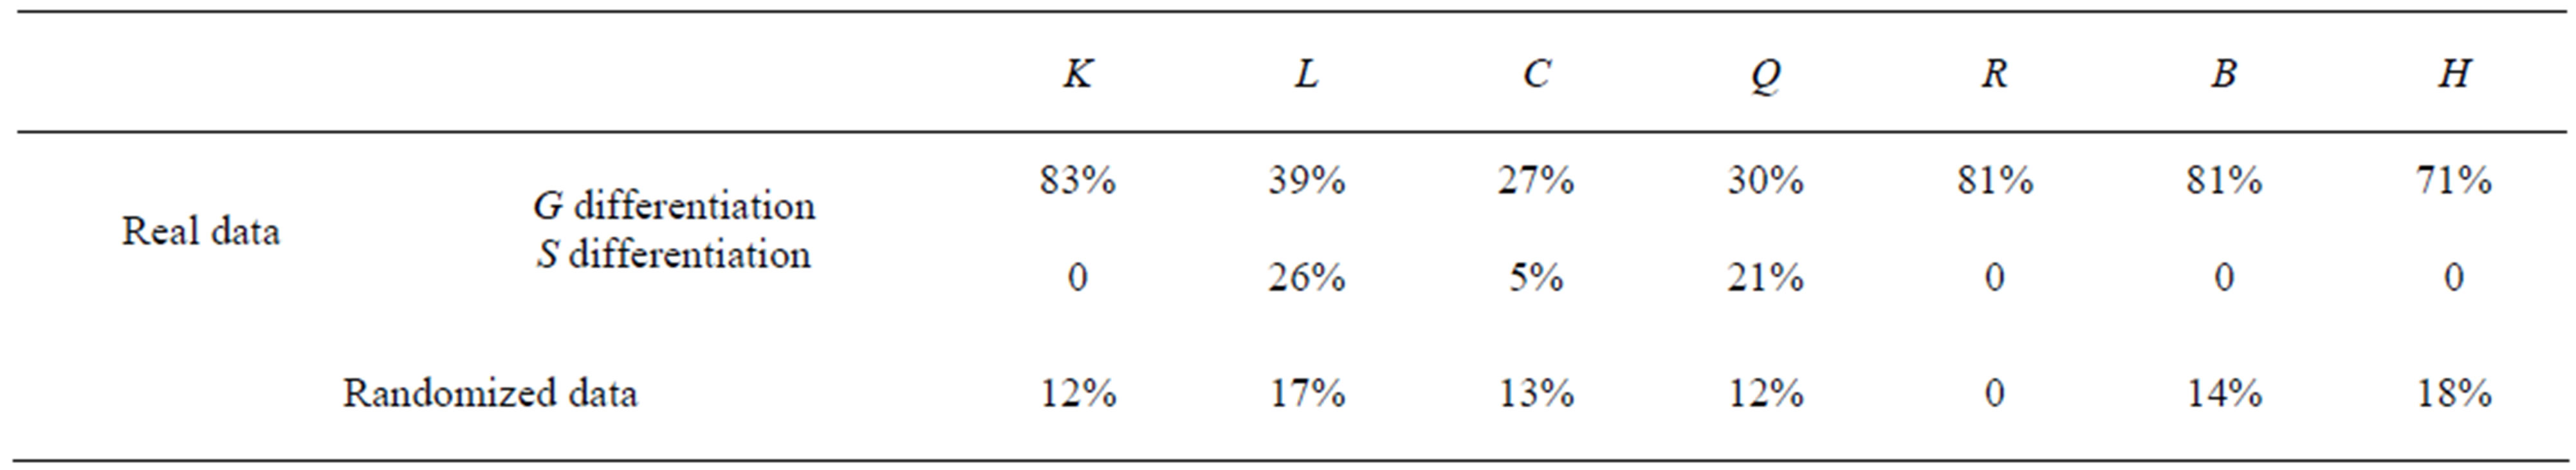
Table 2. Comparison the degree of differentiation of real data with that of randomized data.

Figure 2. Plots of seven structural parameters versus threshold values T in randomized networks.
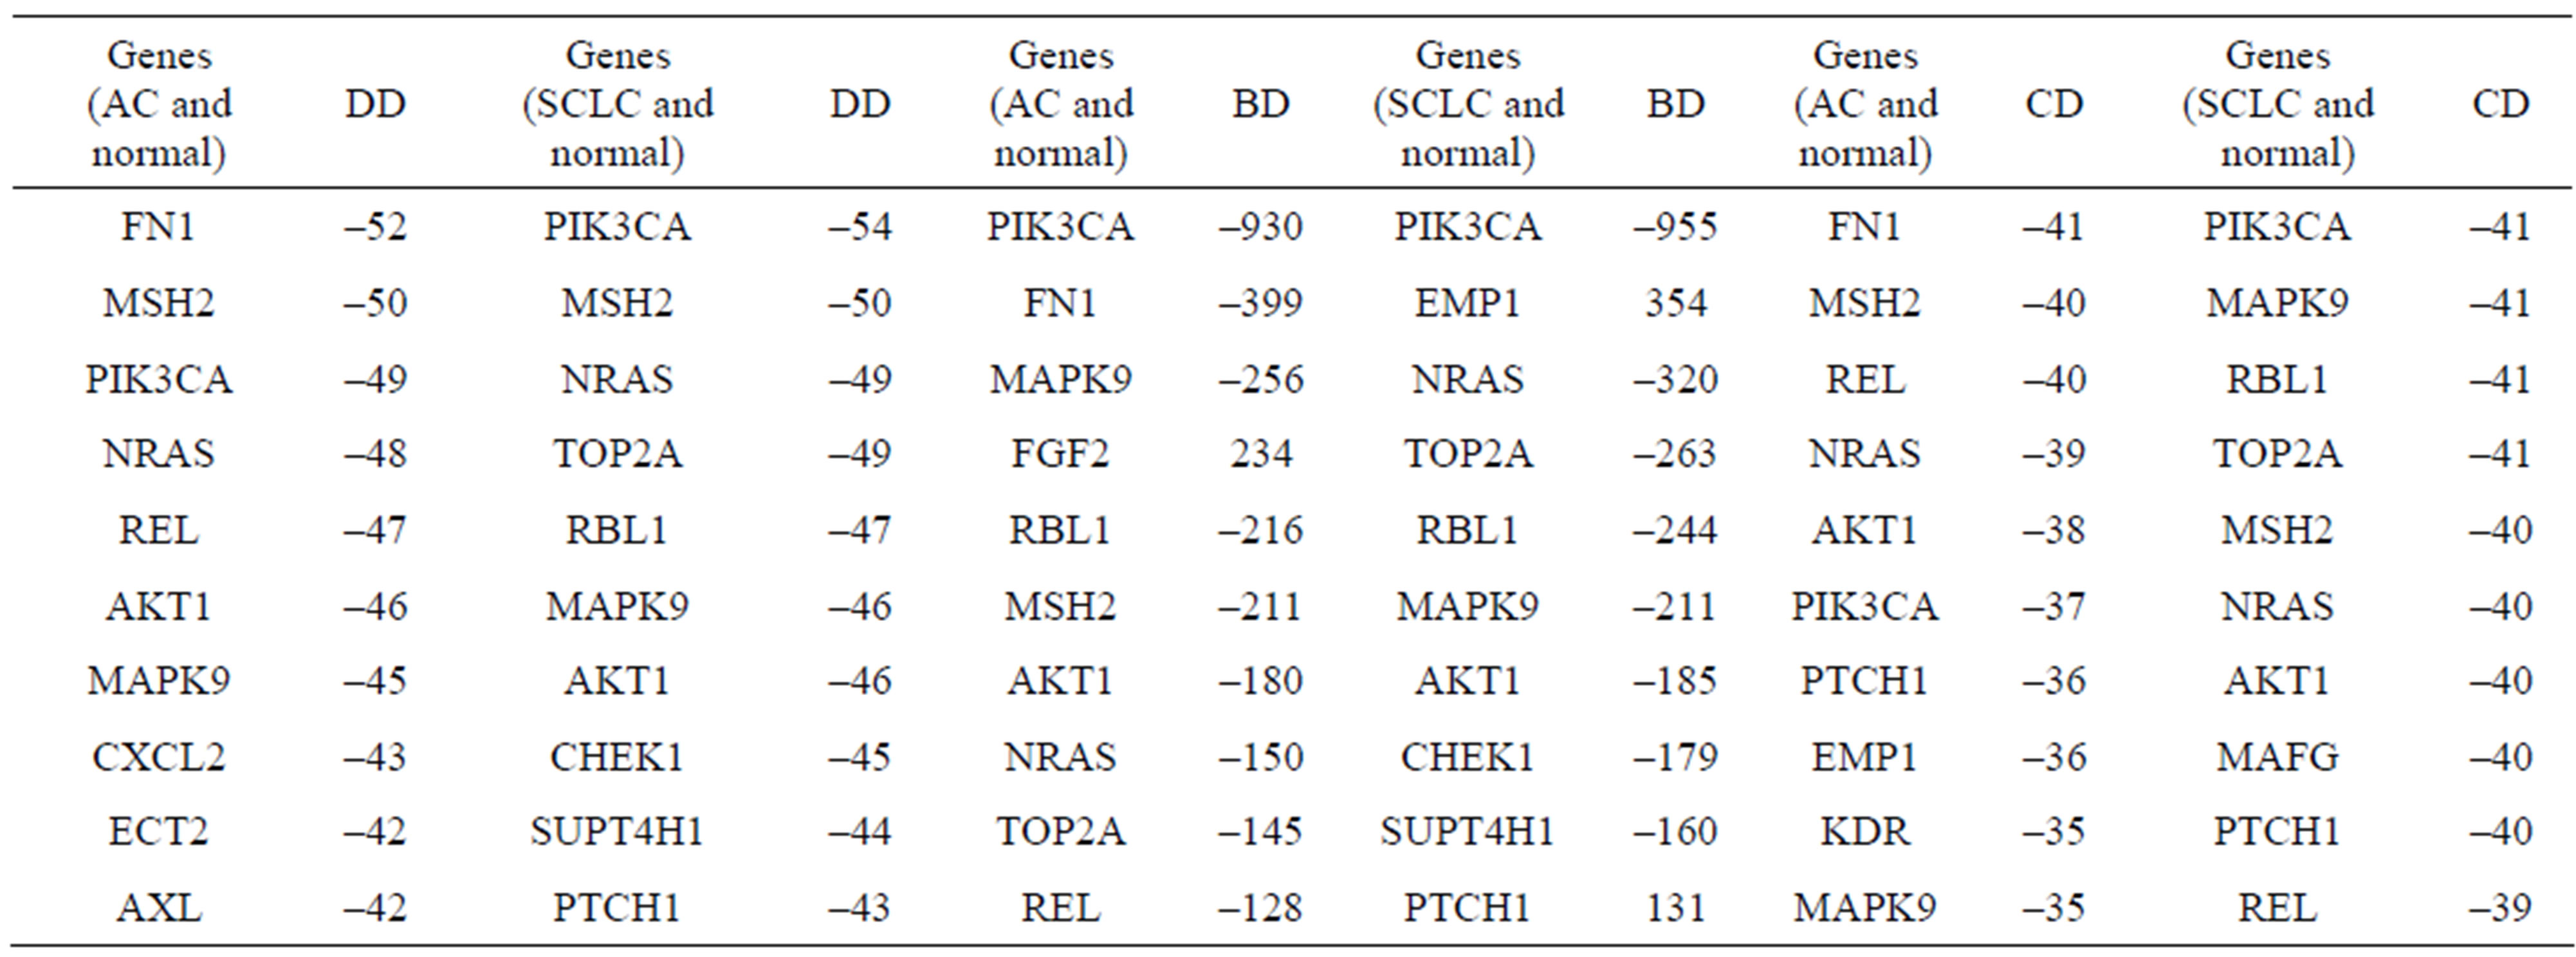
Table 3. The top ten genes of the difference of degree, betweenness and coreness between normal and lung cancer networks respectively. The negative value presents that the degree or betweenness or coreness of the gene in gene network of disease stage is smaller than that of normal tissues. The differences of degree, betweenness and coreness are abbreviated as DD, BD and CD respectively.
3.3. Construction of Gene Logical Networks
Looking for the regulatory relationships among genes can help us to understand the regulatory pathways related to diseases and discover the regulatory mechanisms of organism at the molecular level. Next, we will construct and analyze gene logical networks for normal, AC and SCLC respectively.
Based on three databases corresponding to normal, AC and SCLC group with 0-1 expression data in Section 3.1, we can calculate i-order uncertainty coefficients of any I + 1 (i = 1, 2) genes by formulas (2) - (4). It is considered that there is at most one 1-order logical relationship between any two genes A and B. We set a relative difference:
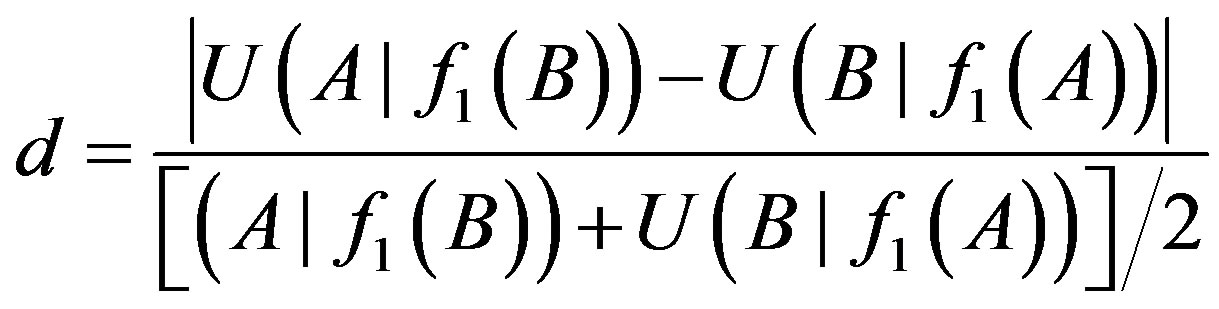
The 1-order proper function f1 between genes A and B is B→A (or A→B) only if d > 0.15 and  (or
(or ) > u1. Hence we obtain a complete logical network of all genes with 1-, 2-order logics in each database.
In order to eliminate the difference of 2-order logic types owing to choosing thresholds, we compare the distribution of 2-order logic types in the three networks at different threshold pairs (Figure 3). It shows that the distribution of 2-order logic types nearly doesn’t change as the threshold pairs. In normal gene logic networks, there are logic types 1, 3, 5, 8, while in that of AC, logic types 5, 8 do not appear and logic types 2, 4, 6 emerge, also in that of SCLC, logic types 8 does not appear and logic 2, 6 emerge. The difference of 2-order logic types between normal tissues and lung cancer may be a reason or result of the formation of lung cancer.
4. Conclusions and Discussions
Based on the gene expression data of carcinoma-related genes expressed in normal tissues and diseased tissues
 Normal
  AC
AC  SCLC
SCLC
Figure 3.The distribution of 2-order logic types in logic networks at different thresholds. The darker the color is the higher proportion of the number of a logic type has .
with AC and SCLC, we construct the corresponding mutual information networks. From the comparison of the structural parameters of mutual information networks, we find nine structural key genes: PIK3CA, FN1, MAPK9, MSH2, NRAS, TOP2A, RBL1, AKT1 and REL, where genes FN1, REL and RBL1, TOP2A are special genes in comparing the gene network of normal with those of AC and SCLC respectively. In the constructed gene networks, these genes are related to each other with higher mutual information values in that of normal (greater than 0.7) than in those of AC and SCLC (smaller than 0.05). We consider that these genes may play important roles in maintaining the normal functions of genome. Through analyzing Gene Ontology of each genes, we find that five genes of them PIK3CA, MAPK9, MSH2, AKT1 and TOP2A are involved in the regulation of cell apoptosis. For example, gene FN1 is related to cell adhesion and gene RBL1 is a key regulator in the regulation of cell cycle. Therefore, we predict that the disorder of cell apoptosis, cell adhesion and cell cycle might play important roles in the formation of lung cancer.
Researches show that gene FN1 encodes fibronectin which is involved in cell adhesion and migration processes including embryogenesis, wound healing, blood coagulation, host defense, and metastasis. Anastellin binds fibronectin and induces fibril formation. This fibronectin polymer, named superfibronectin, exhibits enhanced adhesive properties. Both anastellin and superfibronectin inhibit tumor growth, angiogenesis and metastasis. Anastellin activates p38 MAPK and inhibits lysophospholipid signaling. Nashino et al. [28] found that the disappearanceof FN reflects the aggressiveness of the tumor and presumably plays an important role in the prognosis of AC of the lung. So gene FN1 is an ACsuppressor gene. The protein encoded by gene RBL1 is similar in sequence and possibly function to the product of the retinoblastoma 1 (RB1) gene. RB1 gene product is a tumor suppressor protein that appears to be involved in cell cycle regulation, as it is phosphorylated in the S to M phase transition and is dephosphorylated in G1 phase of the cell cycle. Both the RB1 protein and the product of this gene can form a complex with adenovirus E1A protein and SV40 large T-antigen, with the SV40 large T-antigen binding only to the unphosphorylated form of each protein. Due to the sequence and biochemical similarities with the RB1 protein, it is thought that the protein encoded by gene RBL1 may also be a tumor suppressor. Baldi et al. [29] found an inverse correlation between the histological grading of the tumors, the development of metastasis, and the level of expression of Rb2/p130 which is structurally and functionally similar to the product of gene RBL1. So gene RBL1 may be a tumor suppressor gene of lung cancer. Gene TOP2A encodes a DNA topoisomerase which functions as the target for several anticancer agents and a variety of mutations in this gene have been associated with the development of drug resistance. Jensen et al. [30] studied the resistant to the inhibitory action of F 11782 in SCLC patients and found that TOP2A is a target of F 11782 in vivo, and that F 11782 may act as a novel topoisomerase II poison. It shows the function of gene TOP2A in SCLC. Gene PIK 3CA encodes the p110alpha catalytic subunit, Samuels et al. [31] found that PIK3CA was frequently mutated in cancers of the colon, breast, brain and lung. The majority of mutations clustered near two positions within the PI3K helical or catalytic domains and at least one hotspot mutation appeared to increase kinase activity. The protein encoded by gene MAPK9 is a member of MAP kinase family. MAP kinases act as an integration point for multiple biochemical signals, and are involved in a wide variety of cellular processes such as proliferation, differentiation, transcription regulation and development. This gene and MAPK8 are also known as c-Jun Nterminal kinases. This kinase blocks the ubiquitination of tumor suppressor p53, and thus it increases the stability of p53 in nonstressed cells. Nitta et al. [32] investigated the role of the JNK2α (the alias of MAPK9) isoform in NSCLC formation by examining its expression in primary tumors and by modulating its expression in cultured cell lines and found Cell lines deficient in JNK2α had decreased cellular growth and anchorage-independent growth, and the tumors were four-fold smaller in mass. Gene MSH2 is a DNA mismatch repair gene, Xinarianos et al. [33] found a relationship between p53 and MSH2, there is evidence for p53 being a transcriptional activator of MSH2, and suggested a hypothesis that MSH2 acts as a DNA-damage signaller triggering p53 overexpression. Sasaki et al. [34] found NRAS mutation in 1 of 195 patients, although the rate is small, we consider that the mutation of NRAS may be a reason of the formation of lung cancer. The relationships between MSH2, NRAS and SCLC are not clear, but owing to they have important roles in structures of gene networks between normal and SCLC, we predict these two genes are related to the formation and development of SCLC. Besides, the remaining two genes AKT1 and REL are open. We predict that they may have significant roles in the formation of lung cancer based on the view that system’s structure decides its function.
Through constructing gene logic networks corresponding to normal, AC and SCLC, we find the significant difference of the distribution of 2-order logic types. Relative to normal gene logic network, logic types 5, 8 do not appear in that of AC, and logic type 8 does not appear in that of SCLC. Also, logic types 2, 6 and 2, 4, 6 emerge in that of AC and SCLC respectively. The difference of the distribution of 2-order logic types in the above gene logic networks of normal and two types of lung cancer may be a reason or result of the formation of lung cancer. It provides some enlightenment roles to study the intrinsic mechanism of lung cancer.
Finally, we have applied this approach to the gene detection of other cancers, such as breast cancer and brain tumor, and Arabidopsis thaliana response to the special external stimulus. Through analyzing the results, we find most of genes can be supported by literatures. It further approves the validity of our approach.
5. Acknowledgements
The authors would like to thank National Natural Science Foundation of China (Nos: 60874036, 61170183), Scientific Research Foundation for Excellent Middle-Aged and Youth Scientists of Shandong Province of China (BS2011SW025), SDUST Research Fund of China (2010 KYJQ104) for the support to this work.
REFERENCES
- T. Mistudomi and T. Takahashi, “Genetic Abnormalities in Lung Cancer and Their Prognostic Implication,” Gan to Kagaku Ryoho, Vol. 23, 1996, pp. 990-996.
- E. S. Lander and R. A. Weinberg, “Genomics: Journey to the Center of Biology,” Science, Vol. 287, No. 5459, 2000, pp. 1777-1782. doi:10.1126/science.287.5459.1777
- A. Bhattacharjee, W. G. Richards, J. Staunton, C. Li, S. Monti, P. Vasa, C. Ladd, J. Beheshti, R. Bueno, M. Gilette, M. Loda, G. Weber, E. J. Mark, E. S. Lander, W. Wong, B. E. Johnson, T. R. Golub, D. J. Sugarbaker and M. Meyerson, “Classification of Human Lung Carcinomas by mRNA Expression Profiling Reveals Distinct Adenocarcinoma Subclasses,” Proceedings of the National Academy of Sciences of the United States of America, Vol. 98, No. 24, 2001, pp. 13790-13795. doi:10.1073/pnas.191502998
- D. N. Hayes, S. Monti, G. Parmigiani, C. B. Gilks, K. Naoki, A. Bhattacharjee, M. A. Socinski, C. Perou and M. Meyerson, “Gene Expression Profiling Reveals Reproducible Human Lung Adenocarcinoma Subtypes in Multiple Independent Patient Cohorts,” Journal of Clinical Oncology, Vol. 24, No. 31, 2006, pp. 5079-5090. doi:10.1200/JCO.2005.05.1748
- A. C. Borczuk, L. Shah, G. D. Pearson, K. L. Walter, L. Wang, J. H. Austin, R. A. Friedman and C. A. Powell, “Molecular Signatures in Biopsy Specimens of Lung Cancer,” American Journal of Respiratory and Critical Care Medicine, Vol. 170, No. 2, 2004, pp. 167-174. doi:10.1164/rccm.200401-066OC
- J. E. Larsen, S. J. Pavey, L. H. Passmore, R. V. Bowman, N. K. Hayward and K. M. Fong, “Gene Expression Signature Predicts Recurrence in Lung Adenocarcinoma,” Clinical Cancer Research, Vol. 13, No. 10, 2007, pp. 2946- 2954. doi:10.1158/1078-0432.CCR-06-2525
- H. Y. Chen, S. L. Yu, C. H. Chen, G. C. Chang, C. Y. Chen, A. Yuan, et al., “A Five-Gene Signature and Clinical Outcome in Non-Small-Cell Lung Cancer,” The New England Journal of Medicine, Vol. 356, No. 1, 2007, pp. 11- 20. doi:10.1056/NEJMoa060096
- M. F. Tsai, C. C. Wang, G. C. Chang, C. Y. Chen, C. L. Chen, Y. P. Yang, et al., “A New Tumor Suppressor DnaJ-Like Heat Shock Protein, HLJ1, and Survival of Patients with Non-Small-Cell Lung Carcinoma,” Journal of the National Cancer Institute, Vol. 98, No. 12, 2006, pp. 825-838. doi:10.1093/jnci/djj229
- R. Brent, “Genomic Biology,” Cell, Vol. 100, No. 1, 2000, pp. 169-183. doi:10.1016/S0092-8674(00)81693-1
- T. Akutsu, S. Miyano and S. Kuhara, “Identification of Genetic Networks from a Small Number of Gene Expression Patterns under the Boolean Network Model,” Pacific Symposium on Biocomputing,1999, pp. 17-28,
- D. Husmeier, “Reverse Engineering of Genetic Networks with Bayesian Networks,” Biochemical Society Transactions, Vol. 31, 2003, pp. 1516-1518. doi:10.1042/BST0311516
- E. P. Van Someren, L. F. Wessels and M. J. Reinders, “Linear Modeling of Genetic Networks from Experimental Data,” International Conference on Intelligent Systems for Molecular Biology, Vol. 8, 2000, pp. 355-366.
- T. Chen, H. Y. He and G. M. Church, “Modeling Gene Expression with Differential Equations,” Pacific Symposium on Biocomputing, 1999, pp. 29-40.
- W. Jiang, C. Wu, J. K. Xu, Y. Y. Yang and X. Li, “Using Decision Forest to Construct Gene Networks for Complex Disease,” Chinese Journal of Biomedical Engineering, Vol. 28, 2009, pp. 263-269.
- P. M. Bowers, S. J. Cokus, D. Eisenberg and T. O. Yeates, “Use of Logic Relationships to Decipher Protein Network Organization,” Science, Vol. 306, No. 5705, 2004, pp. 2246-2249. doi:10.1126/science.1103330
- X. Zhang, S. C. Kim, T. Wang and B. Chitta, “Joint Learning of Logic Relationships for Studying Protein Function Using Phylogenetic Profiles and the Rosetta Stone Method,” IEEE Transactions on Signal Processing, Vol. 54, No. 6, 2006, pp. 2427-2435. doi:10.1109/TSP.2006.873718
- J. X. Zhang, X. Ji and L. Zhang, “Extracting Three-Way Gene Interactions from Microarray Data,” Bioinformatics, Vol. 23, No. 21, 2007, pp. 2903-2909. doi:10.1093/bioinformatics/btm482
- M. W. Anderson, “Functional Genomics Annotation: It’s Logical! Symbolic Logic Helps Unravel Complex Protein Networks,” Scientist, Vol. 19, No. 5, 2005, p. 33.
- V. Spirin, M. S. Gelfand, A. A. Mironov and L. A. Mirny, “A Metabolic Network in the Evolutionary Context: Multiscale Structure and Modularity,” Proceedings of the National Academy of Sciences of the United States of America, Vol. 103, No. 23, 2006, pp. 8774-8779. doi:10.1073/pnas.0510258103
- G. Glazko, M. Coleman and A. Mushegian, “Similarity Searches in Genome-Wide Numerical Data Sets,” Biology Direct, Vol. 1, No. 1, 2006, pp. 1-14.
- P. M. Bowers, B. D. O’Connor, S. J. Cokus, E. Sprinzak, T. O. Yeates and D. Eisenberg, “Utilizing Logical Relationships in Genomic Data to Decipher Celluar Processes,” FEBS Journal, Vol. 272, No. 20, 2005, pp. 5110-5118. doi:10.1111/j.1742-4658.2005.04946.x
- A. V. Werhli, M. Grzegorezyk and D. Husmeier, “Comparative Evaluation of Reverse Engineering Gene Regulatory Networks with Relevance Networks Graphical Gaussian Models and Bayesian Networks,” Bioinformatics, Vol. 22, No. 20, 2006, pp. 2523-2531. doi:10.1093/bioinformatics/btl391
- T. J. Perkins, J. Jaeger, J. Reinitz and L. Glass, “Reverse Engineering the Gap Gene Network of Drosophila melanogaster,” PLOS Computational Biology, Vol. 2, No. 5, 2006, pp. 417-428.
- S. D. Wang, Y. Chen, Q. Y. Wang, E. Y. Li, Y. S. Su and D. Z. Meng, “Analysis for Gene Networks Based on Logical Relationships,” Journal of Systems Science and Complexity, Vol. 23, No. 5, 2010, pp. 999-1011, doi:10.1007/s11424-010-0205-0
- A. Réka and A. L. László, “Statistical Mechanics of Complex Networks,” Reviews of Modern Physics, Vol. 74, 2002, pp. 47-97. doi:10.1103/RevModPhys.74.47
- M. E. J. Newman and M. Girvan, “Finding and Evaluating Community Structure in Networks,” Physical Review. E, Statistical, Nonlinear, and Soft Matter Physics, Vol. 69, No. 2, 2004, pp. 6113-6127. doi:10.1103/PhysRevE.69.026113
- L. S. Si and X. Li. “Oncogenes, Cancer Suppressor Genes, Cancer-Related Genes,” Shanxi Technology and Science Press, Xi’an, 2002.
- T. Nishina, T. Ishida, K. Yasumoto and K. Sugimachi, “Distribution of Fibronection in Adenocarcinoma of the Lung: Classification and Prognostic Significance,” Journal of Surgical Oncology, Vol. 43, No. 2, 1990, pp. 94- 100. doi:10.1002/jso.2930430208
- A. Baldi, V. Esposito, A. De Luca, FuY, I. Meoli, G. G. Giordano, M. Caputi, F. Baldi and A. Giordano, “Differential Expression of Rb2/p130 and p107 in Normal Human Tissues and in Primary Lung Cancer,” Clinical Cancer Research, Vol. 3, No. 10, 1997, pp. 1691-1697.
- L. H. Jensen, A. Renodon-Corniere, K. C. Nitiss, B. T. Hill, J. L. Nitiss, P. B. Jensen and M. Sehested, “A Dual Mechanism of Action of Anticancer Agent F 11782 on Human Topoisomerase II Alpha,” Biochemical Pharmacology, Vol. 66, No. 4, 2003, pp. 623-631. doi:10.1016/S0006-2952(03)00342-3
- Y. Samuels and V. E. Velculescu, “Oncogenic Mutations of PIK3CA in Human Cnacers,” Cell Cycle, Vol. 3, No. 10, 2004, pp. 1221-1224. doi:10.4161/cc.3.10.1164
- R. T. Nitta, C. A. Del Vecchio, A. H. Chu, S. S. Mitra, A. K. Godwin and A. J. Wong, “The Role of the c-Jun NTerminal Kinase 2-α-Isoform in Non-Small Cell Lung Carcinoma Tumorigenesis,” Oncogene, Vol. 30, No. 2, 2011, pp. 234-244. doi:10.1038/onc.2010.414
- G. Xinarianos, T. Liloglou, W. Prime, G. Sourvinos, A. Karachristos, J. R. Gosney, D. A. Spandidos and J. K. Field, “P53 Status Correlates with the Differential Expression of the DNA Mismatch Repair Protein MSH2 in Non-Small Cell Lung Carcinoma,” International Journal of Cancer, Vol. 101 No. 3, 2002, pp. 248-252. doi:10.1002/ijc.10598
- H. Sasaki, K. Okuda, O. Kawano, K. Endo, H. Yukiue, T. Yokoyama, M. Yano and Y. Fujii, “Nras and Kras Mutation in Japanese Lung Cancer Patients: Genotyping Analysis Using LightCycler,” Oncology Reports, Vol. 18, No. 3, 2007, pp. 623-628.
NOTES
1http://cise.sdkd.net.cn/institute/isbbc/data/AGNLC/raw_database.rar
2http://cise.sdkd.net.cn/institute/isbbc/data/AGNLC/working_database.rar