Journal of Sustainable Bioenergy Systems
Vol.4 No.1(2014), Article ID:44247,17 pages DOI:10.4236/jsbs.2014.41004
Evaluation of Cellulose as a Substrate for Hydrocarbon Fuel Production by Ascocoryne sarcoides (NRRL 50072)
Natasha Mallette1,2, Elle M. Pankratz1,2, Albert E. Parker2,3, Gary A. Strobel4, Scott C. Busse5, Ross P. Carlson1,2, Brent M. Peyton1,2
1Department of Chemical and Biological Engineering, Montana State University, Bozeman, USA
2Center for Biofilm Engineering, Montana State University, Bozeman, USA
3Department of Mathematical Sciences, Montana State University, Bozeman, USA
4Department of Plant Sciences and Plant Pathology, Montana State University, Bozeman, USA
5Department of Chemistry and Biochemistry, Montana State University, Bozeman, USA
Email: Bpeyton@coe.montana.edu
Copyright © 2014 by authors and Scientific Research Publishing Inc.
This work is licensed under the Creative Commons Attribution International License (CC BY).
http://creativecommons.org/licenses/by/4.0/


Received 10 December 2013; revised 9 January 2014; accepted 3 February 2014
ABSTRACT
The fungal endophyte, Ascocoryne sarcoides, produced aviation, gasoline and diesel-relevant hydrocarbons when grown on multiple substrates including cellulose as the sole carbon source. Substrate, growth stage, culturing pH, temperature and medium composition were statistically significant factors for the type and quantity of hydrocarbons produced. Gasoline range (C5-C12), aviation range (C8-C16) and diesel range (C9-C36) organics were detected in all cultured media. Numerous non-oxygenated hydrocarbons were produced such as isopentane, 3,3-dimethyl hexane and d-limonene during exponential growth phase. Growth on cellulose at 23˚C and pH 5.8 produced the highest overall yield of fuel range organics (105 mg * g·biomass−1). A change in metabolism was seen in late stationary phase from catabolism of cellulose to potential oxidation of hydrocarbons resulting in the production of more oxygenated compounds with longer carbon chain length and fewer fuel-related compounds. The results outline rational strategies for controlling the composition of the fuel-like compounds by changing culturing parameters.
Keywords:Biofuel; Cellulose; Fungal Hydrocarbons; Filamentous Fungus; Gasoline Fuel

1. Introduction
Many strategies are being explored to replace or supplement petroleum-derived transportation fuels. These include microbial conversion of cellulosic sugars after extensive pretreatment, as well as chemical and thermal conversion technologies [1] . Cellulose and related polymers are the most abundant organic compounds on the planet. In the United States, over 1.3 billion tons of cellulose are available yearly from non-food crop production [2] . When combined with the ability of bacterial and yeast strains to produce biofuel from sugars [3] , these near carbon-neutral feedstocks could support significant biofuel production [4] .
Ascocoryne sarcoides (NRRL 50072) is a cellulolytic fungal endophyte capable of direct conversion of cellulosic materials to fuel-related hydrocarbon compounds such as alkanes, alcohols and aromatics [5] [6] . A. sarcoides was one of the first discovered endophytic fungi with fuel-related compound production in the C5-C10 carbon chain length range. The vision for A. sarcoides, and other organisms like it, is the consolidated conversion of sugars in cellulosic materials into fuel with little pre-treatment. This technology is still in its infancy with current yields far below industrially relevant levels [7] , but with culturing advances, strain refinement and every year the discovery of new organisms with similar biochemical capabilities, the technology is promising [8] -[10] . Therefore, exploring the factors which influence organisms such as A. sarcoides to produce volatile hydrocarbons (VHC) is important.
Microbial utilization of cellulose as a carbon source requires production of cellulase enzymes. Almost 400 cellulase and cellulose-related genes have been identified in the annotated A. sarcoides genome, and the expression of many of these genes has been observed when A. sarcoides was grown on cellobiose and cellulose, but not when grown on a cellulose-free medium [11] . In the related fungus, Aspergillus fumigatus, the production of cellulases in liquid culture is influenced by carbon source, pH, temperature as well as other factors [12] . These environmental factors will also likely impact the production of cellulases and metabolism in A. sarcoides and thus impact VHC synthesis. Studies exploring VHC production as a function of controllable parameters were performed. Research exploring the culturing factors which influence VHC production is of both fundamental and practical importance.
Here we report the results of pH, growth medium, and temperature on fuel-related hydrocarbon production by A. sarcoides by measuring fuel compounds in both the gas and liquid phases. Multiple methods of analyzing VHC were used to identify and quantify the compounds produced. This work demonstrates the potential of A. sarcoides to produce a variety of VHC compounds with fuel potential and provides guidance for efforts being made on other organisms having this capability.
2. Materials and Methods
2.1. Shake Flask Experiments
2.1.1. Culture Medium and Conditions
A. sarcoides (NRRL 50072) was grown in 250 mL baffled flasks or bottles on a minimal cellulose medium (CM) consisting of (per liter): 50 µm microcrystalline cellulose (20 g) (Acros Organics), ammonium chloride (5 g) (Fisher Chemical), NaH2PO4·2H2O (2.75 g) (Fisher Chemical), MgSO4·7H2O (0.86 g) (Fisher Chemical), Ca(NO3)2·4H2O (0.28 g) (Fisher Chemical, yeast extract (0.05 g) (Fisher BioReagents), and trace salts: KCl (60 mg), KNO3 (80 mg), FeCl3 (2 mg), MnCl2 (5 mg), ZnSO4 (2.5 mg), H3BO3 (1.4 mg), and KI (0.7 mg). 100 mmol KH2PO4 was added as a buffer. CM was modified with glucose (Fisher Chemical) in place of cellulose for glucose medium (GM), and with 90,000 average molecular weight sodium carboxymethyl cellulose (CMC) (Sigma Aldrich) in place of cellulose for CMC medium. To test the impact of nutrient limitation, the GM recipe listed above was increased three fold for all components except calcium and magnesium compounds. Initial pH was adjusted to 3.5, 5.0, 5.6 and 6.5 with 2 M NaOH or HCl.
Response surface design is a statistical method that determines the minimum number of experiments necessary to predict the optimal response from a system. Response surface design and analysis have been used for optimization of fungal systems [13] . Based on preliminary biomass data, a response surface design was used to generate a set of new experiments predicted to maximize VHC.
In the experiments using CM and GM, the variables included temperature (13˚C, 16.5˚C, 20˚C, 23˚C and 28˚C), pH (3.5, 4.5, 5, 5.6, 6 and 6.5), oxygen condition (aerobic, sealed batch and anoxic) and nutrient level of the medium (1×, 2×, 2.3× and 3×). The combination of variables was guided by the experimental design. Cultures covered with permeable cloth were considered aerobic; those sealed with stoppers containing ambient air in the headspace were denoted sealed batch; those sparged with N2 then sealed with oxygen impermeable stoppers were denoted anoxic. Cultures were shaken in temperature controlled incubators at 150 rpm. All cultures were inoculated with a 7-day culture prepared with MicrobankTM Bead frozen stocks (−80˚C) and grown in CM with cellulose replaced with 0.5 g cellobiose and 0.45 g yeast extract.
2.1.2. Biomass Analysis
Biomass was determined by cell dry weight as described previously [7] and by a modified Bradford method (Bio-Rad, Hercules, CA). On soluble substrates, fungal growth curves were monitored by optical density at 600 nm with a GENESYS spectrophotometer (Thermo Scientific).
2.1.3. Volatile Hydrocarbon Analysis by Nuclear Magnetic Microscopy
Throughout the growth period, samples of culture liquid were collected ranging from 7 to 14 days for glucose cultures and up to 60 days for sealed cellulose cultures. The liquid samples were centrifuged to remove cells, and the cell-free culture liquid added to a Nuclear Magnetic Microscopy (NMR) tube with 10% deuterium oxide (D2O) by volume. Proton NMR was run on a Bruker DRX600 spectrometer operating at a proton frequency of 600.13 MHz. Data were collected using a 1D Nuclear Overhauser Effect Spectroscopy (NOSEY) experiment with 100 ms mixing time and 2 second presaturation of the water signal. A total of 32,000 data points were collected, with a sweepwidth of 7183.91 Hz. The 64 scans were averaged for each data set with a total recycle time of 4.28 seconds. All data sets were collected with the same receiver gain, so the intensity of the signals could be directly compared.
The data were processed using an exponential window with a 0.5 Hz line broadening and a final size of 16,000 real points. All results were corrected for background with un-inoculated controls. This technique measures signal of protons (H+) on the liquid bound compounds and is therefore quantitative on a molecular level. The signal peaks and areas are grouped based on structure and elemental compositions and compared with control samples. The peak spectra were grouped by aromatics, non-oxygenated hydrocarbons and sugars. Oxygenated hydrocarbons are included in the sugars peak, so cannot be differentiated with this technique. The results are nonspecific as far as carbon length, but can indicate structure (e.g. branching).
2.1.4. Statistical Analysis
Statistical analysis of VHC concentration data from NMR spectra was completed using linear mixed effects (lme) models fit by the lme4 package [14] in the free statistical and graphing program R [15] . Results from three models are reported here; an overall model including both substrates and individual models for each substrate. The fixed effects in the models were the headspace oxygen condition (e.g. anoxic), substrate (cellulose or glucose), and concentration of the medium (e.g. 1×). Two crossed random effects were also in the model, one due to the start date of the experiment, and the other due to the date on which NMR measurements were taken. Covariates in all models were pH, temperature, and age of the culture at the sampling time. Initially all models were fit with all two-way interactions amongst these covariates. Interactions were further investigated by interaction plots and by fitting a separate lme model for each covariate. Statistically significant two-way interactions were included as appropriate in models used for inference. For example, the two-way interaction between pH and culture age was statistically significant for the overall and cellulose models, but not the glucose model. The model fit to VHC data generated with the cellulose medium had the same inputs as the others with some variations. Medium strength was not included, because all experiments were conducted at one medium concentration. In addition, due to nonlinearities, it was necessary to add quadratic terms for each covariate and all two-way interactions. All statistically significant results were reported based on a significance level of α = 0.05.
2.2. Gas-Purged Bioreactors
2.2.1. Culture Medium and Conditions
A. sarcoides (NRRL 50072) was grown in 10 L bottles with 4 L of media CM, GM, both at three fold concentration, and Potato Dextrose Broth (PDB) at 24 g/L. CM and GM were brought to pH 5.8 with 2 M NaOH. Continuous house air supply at 1 L/min passed through the bottle headspace, and the cultures were incubated at 23˚C with shaking at 100 rpm. At the conclusion of the experiments, biomass was determined by cell dry weight as described previously [7] or by a modified Bradford method (Bio-Rad, Hercules, CA) for cellulose substrate.
2.2.2. Volatile Hydrocarbon Collection
The air passing through the bottle headspace was routed with teflon tubing to an external column containing 10 g of CarbotrapTM B and 10 g of CarbotrapTM C (Supelco, Bellefonte, PA)(Booth et al., 2011). CarbotrapTM B collects compounds with a carbon range of C5-C12 and CarbotrapTM C collects compounds from C12-C20. Volatiles were collected on one column from day 5 to day 17 of growth and for cellulose, on another from day 17 to day 32. Volatiles were also collected from un-inoculated controls and subtracted from culture results. CarbotrapTM columns were conditioned before collection as described previously [16] . The combination of multiple materials allowed for collection of volatiles over a large range of carbon compounds. This method concentrated the compounds produced by the culture, allowing greater resolution of products, especially those produced at a low rate [16] .
2.2.3. Volatile Hydrocarbon Analysis by GC-MS
Liquid from the 4 L sparged bioreactor cultures was extracted using the U.S. Environmental Protection Agency (EPA) method 3510. The extracted liquid was analyzed by GC-MS by Pace Analytical Labs (Billings, MT) for gasoline range organics (GRO) by EPA method 8015/8021 and for diesel range organics (DRO) by EPA 8015 modified. Peak areas were used to quantify total DRO and GRO, correcting for un-inoculated controls. DRO and GRO are reported separately from the external column collection and desorption described below.
Volatile compounds collected on the external Carbotrap column were desorbed and analyzed as described previously with only slight modifications [16] . The column was conditioned with a dry purge at 30˚C with ultra-high purity nitrogen for one hour, followed by desorption of the column at 180˚C for one hour at 0.7 L·min−1. The column effluent gas was externally condensed with liquid nitrogen in a solid phase microextraction (SPME) compatible 30 mL vial. The vial was stored frozen or on ice before measurement by SPME GC-MS. In brief, a SPME fiber (divinylbenzene/Carboxen on polydimethylsiloxane by Supelco, Bellefonte, PA) was exposed to the vial headspace while heating to 30˚C for 45 minutes. The fiber was inserted into the injection port of the GC at 240˚C. The GC column temperature was held at 40˚C for 2 minutes, and then ramped to 230˚C at 5˚C·min−1. The relative amount of identified compounds was estimated by comparison with a 4-bromofluorobenzene (BFB) internal standard calibration curve delivered in methanol over the concentration range of 2 - 75 µg·mL−1. The GC was interfaced with a Hewlett Packard 5973 mass spectrometer which was tuned to meet EPA Method 8260 BFB tuning criteria. In addition, the vial headspace was sampled and analyzed. The vial was heated to 30˚C to volatilize components and 50 mL of the headspace was removed and directly injected into the GC.
Data processing was performed with MassHunter Pro B.04.00 and Mass Profiler Pro B.04.00 (Agilent Technologies, Santa Clara, CA). Cross-comparison of spectra across all substrates was completed before compound identification to eliminate errors associated with database searches and identity allocation. Spectra from the uninoculated controls were compared with samples in Mass Profiler Pro to subtract peaks similar to control peaks. The software compared peak spectra with similar retention times, so slight differences in retention time did not impact the results. A fold change of 10,000 was used to report spectra values, though a fold change of 10 gave the same results. The reported mass spectra were compared to library spectra from the National Institute of Standards and Technology (NIST) Standard Reference Database, 2.0 f. A quality match cutoff of 75% reported spectra with 75% or greater similarity with the database spectra. The library match process was repeated and when the library identified multiple compounds as matches for a single compound, manual comparison of the sample spectra determined the final identification. Sample spectra that could not be rectified with the library spectra were considered “unknown” even if the library considered it to have a quality match above 75%. All identified compounds are listed in the NIST Chemistry WebBook terminology [17] .
The quantities of volatiles desorbed from the fiber were calculated from the peak area of the total ion current measured by the mass spectrometer minus the peak area from un-inoculated controls. As previously shown [7] , the fungal VHC and the internal standard do not have the same gas-liquid partitioning, efficiency of adsorption to the fiber, or response in the GC-MS system, so the quantities obtained are therefore estimates. Nevertheless, the use of the internal standard allowed for a relative comparison between samples from the same culture across different time periods.
3. Results and Discussion
Analytical results from liquid and gas-phase measurements are described for both small-scale shake flask studies as well as larger-scale gas-purged bioreactors. Small-scale shake flask cultures permitted a larger matrix of variables to be tested, and analysis using NMR gave VHC results specific to chemical classification. The largerscale gas-purged batch bioreactor experiments were used to expand the knowledge of VHC identities and distributions. These analyses differed from previously reported results based on the experimental and analytical methods used. The results presented here reflect quantitative data not possible with the previous HS-SPME analyses and demonstrate a new technique for reporting HS-SPME GC-MS results using an external Carbotrap collection column as designed by Booth et al. [16] .
3.1. Shake Flask Experiments
3.1.1. Culturing Factors and VHC Production
The culturing environment influenced VHC production by the fungus significantly. Over 130 culture supernatant samples were measured with NMR and the resulting peak areas were analyzed to determine which variables had a statistically significant effect. NMR spectra from a 15-day old culture grown at 20˚C and pH 5 showed distinct VHC peaks between 2 and 1 ppm, while culture-free cellulose medium samples had none (Figure 1). The peak area was proportional to the amount of VHC present. VHC were measured at a pH ranging from 3.5 - 6.5 and at temperatures 13˚C, 20˚C and 28˚C. The NMR technique showed the presence of a distinct resonance in the upfield region indicative of hydrocarbon (VHC) protons. Specifically, the NMR peaks detected showed features consistent with methylene protons of VHC side chains (Figure 1). A limitation of NMR was the oxygenated hydrocarbons, e.g. alcohols and aldehydes were not quantified, because it was not possible to distinguish them from other oxygenated compounds such as the carbohydrate substrates, acids or esters using this technique. Peaks associated with glucose in the un-inoculated medium are included in the peaks between 4 and 3 ppm, while the VHC peaks between 2 and 1 ppm appear after inoculation (Figure 1).
The statistical analysis of the 132 NMR samples showed no statistically significant impact on mean VHC concentration from carbon source alone (glucose and cellulose). Individual models for each medium elucidated further interactions of environmental variables. For CM samples, statistically significant inputs included oxygen condition, pH, temperature and age of the culture. The most important factor was pH. The effect of pH on VHC
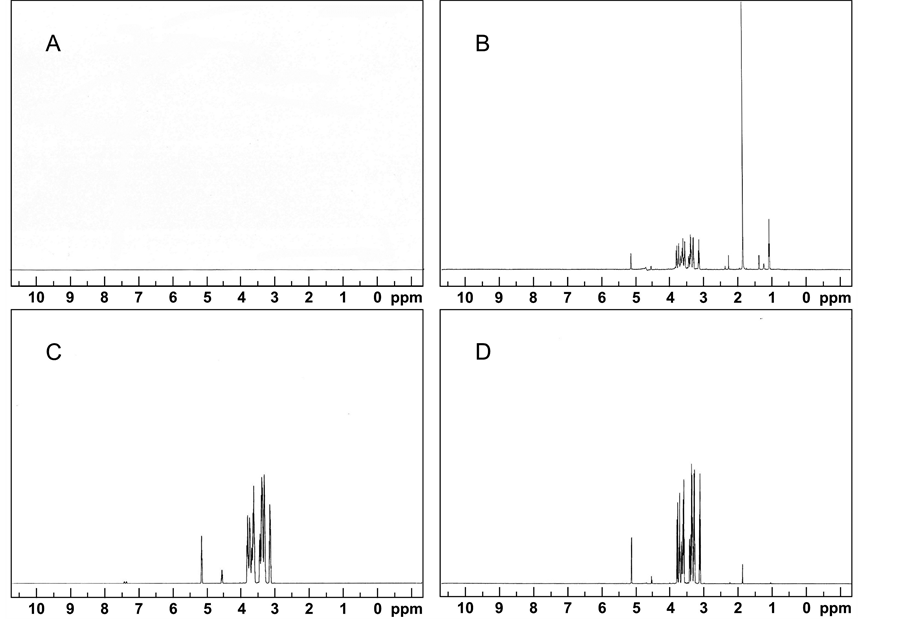
Figure 1. NMR spectra for (A) Cellulose control medium; (B) A. sarcoides culture grown on cellulose medium at 20˚C and at pH 5 for 15 days; (C) Glucose control medium; (D) A. sarcoides culture grown on glucose medium at 20˚C and at pH 5 for 15 days. Peaks between 1 - 2 ppm indicate non-oxygenated hydrocarbons, and peaks between 4 and 5 show sugars from the breakdown of the cellulose substrate and oxygenated products such as acids and alcohols.
production was at least an order of magnitude higher than the other effects (Supplementary Tables S1-S3) (pvalue = 8.26 × 10⁻²⁶). However, the oxygen condition in which the cultures were grown had a significant interaction with pH (p-value = 1.34 × 10⁻³) and therefore, the model predicts different VHC concentration maximums at different pH-oxygen level combinations. The statistical analysis predicted maximum VHC production at a pH of 6.1 for aerobic oxygen conditions and at a pH of 5.1 for both sealed batch and anaerobic oxygen conditions. The maximum VHC near the top of the pH range (3.5 - 6.5) confirmed preliminary observations that at the lower pH levels around 3 or 3.5 growth and metabolic function of A. sarcoides was inhibited. Overall, lower oxygen concentrations indicated higher VHC concentrations (p-values ≤ 1.44 × 10⁻⁴).
Analysis of the GM samples showed there was a statistically significant impact on mean VHC production based on nutrient levels in the media (p-value: 0.036). As the medium concentration (e.g. 1× and 2×) increased, the VHC concentrations decreased. Other variables did not show a statistically significant impact on VHC production after accounting for all other environmental effects for the GM grown cultures (p-value ≥ 0.16). This could be due to the smaller number of samples processed for GM versus CM. For either medium, explicit regression equations can be used to predict VHC levels under specific conditions (Tables S1-S3).
Building on these results, larger scale batch bioreactor experiments were conducted to compare volatile and liquid VHC production on three different substrates at 23˚C, a starting pH of 5.8, and continuous flow of gas through headspace. In addition, the culture age impact seen for the CM cultures was explored by sampling at two distinct time periods (Section 3.2).
3.1.2. Environmental Factors for Growth
Medium substrate and headspace oxygen concentration were important factors for the growth rate of A. sarcoides. Growth rates and final biomass concentrations were calculated for CMC and GM in aerobic conditions and for CM, CMC, and GM in sealed batch conditions (data not shown). Lower oxygen values in sealed batch cultures resulted in slower specific growth rates on CMC (0.038 ± 0.006 hr−1 versus 0.026 ± 0.001 hr−1), but not on GM (both ~0.02 hr−1) which had a similar rate to CM (0.017 ± 0.01 hr−1). However, despite comparable growth rates, a higher final biomass concentration on GM (0.871 ± 0.033 g·L−1) was reached with sealed batch conditions as compared to 0.503 ± 0.009 g·L−1 under aerobic conditions. Growth on CM achieved maximum biomass (0.797 ± 0.062 g·L−1) under aerobic conditions.
3.2. Gas-Purged Bioreactors
3.2.1. Substrate Effect
Substrate had a marked impact on VHC production type and frequency in the gas-purged bioreactors. Growth on cellulose (CM) and potato dextrose broth (PDB) showed more than twice the number of compounds as growth on glucose (GM). This is not surprising due to the differences in initial substrate complexity. CM showed increased product diversity from GM, with 50 compounds distinct from GM, and 16 in common with PDB, indicating the diverse metabolic capability of the organism to produce different compounds on complex substrates (Figure 2). The majority of compounds produced on GM were also produced on either PDB or CM. The greatest number of hydrocarbons at 66 was produced on the undefined substrate, PDB (Figure 2 and Supplementary Table S4).
After compound identification by GC-MS (64 of the 114 compounds were identifiable based on a conservative quality match cutoff of 75%), the compounds were sorted into classes based on structure: alkane, alkene, aldehyde, ketone, aromatic, alcohol, acid, and ester. Compounds with non-aromatic ring structures were classified based on bonding in the ring (e.g. a double carbon bond was put in the alkene class). Comparing the results from days 5-17 (See Section 3.2.2 for discussion on multiple cellulose time points), Figure 3 shows PDB cultures had a total of 37 compounds which could be identified; CM had a total of 35 and GM, 17. CM and PDB cultures had high numbers of compounds in all classes except alkene (which had low numbers for every substrate). There was similar production of alkanes, alkenes, and ketones from growth on PDB and CM. Growth on CM showed the only detected aldehyde compounds and had higher production of acids and alcohols than either PDB or GM. Growth on PDB had the highest number of aromatics (14 vs 6) for CM growth and 2 for GM growth. VHC production from CM as compared to GM showed greater numbers of almost all chemical classes at day 17 including aromatic compounds, 6 vs 2, and alkanes, 8 vs 5. The only exception to this observation was one more alkene identified from growth on GM. The compound classes produced by all three substrates with the

Figure 2. (A) VENN diagram of VHC product similarity based on media type. Cultures were grown at room temperature and 1 L∙min−1 air flow. All VHCs were collected between 5-17 days of growth; (B) VENN diagram of VHC product similarity based on age of cellulose growth for 5-17 days of growth and 17-32 days of growth.
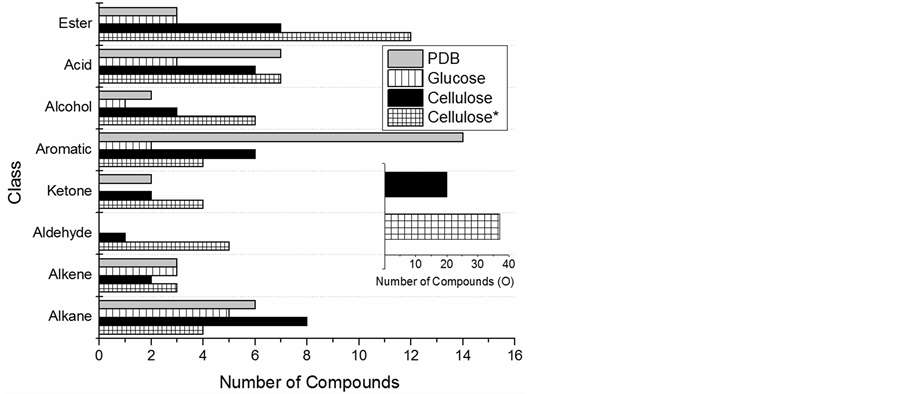
Figure 3. Compound diversity by class for hydrocarbon compounds produced by A. sarcoides on three substrates from day 5- 17 of growth. Cellulose* = 17-32 days of growth. Inset: Total number of compounds containing the element oxygen for the cellulose substrate.
largest diversity were the aromatics and esters (Figure 3). Overall, the greatest diversity of compounds in every class except aromatics was produced with cellulose as the growth substrate.
The quantity of VHC being produced is crucial to evaluating cellulose as an appropriate substrate for fuel production. Looking at the overall modest yields of fuel-range organic VHC in Table 1, the highest yields of VHC in the liquid cultures were diesel range organics (DRO), with a maximum at 45 mg * g·biomass−1 from CM while GM and PDB grown cultures were much lower at 8.6 mg * g·biomass−1 and 1.8 mg * g·biomass−1, respectively. The gasoline range organics (GRO) showed an opposite trend, with glucose at 1.08 mg * g·biomass−1, with an order of magnitude lower result for the cellulose at 0.12 mg * g·biomass−1. Interestingly, the PDB culture had low yield results for both GRO and DRO, though PDB was the substrate from which the production of valuable VHCs was first determined [18] . The greater DRO (C9-C36) yield compared with the more volatile GRO (C5-C12) (Table 1) for all cultures is an indication of the way the cultures were grown and does not capture the GRO potential of a culture grown with a sealed headspace environment. The total weights of VHC adsorbed onto the external column are given, normalized to biomass concentration, in Table1 When the VHC recovered from the liquid and gas phases were added, the yield of VHC from growth on CM was higher per gram biomass than from growth on GM or PDB. This is an important indication that A. sarcoides can more effectively utilize cellulose over simpler carbon sources for VHC production. These results when combined with the shake flask

Table 1 . Yield of fuel-range organic VHC from A. sarcoides in two phases. Gasoline Range Organics (GRO) and Diesel Range Organics (DRO) were liquid (l) bound products from growth of A. sarcoides on three substrates, which volatile hydrocarbons (VHC) were desorbed from external column collecting from the culture headspace gas (g). Cultures were grown at room temperature and aerobically with 1 liter/min air flow. Concentration measured by extraction and normalized to volume or grams of biomass in the liquid culture. CM harvested at 32 days; GM and PDB harvested at 17 days.
experiments imply that the total VHC potential of A. sarcoides was underestimated by the NMR technique that did not quantify oxygenated VHC.
The total fuel-range VHC production yields shown in Table 1 also indicate cellulose as the most efficient of the tested substrates with a total yield of 105 mg of fuel-range organic VHC per g biomass, while the results for GM and PDB were respectively 24 and 9 mg of fuel-range organic VHC per g biomass. The total amounts of VHC collected from the liquid extractions were modest (<20 mg/L) for all substrates with a maximum of 16.9 mg/L on GM, and the highest yield of VHC collected from the headspace was 60.2 mg per mg biomass. Other strains such as Hypoxylon sp. have shown potential for higher yields of VHCs [19] , so this study also elucidates methods that can be applied to characterize the hydrocarbon production of other fungal strains. Overall, the substrate and product data indicate that diverse metabolic pathways may be used by A. sarcoides for different substrates.
3.2.2. Culture Age Effect
Two time points from the 4 L gas-sparged bioreactor cellulose culture were taken to assess the importance of culture age on VHC production. Significant changes were seen in the VHC composition between the two time points. The number of compounds detected was nearly constant before (60 total) and after day 17 (61 total) (Figure 2(B)). However, the type of compounds varied widely, with more unique compounds detected than similar ones: 23 compounds were consistent between time periods, with 37 being unique to days 5-17, and 38 unique to days 17-32.
Of the identifiable compounds, there was a large change in speciation of the VHC produced for the different time periods. Figure 3 shows that after day 17, corresponding to late stationary phase of growth, there was a shift from aromatic and alkane production to more oxygenated compounds as represented by the ester, ketone, aldehyde and alcohol classes. The number of aromatic compounds detected decreased from 6 to 4, and the number of alkane compounds decreased from 8 to 4, while the ester compounds increased from 7 to 12 and the aldehydes increased from 1 to 5 compounds. This resulted in a large increase in the total number of oxygenated compounds (Figure 3 inset) from 20 to 37 after day 17. The shift indicated there was a change in the metabolism of A. sarcoides near or during stationary phase which caused the unique speciation of compounds produced. During the increase in oxygenated compound production from days 17-32, there were many different esters, aldehydes and alcohols detected. Aldehydes produced in stationary phase had increased carbon chain length, ranging from C7-C11, while the only aldehyde produced during the first time period, butanal, 3-methyl-, was a C5 (Table S4). In addition, the longest chained esters, C15 and C16, were produced during the second time period (Figure 4). In contrast, four unique alcohols, C5 and C6, were detected after stationary phase; shorter as a whole than the alcohols of first time period: C5, C8, and C10. The total number of acids changed negligibly with age, and the same acids were produced in both time periods with only a few exceptions. Butanoic acid, 3-methyl-, C5, was only detected from days 5-17. Hexanoic acid (C6) and the longest carbon chain acid at C12, 5-decen-1-ol, acetate, were only observed from days 17-32.
A possible metabolism change in stationary phase is the oxidation of non-oxygenated VHC to gain electrons. For example, 2-heptanone, 6-methylwas only present during the second time period and could have been oxidized from the alkene, 1-heptene, 6-methyl- (Table S4). Another compound only present during the second time period, 1-butanol, 3-methyl-, could have resulted from the oxidation of butane, 2-methylthrough the aldehyde intermediate butanal, 3-methyl-, also present during the first time period (Table S4). This potential conversion is consistent with biochemical oxidation of an alkane to an alcohol through an aldehyde intermediate. Further work is needed to track individual compounds through the entire growth cycle.
3.2.3. Identified VHC with Fuel Potential
Many of the compounds identified in the gas-purged bioreactors have fuel potential, such as hexane, 3-methyland cyclopropane, propyl- (Table S4). Table 2 lists some non-oxygenated compounds along with information on chemical properties. The non-oxygenated compounds for which enthalpy of combustion values (ΔHcomb) were available included four isoparaffins, two olefins, and two aromatic compounds. The compounds’ carbon lengths ranged from C5-C12 and boiling points from 28˚C to 216˚C. The boiling point for all compounds falls
Table 2 . Octane ratings and enthalpies of combustion (ΔHcomb) for select non-oxygenated fuel compounds found from growth on cellulose which fit the carbon chain length and boiling point (Tb) requirements for gasoline fuel. The C8 and higher compounds also could be applied to aviation fuel. All compounds were identified by GC-MS.
a. Octane ratings are the average of Motor Octane Number and Research Octane Number [24] . b. Boiling points measured at 760 torr and enthalpies measured at standard conditions. Source for boiling points and enthalpies from Yaws’ Handbook [25] . c. N/A = no value available.

Figure 4. Identified VHCs produced by A. sarcoides on cellulose grouped based on carbon chain length and sorted by class. Vertical lines denote the carbon chain length range including gasoline (C5-C12) and aviation fuel (C8-C16).
within the boiling point requirement (25˚C - 230˚C) and carbon chain length range, C5-C12, for gasoline fuel, while the majority fit the boiling point requirement (126˚C - 287˚C) and carbon chain length, C8-C16, for aviation fuel (Figure 4) [20] [21] . Only 7% (4 out of 61 total) of the compounds identified were outside of these ranges. In addition, A. sarcoides produced 38 unidentified compounds which were most likely of similar carbon length based on NIST MS spectra matches. However, these compounds did not meet the conservative 75% quality match cutoff, so identifications were not reported.
Aviation fuel is composed of 70% - 85% paraffins including isoparaffins, cycloparaffins and naphthenes [22] . In general, 50% or more of refined naptha, the fraction used for commercial gasoline, is composed of paraffins including isoparaffins [23] . The isoparaffins in Table 2 have the highest enthalpies of combustion by class with undecane, 3-methylat 7528 kJ·mol−1 and nonane, 4,5-dimethylat 6916 kJ·mol−1 and also the lowest octane ratings, a standard indicator of fuel combustion properties. The lowest octane rating at −40 comes from the paraffin, dodecane, with the highest enthalpy of combustion at 7530 kJ·mol−1. Since paraffins including isoparaffins compose such a large fraction of commercial gasoline, a negative or low octane rating does not preclude the use of a compound in a fuel mixture. The aromatic compounds have the highest octane ratings by class with benzene, 1,2,4,5-tetramethyland d-limonene at 104.
In addition, other non-oxygenated compounds were observed for which boiling points, octane ratings and/or enthalpies of combustion were not readily available in the literature: 1,3-hexadiene, 3-ethyl-2-methyl-; cyclohexane, propylidene-; and 1,5-cyclooctadiene, 1,5-dimethyl- (an olefin, a cycloparaffin, and a cyclo-olefin, respectively). However, these compounds have the correct carbon chain length and branching properties for gasoline fuel. Compounds produced which were more suited for kerosene or diesel fuel included an isoparaffin: dodecane, 2,6,10-trimethylat a boiling point of 253˚C and a paraffin: nonadecane at 330˚C.
The compounds with fuel potential in Table S4 also include numerous oxygenated compounds, such as alcohols, ketones and aromatics which can be further refined for use in fuel blends. It is clear that A. sarcoides produces compounds with gasoline fuel potential using cellulose as a feedstock (Table 2). The high numbers of alkanes and aromatics produced by A. sarcoides indicate that if overall yields can be significantly improved, refinement of the produced mixture could result in a high-octane fuel.
4. Conclusion
The diverse metabolic capability of A. sarcoides to utilize multiple carbon sources to produce gasoline, diesel and aviation range organics was demonstrated. The use of multiple analytical methods to assess VHC production by A. sarcoides cultures in both the liquid and gas phases yielded information on the type and quantities of VHC produced. Statistically significant differences in VHC production was observed with carbon source, oxygen concentration, pH and temperature of the culture indicating the potential to further optimize production by varying process and growth parameters. Gasoline range (C5-C12), aviation range (C8-C16), and diesel range (C9-C36) organics were detected in all cultured media. Among multiple substrates, the highest levels of recovered VHCs were measured from growth on cellulose at a pH of 5.8˚C and 23˚C, and the highest level of biomass was predicted at pH 5.6˚C and 20˚C. Cellulose stood out as the preferable substrate for VHC production and fuel-related compounds based on the relatively inexpensive substrate and the quantity and variety of fuel compounds produced. There was a pronounced shift to more oxygenated compounds, longer carbon chain length, and fewer fuel-related VHCs as the cellulose culture progressed in stationary phase indicative of a change in carbon metabolism. Therefore, future refinement of production mechanisms by A. sarcoides and other similar fungi is warranted to increase VHC yields for renewable production of liquid fuel compounds.
Acknowledgements
The authors would like to thank the National Science Foundation, Emerging Frontiers in Research and Innovation #093761 for funding this research. The NMR data was collected by the help of by COBRE award P20 RR024237 from the National Center for Research Resources (NCRR), a component of the National Institutes of Health (NIH), but the conclusions from these data are solely the responsibility of the authors and do not necessarily represent the official view of NCRR or NIH. Our appreciation goes to Eric Booth for training on thermal desorption, to Dr. W. Berk Knighton for advice on analytical chemistry techniques, to Isabel M. Holtmeyer for proofreading and positive feedback, and to Heidi Schoen for Figure 3 preparation assistance. Additional thanks to the research groups of Drs. Brent Peyton and Ross Carlson.
References
- Carroll, A. and Somerville, C. (2009) Cellulosic Biofuels. Annual Review of Plant Biology, 60, 165-182. http://dx.doi.org/10.1146/annurev.arplant.043008.092125
- Perlack, R.D., Wright, L.L., Turhollow, A.F., Graham, R.L., Stokes, B.J. and Erbach, D.C. (2005) Biomass as Feedstock for a Bioenergy and Bioproducts Industry: The Technical Feasibility of a Billion-Ton Annual Feedstock Supply. Oak Ridge National Laboratory /USDOE/USDA, Oak Ridge. http://dx.doi.org/10.2172/885984
- Dien, B.S., Cotta, M.A. and Jeffries, T.W. (2003) Bacteria Engineered for Fuel Ethanol Production: Current Status. Applied Microbiology and Biotechnology, 63, 258-266. http://dx.doi.org/10.1007/s00253-003-1444-y
- Ragauskas, A.J., Williams, C.K., Davison, B.H., Britovsek, G., Cairney, J., Eckert, C.A., et al. (2006) The Path Forward for Biofuels and Biomaterials. Science, 311, 484-489. http://dx.doi.org/10.1126/science.1114736
- Strobel, G.A., Knighton, B., Kluck, K., Ren, Y., Livinghouse, T., Griffin, M., et al. (2008) The Production of MycoDiesel Hydrocarbons and Their Derivatives by the Endophytic Fungus Gliocladium roseum (NRRL 50072). Microbiology, 154, 3319-3328. http://dx.doi.org/10.1099/mic.0.2008/022186-0
- Griffin, M.A., Spakowicz, D.J., Gianoulis, T.A. and Strobel, S.A. (2010) Volatile Organic Compound Production by Organisms in the Genus Ascocoryne and a Re-Evaluation of Myco-Diesel Production by NRRL 50072. Microbiology, 156, 3814-3829. http://dx.doi.org/10.1099/mic.0.041327-0
- Mallette, N.D., Knighton, W.B., Strobel, G.A., Carlson, R.P., Peyton, B.M. (2012) Resolution of Volatile Fuel Compound Profiles from Ascocoryne Sarcoides: A Comparison by Proton Transfer Reaction-Mass Spectrometry and Solid Phase Microextraction Gas Chromatography-Mass Spectrometry. AMB Express, 2, 23. http://dx.doi.org/10.1186/2191-0855-2-23
- Mends, M.T., Yu, E., Strobel, G.A., Riyaz-Ul-Hassan, S., Booth, E., Geary, B., et al. (2012) An Endophytic Nodulisporium sp. Producing Volatile Organic Compounds Having Bioactivity and Fuel Potential. Journal of Petroleum & Environmental Biotechnology, 3. http://dx.doi.org/10.4172/2157-7463.1000117
- Morath, S.U., Hung, R. and Bennett, J.W. (2012) Fungal Volatile Organic Compounds: A Review with Emphasis on Their Biotechnological Potential. Fungal Biology Reviews, 26, 73-83. http://dx.doi.org/10.1016/j.fbr.2012.07.001
- Yuan, Z.-L., Chen, Y.-C., Xu, B.-G. and Zhang, C.-L. (2012) Current Perspectives on the Volatile-Producing Fungal Endophytes. Critical Reviews in Biotechnology, 32, 363-373. http://dx.doi.org/10.3109/07388551.2011.651429
- Gianoulis, T.A., Griffin, M.A., Spakowicz, D.J., Dunican, B.F., Alpha, C.J., Sboner, A., et al. (2012) Genomic Analysis of the Hydrocarbon-Producing, Cellulolytic, Endophytic Fungus Ascocoryne sarcoides. PLOS Genetics, 8, Article ID: e1002558. http://dx.doi.org/10.1371/journal.pgen.1002558
- Stewart, J.C. and Parry, J.B. (1981) Factors Influencing the Production of Cellulase by Aspergillus fumigatus (Fresenius). Journal of General Microbiology, 125, 33-39. http://dx.doi.org/10.1099/00221287-125-1-33
- Dagbagli, S. and Goksungur, Y. (2008) Optimization of Beta-Galactosidase Production Using Kluyveromyces lactis NRRL Y-8279 by Response Surface Methodology. Electronic Journal of Biotechnology, 11. http://dx.doi.org/10.2225/vol11-issue4-fulltext-12
- Bates, D., Maechler, M. and Bolker, B. (2013) lme4: Linear Mixed-Effects Models Using S4 Classes. R Package Version 0.999999-2.
- R Core Team (2013) R: A Language and Environment for Statistical Computing. R Foundation for Statistical Computing, Vienna.
- Booth, E., Strobel, G., Knighton, B., Sears, J., Geary, B. and Avci, R. (2011) A Rapid Column Technique for Trapping and Collecting of Volatile Fungal Hydrocarbons and Hydrocarbon Derivatives. Biotechnology Letters, 33, 1963-1972.http://dx.doi.org/10.1007/s10529-011-0660-2
- Linstrom, P.J. and Mallard, W.G. (2011) NIST Chemistry WebBook. NIST Standard Reference Database Number 69, National Institute of Standards and Technology, Gaithersburg.
- Stinson, M., Ezra, D., Hess, W.M., Sears, J. and Strobel, G. (2003) An endophytic Gliocladium sp. of Eucryphia Cordifolia Producing Selective Volatile Antimicrobial Compounds. Plant Science, 165, 913-922. http://dx.doi.org/10.1016/S0168-9452(03)00299-1
- Ul-Hassan, S.R., Strobel, G.A., Booth, E., Knighton, B., Floerchinger, C. and Sears, J. (2012) Modulation of Volatile Organic Compound Formation in the Mycodiesel-Producing Endophyte Hypoxylon sp. CI-4. Microbiology, 158, 465473. http://dx.doi.org/10.1099/mic.0.054643-0
- Speight, J.G. (2002) Handbook of Petroleum Product Analysis—Knovel. John Wiley & Sons, Inc., Hoboken.
- Yoon, S.H. and Lee, C.S. (2012) Effect of Undiluted Bioethanol on Combustion and Emissions Reduction in a Si Engine at Various Charge Air Conditions. Fuel, 97, 887-890. http://dx.doi.org/10.1016/j.fuel.2012.02.001
- Blakey, S., Rye, L. and Wilson, C.W. (2011) Aviation Gas Turbine Alternative Fuels: A Review. Proceedings of the Combustion Institute, Proceedings of the Combustion Institute, 33, 2863-2885. http://dx.doi.org/10.1016/j.proci.2010.09.011
- Ciapetta, F.G. and Wallace, D.N. (1972) Catalytic Naphtha Reforming. Catalysis Reviews, 5, 67-158. http://dx.doi.org/10.1080/01614947208076866
- Ghosh, P., Hickey, K.J. and Jaffe, S.B. (2005) Development of a Detailed Gasoline Composition-Based Octane Model. Industrial & Engineering Chemistry Research, 45, 337-345. http://dx.doi.org/10.1021/ie050811h
Supplementary Tables
Table S1. A summary of the statistical analysis output of explicit regression equations for overall model using all samples after modeling VHC using R [15] .1
Table S2. A summary of the statistical analysis output of explicit regression equations for cellulose model after modeling VHC using R [15] .1
Table S3. A summary of the statistical analysis output of explicit regression equations for glucose model after modeling VHC using R [15] .1
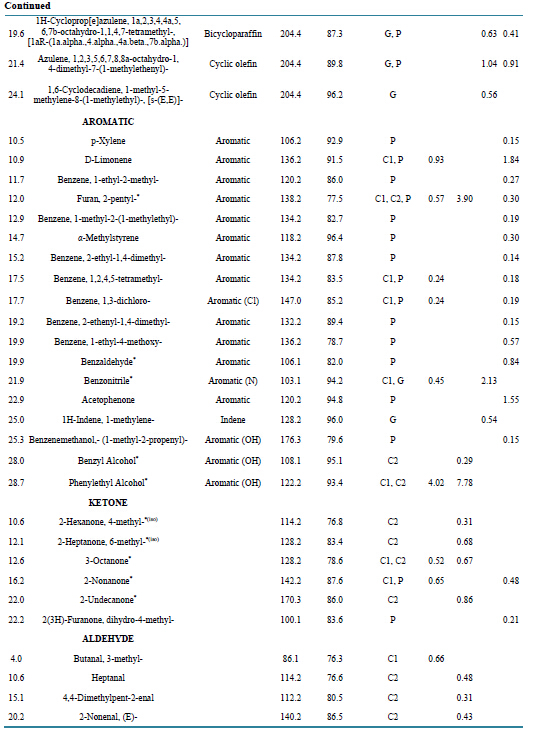
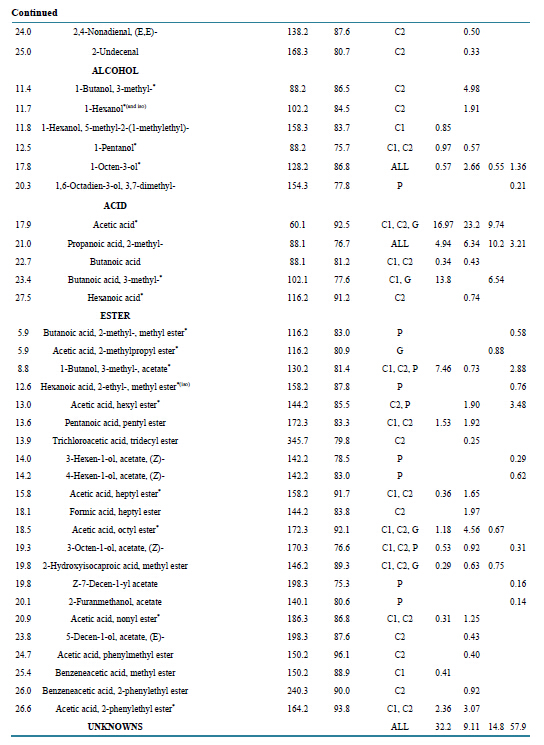
Table S4. Identified compounds produced by A. sarcoides on three substrates: CM (cellulose), GM (glucose) and PDB (potato dextrose broth. Samples were measured by HS-SPME GC/MS. Manual matching of spectra to the NIST library was assisted by a 75% quality match cutoff. MW indicates the molecular weight of the compound. Presence of the compound from the headspace of the culture is abbreviated in the Media Present column to C1 C2 for CM at two different time points, G for GM, and P for PDB media. An empty cell indicates the compound was not detected. *VHC compounds detected previously from A. sarcoides; (iso) = isomer detected [5] -[7] [18] .
1. In Tables S1-S3, the superscript F indicates that the variable is included in the regression model as a categorical factor. In Table 2, the factor CarbonSource has two levels, cellulose and glucose. In Tables S2 and S3, the factor O2 has three levels aerobic, anaerobic, and sealed batch. Tables S1-S3 describe a regression equation that can be used to predict VHC based on the predictors in the model. To illustrate, the regression equation described by Table S1 is:
VHC = 15.36 + 35.81ICarbon = Glucose + 221.9IO2 = Anaeoboc + 396.4IO2 = Sealed Batch − 126.8Conc − 23.11Temp + 165.6pH + 2.88Age.
The notation I denotes an indicator function, where I = 1 if the condition specified in the subscript is met; and I = 0 otherwise. For example, when Ascocoryne sarcoides is grown on cellulose; under anaerobic conditions and a medium concentration of 2×; at a temperature of 30 degrees C, pH = 7; and aged for 5 days; then the regression equation predicts that the VHC production of A. sarcoides is:
VHC = 15.36 + 221.9(1) − 126.8(2) − 23.11(30) + 165.6(7) + 2.88(5) = 463.96 (total area as measured by NMR).