American Journal of Analytical Chemistry
Vol.5 No.13(2014), Article ID:49873,13 pages
DOI:10.4236/ajac.2014.513093
Copper and Mercury in Food, Biological and Pharmaceutical Samples: Spectrophotometric Estimation as Cu(DDTC)2
Mohammad Nasir Uddin*, Nur Mostaq Shah, Mohammad Amzad Hossain, Md. Muzahidul Islam
Department of Chemistry, University of Chittagong, Chittagong, Bangladesh
Email: *nasircu72@gmail.com
Copyright © 2014 by authors and Scientific Research Publishing Inc.
This work is licensed under the Creative Commons Attribution International License (CC BY).
http://creativecommons.org/licenses/by/4.0/


Received 6 July 2014; revised 23 August 2014; accepted 7 September 2014
ABSTRACT
An alternative spectrophotometric method was optimized and validated for the estimation of mercury using diethyldithiocarbamate (DDTC), a common reagent, widely used for the preconcentration and isolation of metal ions in complex matrices followed by their estimation by varied techniques. Diethyldithiocarbamate forms yellow Cu(DDTC)2 with copper and white Hg(DDTC)2 with mercury (having d10 system) which are extracted in CCl4. The UV-visible spectrum of Cu(DDTC)2 is very stable at pH 5.0 and has a maximum absorption (λmax) at 435 nm. Hg(DDTC)2 is more stable than Cu(DDTC)2. Estimation of mercury is based on a quantitative displacement of Cu(II) of Cu(DDTC)2 with the addition of mercury followed by the measurement of reduced absorbance. Primarily, method was optimized and validated for the estimation of copper. Therefore, simultaneous determination of Cu(II) and Hg(II) in mixture is proposed fractionating the extract. The molar specific coefficient (ε) for the mercury was 1.4 × 10⁴ mol−1∙L∙cm−1 and for copper was 3.16 × 10⁵ mol−1∙L∙cm−1 at 435 nm. The detection limits of Cu2+ and Hg2+ were 0.023 µg∙mL−1 and 0.029 µg∙mL−1, respectively. The calibration curve shows good linearity of 0.02 - 12.0 and 0.02 - 15.0 µg∙mL−1 for the Cu2+ and Hg2+ determination, respectively. Proposed technique was applied to food, biological and pharmaceutical samples for the determination of Cu(II) and Hg(II).
Keywords:Copper, Mercury, Diethyldithiocarbamate, Spectrophotometric Method, Food, Biological, Pharmaceutical Samples

1. Introduction
A variety of metals could enter industrial wastewaters as a result of anthropogenic activity. Due to corrosion and geological factors some metal ions in complex form being environmental contaminants could also be present in drinking waters and natural water bodies. By the biological cycle, some of them through the food chain pass into plants, animals and man, thus affecting them negatively. Copper is one of the important and essential nutrients for human health as well as the growth of animals and plants [1] [2] . Although copper is an essential micronutrient and is required by the body in very small amounts, excess copper in the human body can cause stomach and intestinal distress such as nausea, vomiting, diarrhea, and stomach cramps. People with Wilson’s disease, a rare genetic disorder, are more sensitive to the effects of copper [1] [2] . Mercury and its compounds are also used in medicine. Merbromin (Mercurochrome) is a topical antiseptic used for minor cuts and scrapes is still in use in some countries. It is used as a preservative in laboratory reagents and related chemicals. Mercury is used in dental amalgam. Mercury is a heavy metal which is much toxic for human health. It causes many harmful diseases when absorbed by human body. Mercury can be inhaled and absorbed through the skin and mucous membranes. The chief sources of mercury pollution are chlor-alkali plants, paper, pulp, cellulose and plastic industries, electrical, paint, pharmaceutical industries, etc. Uses of mercury as fungicides, pesticides, etc., also add mercury to the environment. Compounds of mercury consumed in fish, cereals and other food stuffs have resulted in numerous poisoning [1] -[3] .
Therefore, trace and ultra-trace determination of copper [4] [5] and mercury [6] [7] is of great importance. Atomic absorption spectroscopy (AAS) and inductively coupled plasma-atomic emission spectroscopy (ICP-AES) have been the method of choice for the elemental analysis because of their utility, sensitivity and reliability. Cold vapor atomic fluorescence spectrometry [8] as well as catalytic or electro-analytical [9] procedure has been more often used for mercury determination. These methods can rapidly determine metals in trace amounts in many types of matrices. Although these techniques are reliable and sensitive, they suffer from the limitations of being rather costly (considering instrument acquisition and maintenance), time-consuming (with respect to sample preparation), and not always readily available. Contrary, in laboratories of developing countries like us the choice of any analytical methods depends on the availability of reagents, cost effectiveness of instruments and the time required for analysis as well as safety and ease of operation. UV-visible spectroscopy is a well-established analytical technique with mature methods and equipment. UV-visible spectrophotometry is more sensitive technique widely used in inorganic trace analysis. It is commonly used in both research and science as well as in industry.
A number of spectrophotometric reagents as chloro (phenyl) glyoxime [3] , 2,5-dimercapto-1,3,4-thiadiazole [10] , thiosemicarbazone [11] , 3-methoxy-4-hydroxy benzaldehyde-4-bromophenyl hydrazine [12] and so on are reported for copper determination. Mercury being a non-transition element, a sensitive colourful reagent is required for the spectrophotometric determination which is rare available. A few have been reported for the mercury determination like diacetylmonoxime isonicotinoylhydrazone [13] , diphenylthiocarbazone [14] . One of the most common reagents, diethyldithiocarbamate (DDTC) is used for spectrophotometric determination of transition elements Cu(II), Ni(II), Mn(II), Pb(II) and V(V) [15] [16] . Hg(II) gives white insoluble complex, Hg(DDTC)2 which is more stable than the Cu(DDTC)2. Primarily, a spectrophotometric method was aimed to be optimized and validated for the estimation of copper. Mercury can be determined by a quantitative displacement Cu(II) with the addition of additional mercury followed by the extraction of remaining of Cu(DDTC)2 in a carbon tetrachloride. The reduced absorbance is measured subsequently which is equivalent to mercury. Finally, the aim of this research is to develop a rapid spectrophotometric method for the determination of mercury and copper with DDTC which has not previously been used for their simultaneous determination.
2. Experimental
2.1. Chemicals and Reagents
High-purity carbontetrachloride, various acids, salts and reagent grade Na-DDTC (Merck) were used. The standard stock solutions (1000 μg∙mL−1) were prepared by dissolving appropriate amount of each salt in water. Solutions of a large number of inorganic ions and complexing agents were prepared from their analytical grade or equivalent grade and water soluble salts. Doubly distilled deionized water, which is non-absorbent under ultraviolet radiation, was used throughout. Suitable portions of the solutions were mixed to get the desired pH. Stock solutions and environmental water samples (1000-mL each) were kept in polypropylene bottles containing 1-mL of concentrated HNO3.
2.2. Synthesis of Complex, [Cu(en)2][Hg(SCN)4]
Complex, [Cu(en)2][Hg(SCN)4], was synthesized according to the procedure described in literature [17] and was analyzed for the metal analysis as certified substance.
2.3. Instrumentation
A Shimadzu UV Visible UV-1800 spectrophotometer model with suitable settings equipped with 1-cm quartz cells was used for absorbance. The spectral band length was 1 nm, the wavelength accuracy was 0.5 nm with automatic wavelength correction and the recorder was a computer-controlled in the wavelength range 350 - 600 nm. A Jenway (England, U.K) (Model-30100) pH meter were used for the measurements of pH. A Varian (Australia) AAS spectrophotometer was used for comparing the results.
2.4. Preparation of Standards
A 0.1% (5.84 × 10⁻³ M) stock solution of Na-DDTC was prepared by dissolving 0.1 g sodium diethyldithiocarbamate reagent in approximately 80 ml water heated at 60˚C. Afterwards, the volume was made up to 100 ml by adding distilled water in volumetric flask and filtered. A stock solution (100 μg∙mL−1) of copper or mercury was prepared by dissolving appropriate amount of copper sulphate pentahydrate or mercuric chloride (Merck, Germany) in 250 mL of doubly distilled deionized water. The working standards were prepared by suitable dilutions of this stock solution. The buffer solutions were prepared by mixing 1 mol∙L−1 HCl and 1 mol∙L−1 sodium acetate (pH 1 - 3), 0.2 mol∙L−1 acetic acid and 0.2 mol∙L−1 sodium acetate (pH 3.2 - 6.0), 1 mol∙L−1 sodium acetate and 0.2 mol∙L−1 acetic acid (pH-7.0) and 2 mol∙L−1 ammonium hydroxide and 2 mol∙L−1 ammonium chloride (pH 8.0 - 12.0). Suitable portions of these solutions were mixed to get the desired pH. A 100 ml stock solution of tartrate (0.25 mol∙L−1) or ammonium thiocyanate (0.4 mol∙L−1) was prepared by dissolving 7.055 g of A.C.S grade (99%) potassium sodium tartrate tetrahydrate or 3.0428 g of solid ammonium thiocyanate in deionized water. A 100 ml solution of dilute ammonium hydroxide was prepared by diluting 10 ml concentrated NH4OH (28% - 30% A.C.S grade) to 100 ml with deionized water. A 100 ml stock solution of EDTA (4000 μg∙mL−1) was prepared by dissolving 0.4 g of A.C.S grade (>90%) dehydrated disodium salt of ethylenediaminetetraacetic acid in 100 ml deionized water. Stock solutions were stored at 4˚C, protected from light and were used within three months.
2.5. Biological Sample Collection
Blood and urine samples were kindly provided from Chittagong Medical College Hospital, Chittagong. Both urine and whole blood samples were collected into EDTA-anticoagulated polypropylene tubes. Blood specimens were refrigerated then aliquoted within two hours into cryovials immediately frozen and shipped on dry ice. All blood samples were stored frozen at or lower than −20˚C until analyzed. Metal caps or metal-based containers, colored containers should be avoided.
2.6. General Procedure
To determine mercury and copper simultaneously, a mixture (1:1) 10 μg∙mL−1 solution of (various volume) Hg(II) and Cu(II) was placed in a 25-mL separating flask along with 0.5 ml 0.05 M H2SO4, and 5 ml of the reagent 1000 μg∙mL−1 DDTC solution. Its volume was made up 15 ml with deionized water. Its pH was adjusted to 5.0 using acetate buffer. The solid product, Hg(DDTC)2 and yellow Cu(DDTC)2 complexes so formed, was extracted carefully with the addition of 4 ml (2 × 2) CCl4, and organic phase was separated after vigorous stirring for 10 min. The solution was divided in two fractions. The absorbance of one fraction was measured by a spectrophotometer at 435 nm against a blank which is equivalent of copper content present. To another fraction known amount Hg(II) solution was added when pH value was adjusted to 10 using ammonium buffer. Copper from Cu(DDTC)2 was replaced by mercury immediately forming equivalent amount Hg(DDTC)2 complexes. Organic phase was further separated after vigorous stirring for 10 min. The absorbance was measured by a spectrophotometer at 435 nm against a blank. Reduced absorbance was equivalent to the mercury content present. Procedure has been followed for the analysis of food, biological and pharmaceutical samples.
2.7. Composition of the Complex
Job’s method of continuous variation was applied to ascertain the stoichiometric composition of the complex according to the procedures described below [18] .
2.8. Effect of Diverse Ions
The effect of various anions and cations on the determination of Cu(II) and Hg(II) under optimal conditions was studied to find out the tolerance limits of these ions in the present method. The determination of Cu(II) and Hg(II) amount was carried out using the above described general procedure. The tolerance limit of a foreign ion is taken as the amount that caused an error in the absorbance value of ≤10%.
3. Results and Discussion
3.1. Method Optimization
3.1.1. Absorption Spectra
The absorption spectra (Figure 1) of the reagent and the complexes are recorded in the wavelength range 350 - 600 nm at pH 5.0 against CCl4 (standard) or reagent blank (real samples). Cu(DDTC)2 complex solution has an absorption maximum at 435 nm, where as Hg(DDTC)2 or the reagent (DDTC) shows no appreciable absorbance at this wavelength. It was found that the molar absorptivity (ε) and Sandal’s sensitivity (for the absorbance of 0.001) at this wavelength are 1.41 × 10⁴ mol−1∙L∙cm−1 and 4.184 ng∙cm−2 respectively for the mercury determination. For the copper determination corresponding values are 3.16 × 10⁵ mol−1∙L∙cm−1 and 3.165 ng∙cm−2, respectively. Therefore, UV-vis spectrophotometric measurements were carried out at a wavelength of 435 nm for subsequent studies. It’s determination in the different matrices based on the direct measurement of its absorption for ultraviolet light is not susceptible to potential interferences from the matrix excipients.
3.1.2. Effect of Acid
Acid effect was primarily tested for HCl, HNO3, H2SO4 while last one was supposed to be suitable for Cu(DDTC)2. The influence of acid concentration on the reaction was investigated by carrying out the reaction in varying acid values. Test at different acid concentration (0.02 - 1.0) × 10−2 mol∙L−1, H2SO4) for a constant concentration (1.0 µg∙mL−1) of Cu(II) produced a constant absorbance for (0.1 - 0.8) × 10−2 mol∙L−1 H2SO4. Therefore, 0.1 × 10⁻² mol∙L−1, H2SO4 was selected as optimized concentration, and all measurements have been peformed at this concentration level.
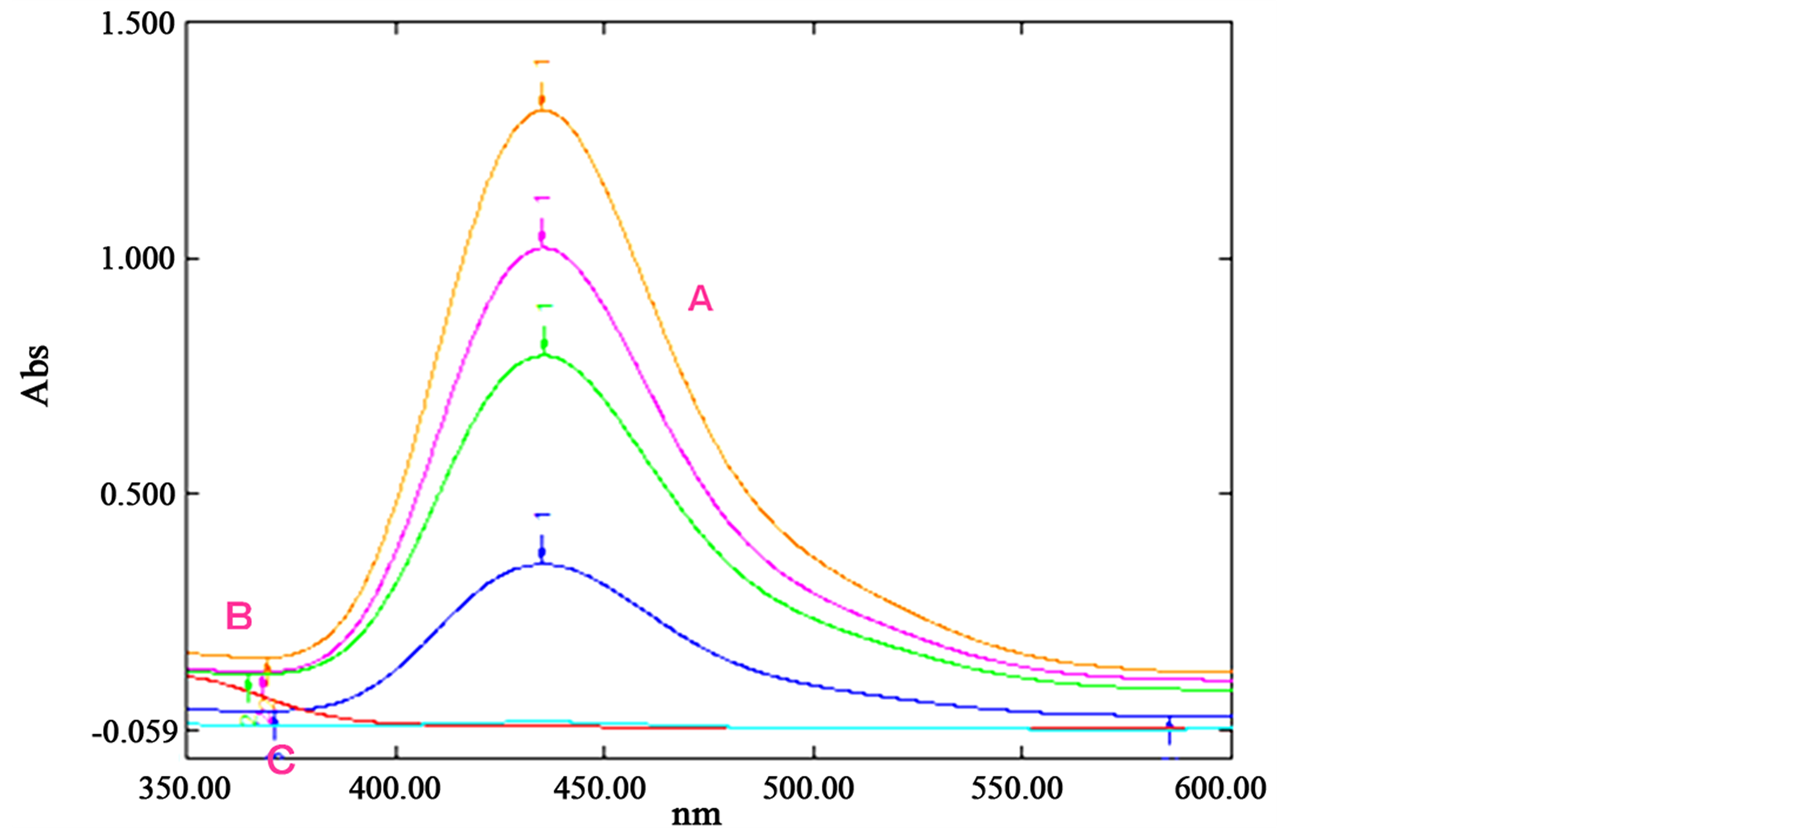
Figure 1. The typical UV-vis spectra of (A) Cu(DDTC)2, gradually decreasing due to the addition of mercury at varying conc., (B) Hg(DDTC)2 in CCl4 and (C) reagent blank.
3.1.3. Effect of Reagent Concentration
Study of the effect of DDTC concentration on its reaction with copper revealed that the reaction was dependent on the DDTC concentration as the absorbance increased with the increase in the reagent concentration. The absorbance of the complex solution at 435 nm is measured according to the standard procedure at different molar excesses (1:1 - 1:40) of sodium diethyldithiocarbamate keeping Cu(II) concentration (1.0 µg∙mL−1) constant at optimized acid concentration. Copper metal (optical path length 1 cm) and the reagent molar ratios of 1:10 to 1:40 produced a constant absorbance. A greater excess of the reagent was not studied. Therefore, a 15 fold molar excess of DDTC was optimized for constant color development and was used in all the subsequent experiments. Excess of the reagent has no effect on the absorbance of the complex.
3.1.4. Effect of Temperature and Time
The effect of temperature on the reaction was not studied due to the lake of instrumental facilities. Therefore, further experiments were carried out at room temperature (25˚C ± 2˚C). In order to determine the optimum time that is required for completion the reaction, it was allowed to proceed at room temperature for varying periods of time. The reaction goes to almost completion within 1 min. However, for higher precision of readings the reaction was allowed to proceed for quite longer time. Reactions in all the subsequent experiments were carried out for 10 min.
3.1.5. Stability of the Cu(II)-DDTC Complex
The effect of time on the stability of the Cu(II)-DDTC complex was studied by following the absorption intensity of the reaction solution (after dilution) at different time intervals. The absorbance of the complex remains stable for at least 72 h. This allowed the process of large batches of samples, and their comfortable measurements with convenience. This gives the high throughput property to the proposed method when applied for analysis of large number of samples in quality control/analytical laboratories.
3.1.6. Effect of the Aqueous Phase Volume
The volume of the aqueous phase is an important factor for the extraction of metal ions as Cu(II)-DDTC is sparingly soluble in aqueous phase. The effect of volume of the aqueous phase was also studied. The solutions containing 1 μg∙mL−1 of Cu(II) were diluted in the volume range from 5 ml to 30 ml with deionized water. The recovery of Cu(II) from aqueous phase was plotted against the aqueous phase volume. The absorbance of Cu(II) from aqueous phase decreases when the aqueous phase volume increases. Rapid decrease in absorbance was occurred for aqueous volume beyond 15 ml. Hence, total aqueous volume was always confined to maximum volume 15 ml throughout all experiments for convenient of operation with confidence.
3.1.7. Optimum Extraction Period
The efficiency of Cu(DDTC)2 extraction in organic phase depends on the extraction period. Optimum extraction period was determined according to the procedure described previously by extracting copper from the solutions containing 1 μg∙mL−1 of Cu(II) for various periods of time. The amount of Cu(II) dissolved in CCl4 was determined on the basis of measurement of the absorbance using a UV-vis spectrophotometer. After 10 min constant absorbance was obtained and it was constant up to studied period of 30 min. Hence, reaction mixture was extracted at least 10 min for getting maximum recovery.
3.1.8. Composition of the Complex
Under the optimum conditions (Table 1), the stoichiometry of the reaction between Cu(II) and DDTC was investigated by Job’s method [18] . Experimental data has been presented graphically in Figure 2. The stoichiometry was found to be 1:2 (Copper:Ligand).
3.1.9. Effect of pH on the Extraction
The effect of pH on the color intensity is studied in the pH range 1 - 10. Experimental results showed that as the pH increased the absorbance was increased rapidly. The optimum pH value for the reaction of Cu(II) and DDTC is attained at pH 4 and remains constant up to 8. At higher pH, sharp decrease in the readings occurred. The pH value should not be lower than 4 due to the fast decomposition of dithiocarbamates. On the other hand, pH value over 8 would accelerate the Cu(OH)2 precipitation. Hence, pH 5.0 is chosen for further studies as convenient. Acetic acid-acetate buffer solution (pH = 5.0) was chosen for the subsequent studies.

Table 1. Summary for the optimization and Validation variables of the proposed spectrophotometric method.
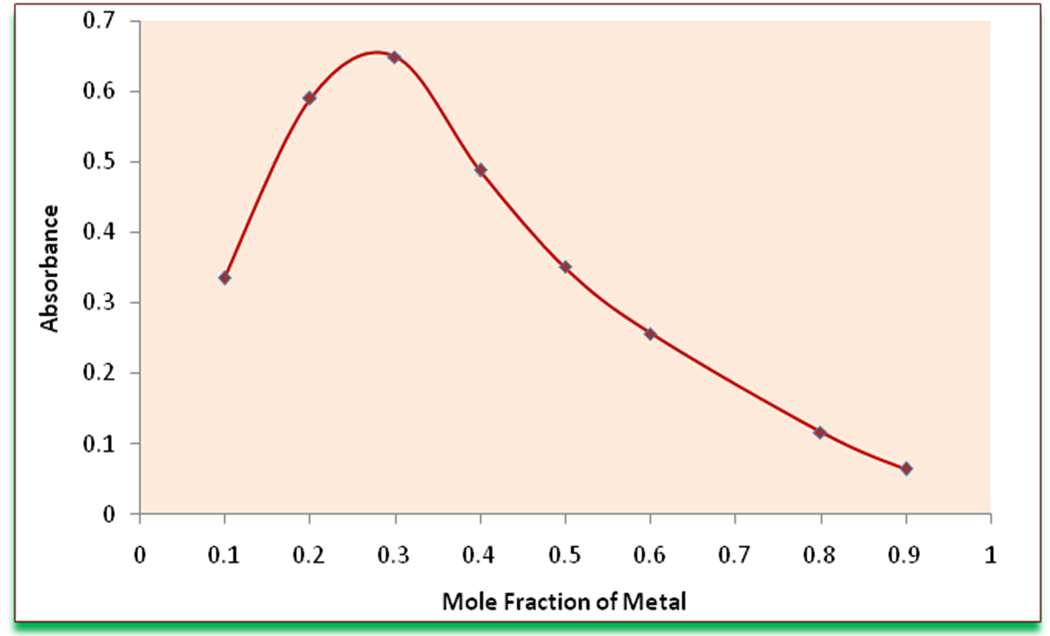
Figure 2. Job’s method for determining the composition of complex.
The influence of pH on the metal replacement of Cu(DDTC)2 and Hg(II) was investigated. Percentage recovery of Hg(DDTC)2 complex showed the maximum at pH 10.0. Hg(DDTC)2 complex was formed instantaneously by the quantitative replacement of Cu from Cu(DDTC)2, and it was well dissolved in CCl4 media at pH 10.0. It is assumed that the reaction to form this complex could have competed against hydroxide precipitation above pH 10.0 and at acidic pH, as the sulfur atom in the chelating site of DDTC has more affinity power with proton at a higher concentration of protons.
Table 1 summarizes the optimum values of optimization parameters for the proposed method.
3.2. Method Validation
3.2.1. Calibration Curves
The calibration curve was constructed by plotting absorbance against corresponding concentrations for ten standard solutions containing 0.01-12.0 µg∙mL−1 of copper and 0.01 - 15.0 µg∙mL−1 of mercury according to the general procedure. The calibration curves are shown in Figure 3 for copper determination and Figure 4 for mercury determination. The linearity range, regression equation and correlation coefficient were obtained by the method of least squares. The liner plot between the absorbance and the amount of Cu(II) ion is drawn, and the straight line obeyed the equation y = 0.203x + 0.113 for copper having regression coefficient of (r2) 0.999. Li-
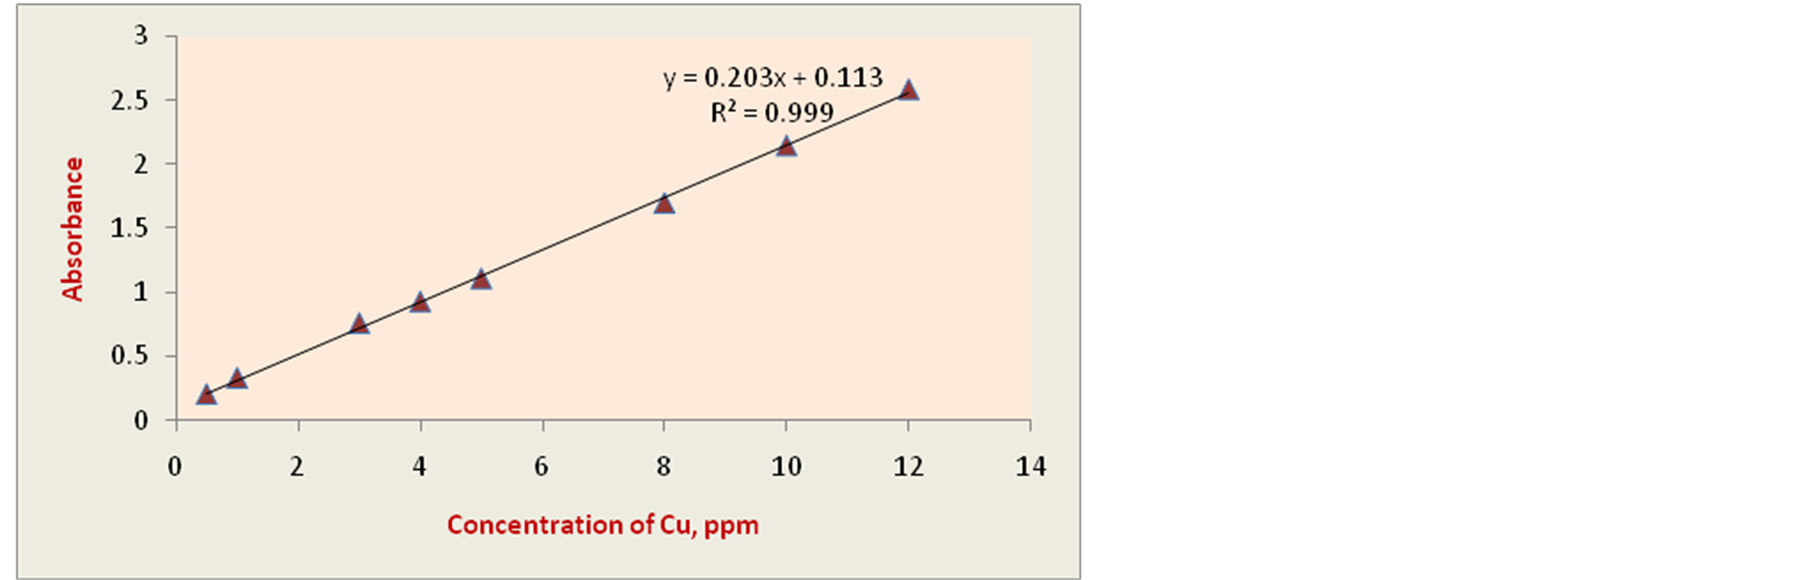
Figure 3. Calibration curve constructed by plotting absorbance against corresponding concentrations (µg∙mL−1) of copper.
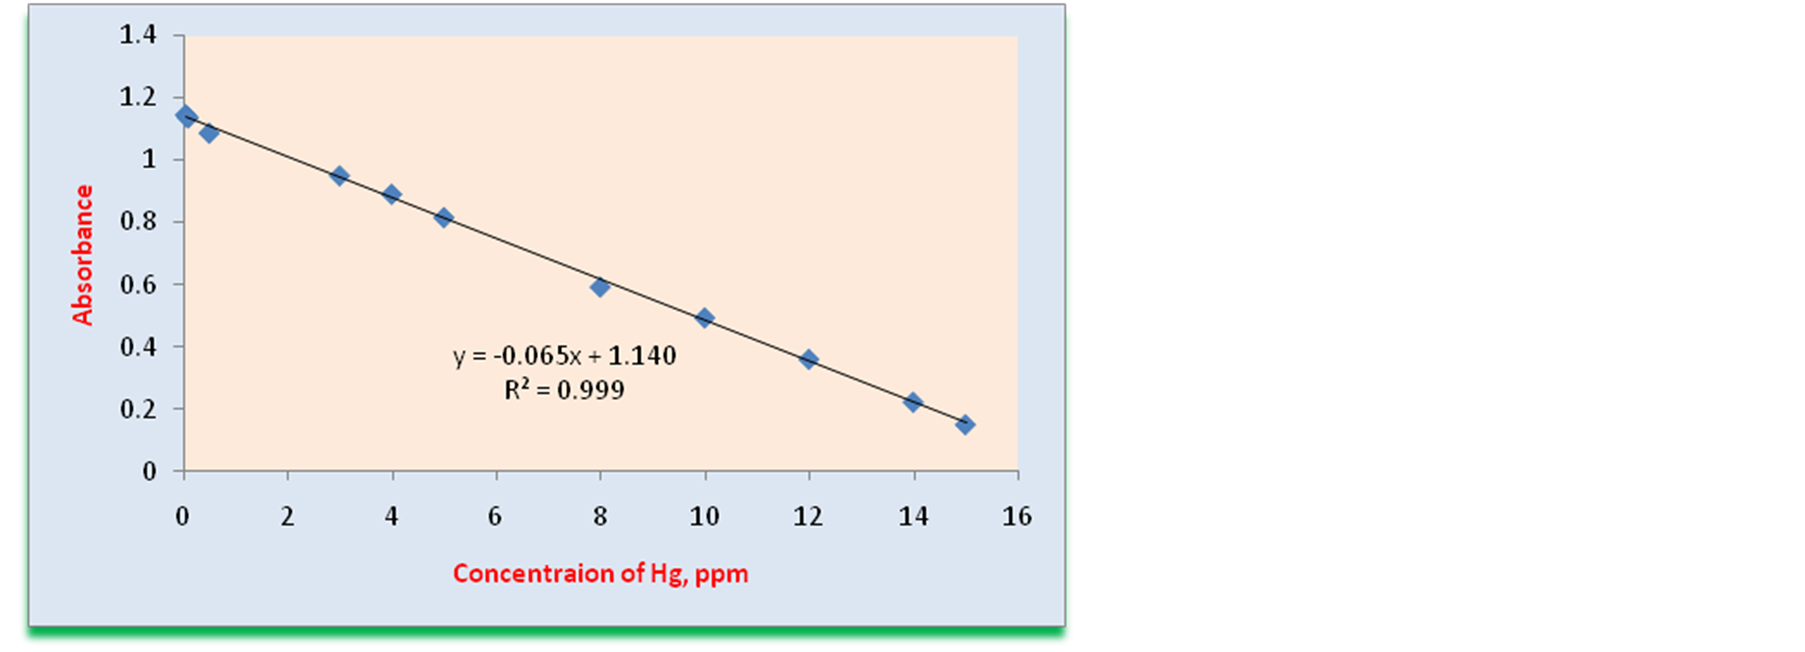
Figure 4. Calibration curve constructed by plotting absorbance against corresponding concentrations (µg∙mL−1) of mercury.
nearity range for copper according to the Beer’s law was obtained of 0.02 - 12 µg∙mL−1. The liner plot between the absorbance obtained after addition of mercury and the amount of Hg(II) is drawn, and the straight line obeyed the equation y = −0.065x + 1.140 for mercury having regression coefficient of (r2) 0.999. Linearity range for mercury according to the Beer’s law corresponded to the Cu(II) concentrations was obtained of 0.02 - 15 µg∙mL−1. The analytical sensitivity, the calibration sensitivity, which is the slope of the analytical curve, the limit of detection, and the limit of quantitation as well as other analytical characteristics of the procedure are calculated and summarized in Table1
3.2.2. Accuracy
The accuracy of the proposed method was evaluated by the recovery studies for three different concentrations (1, 5, 8 µg∙mL−1) of standards. The recovery values were 94.7% - 102.0% for both intra and inter day analyses indicating the good accuracy of the proposed method. For an accuracy check of the method, certified reference substances (alloy, amalgam, synthetic compound) were analyzed. The recovery values calculated for the certified reference materials were 94.2% - 97.6% (Table 2). The results indicate that the certified and found values are very concordant.
3.2.3. Precision
The intra-assay precision of the proposed method was determined on samples of standard mixture solutions at varying concentration levels by analyzing six replicates of each sample. The inter assay precision was determined by analyzing the same samples as duplicates in three consecutive days (n = 6). The relative standard deviations (RSD) did not exceed 4.43% proving the high precision of the proposed method for the routine application in the analysis of mercury.
Table 2. Analysis of certified substances and synthetic mixtures.
3.2.4. Sensitivity
Table 3 .Tolerance limit of foreign ions for the determination of Cu(II) and Hg(II) by the proposed method.
The analytical sensitivity, the calibration sensitivity, which is the slope of the analytical curve, the limit of detection, and the limit of quantitation as well as other analytical characteristics are calculated from the data obtained for constructing calibration curve. The calculation method is based on the standard deviation of the response (Sxy) and the slope of the calibration curve (a). The limit of detection were calculated from calibration graph by the formula; LOD = 3·Sxy/a, and the limit of quantification; LOQ = 10·Sxy/a. The standard deviation of the method for ten determinations is found to be not more than 0.066. The lower detection limit and quantification limit of Hg(II) were found to be 0.031 μg∙mL−1 and 0.116 μg∙mL−1, respectively. And the corresponding values for copper determination were 0.024 μg∙mL−1 and 0.075 μg∙mL−1, respectively.
3.2.5. Ruggedness
Ruggedness was tested by applying the proposed methods to the assay of mercury using the same operational conditions but using two different instruments at two different laboratories and different elapsed time. Results obtained from lab-to-lab and day-to-day variations were reproducible, as the relative standard deviations (RSD) did not exceed 4%. A pre-validated AAS method was used as a reference method for determination of copper in whole blood and urine samples as to get inter method variation. The result obtained in proposed method for the determination of copper in whole blood and urine samples was compared with that obtained from the reference method by statistical analysis with respect to the accuracy (by t-test) and precision (by F-test). No significant differences were found between the calculated and theoretical values of tand F-tests at 95% confidence level proving similar accuracy and precision in the determination of mercury by both methods.
3.2.6. System Suitability
For standard at five different concentration levels within 1.0 - 10.0 μg∙mL−1 maximum wavelength (435.52 ± 0.33) of absorption was checked and their relative standard deviations were calculated was to be 0.077%. Molar absorptivity calculated for the four different concentrations gave straight line parallel to concentration axis (x-axis) when plotted. Both indicate the excellent system suitability for the proposed method.
3.3. Effect of Diverse Ions
The tolerance limit of various anions and cations on the determination of Cu(II) or Hg(II) under optimal conditions in the present method is verified. The tolerance limit of a foreign ion is taken as the amount that caused an error in the absorbance value of ≤10%. Large amounts of commonly associated cations and anions do not interfere in the present method. Among the various ions studied, all the anions and the cations Pb2+, Te4+, U6+, Na+, K+, Li+, Ca2+, Mg2+, Bi3+, Th4+, W6+, Ce6+, Ti4+, Al3+ do not interfere even when present in more than 100 fold excess. Ag+ and Pd2+ interfered seriously at all proportions. It (up to 50 µg) can be masked by 100 µg∙mL−1 of citrate. Interference from Ti4+, Co2+, Ni2+, Cu2+, Zn2+ and be masked up to 100 µg by the use 100 µg∙mL−1 of EDTA. Therefore, citrate has been selected to be suitable masking agent in the present method for the simultaneous determination of copper and mercury, and also for the determination of mercury alone. Tolerance limit of foreign ions for the determination of Cu(II) and Hg(II) by the proposed method has been given in Table3
4. Application: Standard and Real Sample
The present method was successfully applied for the determination of mercury in series of synthetic mixtures of various compositions. The method was also extended to the determination of mercury and copper in a number of environmental water and soil samples, biological, pharmaceutical, fertilizer, food samples. The results of biological analyses by spectrophotometric method were found to be in excellent agreement with those obtained by AAS. The results of pharmaceutical, fertilizer, food and soil samples analyses by the spectrophotometric method shown in tables gave the satisfactory RSD within analytical agreement.
4.1. Reference Materials
A 0.1 g Certified reference materials (alloy, amalgam, synthetic compounds) containing different composition of metals was accurately weighed and placed in a 50 ml Erlenmeyer flask. It was decomposed as the acid digestion method. The solution was then cooled and neutralized with a dilute NH4OH buffer solution. A suitable aliquot (1 ml) of the decomposed solution each was taken into a calibrated flask and the metal content was determined as described under general procedure. Based on five replicate analyses, the average mercury or copper concentration determined was in good agreement with the certified values. The average percentage recovery of mercury or copper obtained in certified reference substances was quantitative as shown in Table2 RSD value obtained indicates precision of the measurements reasonable.
4.2. Synthetic Mixtures
Several synthetic mixtures of varying compositions (1:1, 5:5, 8:8) containing mercury and diverse ions of known concentrations were determined by the present method using citrate as a masking agent. The results shown in Table 2 were found to be highly reproducible. The accurate recoveries were achieved in all solutions with maximum RSD value of 1.7% for triplicate measurements. It is indicated that mercury can be measured eliminating possible interferences from diverse ions.
4.3. Food Samples
5 g amount of fish samples, 10 g amount of radish and 25 g amount of cabbage samples were accurately weighed was subjected to acid digestion. The solution was neutralized by dilute ammonia and made up to the mark into 50 ml volumetric flask with de ionized water to form stock solution. A suitable aliquot (1 ml or 2 ml) of the above solution was taken into a calibrated flask and the metal content was determined under general procedure as described. Based on five replicate analyses, the average metal content determined by spectrophotome
tric method was in good agreement with the leveled values. RSD values for all measurements (n = 3) were less than 5%. Table 4 presents the results of determination of mercury and copper in food samples by the proposed method. Results of triplicate measurements are given in table indicate RSD well enough.
4.4. Biological Samples
Human blood 2 ml or urine 25 ml was collected in polyethane bottles from the affected persons. The samples were taken into beaker. Acid decomposition was performed. The content of the beaker was filtered and neutralized with dilute ammonia. The resultant solution was then transferred quantitatively into a 20-ml calibrated flask and made up to the mark with de-ionised water. An aliquot (1-ml) of this digested biological sample was pipetted into a calibrated flask and the metal content was determined under the general procedure as described. The results of the biological sample analyses by the spectrophotometric method were found to be in excellent agreement with those obtained by AAS. The results are given in Table 5 indicating the method reproducible.
4.5. Mercury in Pharmaceutical Samples
1 g of tablet or powder or 1 ml of homeopathic medicine was dissolved in hot water and made 100 ml solution to form experimental solution. An aliquot amount was analyzed according to the general procedure. Results are summarized in Table6 RSD obtained for the triplicate measurements was not exceeding 3%.
Table 4. Determination of mercury and copper in food samples by the proposed method.
Table 5. Biological sample analysis for the determination of mercury and copper by proposed method.
Table 6. Pharmaceutical sample analysis for the determination of mercury and copper by proposed method.
Table 7. Comparison on sensitivity and application of present method with other reported methods.
In radish (vegetable sample) mercury was found 0.07 µg∙mL−1 but in laitta fish sample it was found 0.70 µg∙mL−1, which is greater than vegetables. On the other hand in all blood samples (Lung, Kidney and Storke patient) mercury was found around the 1.8 µg∙mL−1. But in urine samples of kidney patient has higher than lung and storke patient. Lung patient contains higher amount of copper than the others. The biological tolerance limits for mercury concentration are 50 µg∙mL−1 in urine and 10 µg∙mL−1 in blood.
Diethylthiocarbamate is proved to be more suitable than other complexing reagents cited in literature in respect to molar absorptivity and sensitivity values and because of their selectivity towards Hg(II). Using suitable masking agent the method shows wide application for mercury determination. Both copper and mercury were simultaneously determined in all real samples. All determinations provided high accuracy and excellent precision. Method is applicable avoiding interferences as most of the alkaline and alkaline earth metals form colourless complexes with the DDTC.
Table 7 shows the comparison on sensitivity and application of present method with other methods recently published available in literature (supplementary data). It shows that there are a number of methods though sensitive (Sl. no. 11-13, 16) involve complicated procedures employing sophisticated equipment, expensive and tedious separation and pre-concentration steps or they have limited application.
5. Conclusion
A spectrophotometric procedure for the simultaneous determination of mercury(II) and copper using diethyldithiocarbamate (DDTC) as ligand is described. Primarily Cu(II) complex was extracted with CCl4 and the absorbance was measured at 435 nm. Mercury determination was based on the quantitative displacement of diethyldithiocarbamate (DDTC) from copper complex with Hg(II), and subsequent measurement of reduced absorbance. Therefore, the method described herein has many advantages: it is simple and rapid; it has high accuracy and sensitivity, use of inexpensive reagents available in any analytical laboratory. Therefore, the method is practical and valuable for its wide application. The method was applied to a number of environmental water and soil samples, and biological, pharmaceutical and food samples. The results show a good agreement with certified values in alloy and amalgam, theoretical values in synthetic compounds, pharmaceutical preparations and with the results obtained by AAS method for biological samples. Moreover, Hg(DDTC)2 is more stable in basic aqueous media than Cu(DDTC)2 as to perform the mercury determination by the quantitative replacement. Also, great advantage that is interesting of this method is its selective application to mercury determination individually or copper and mercury determination simultaneously as required.
Conflicts of Interest
The authors declared no conflicts of interest.
References
- Fergusson, J.E. (1990) The Heavy Elements: Chemistry, Environmental Impact and Health Effects. Pergamon Press, Oxford, 85-547.
- Venugopal, B. and Lucky, T.D. (1978) Metal Toxicity in Mammals. Vol. 2, Plenum Press, New York, 86-99.
- Turkoglu, O. and Soylak, M. (2005) Spectrophotometric Determination of Copper in Natural Waters and Pharmaceutical Samples with Chloro(phenyl) glyoxime. Journal of the Chinese Chemical Society, 52, 575-579.
- Moreno-Cid, A. and Yebra, M.C. (2002) Flow Injection Determination of Copper in Mussels by Flame Atomic Absorption Spectrometry after On-Line Continuous Ultrasound-Assisted Extraction. Spectrochimica Acta Part B: Atomic Spectroscopy, 57, 967-974. http://dx.doi.org/10.1016/S0584-8547(02)00030-7
- Cindric, I.J., Krizman, I., Zeiner, M., Kampic, S., Medunic, G. and Stingeder, G. (2012) ICP-AES Determination of Minorand Major Elements in Apples after Microwave Assisted Digestion. Food Chemistry, 135, 2675-2680. http://dx.doi.org/10.1016/j.foodchem.2012.07.051
- Alexiu, V., Chirtop, E., Vladescu, L. and Simion, M. (2004) Determination of Mercury in Pharmaceuticals by Graphite Furnace Atomic Absorption Spectrometry with Chemical Modifier. Acta Chimica Slovenica, 51, 361-372.
- Han, F.X., Patterson, W.D., Xia, Y., Maruthi, B.B. and Su, Y. (2006) Rapid Determination of Mercury in Plant and Soil Samples Using Inductively Coupled Plasma Atomic Emission Spectroscopy, a Comparative Study. Water, Air, and Soil Pollution, 170, 161-171. http://dx.doi.org/10.1007/s11270-006-3003-5
- da Silva, M.J., Paim, A.P., Pimentel, M.F., de la Cervera M.L. and Guardia, M. (2010) Determination of Mercury in Rice by Cold Vapor Atomic Fluorescence Spectrometry after Microwave-Assisted Digestion. Analytica Chimica Acta, 667, 43-48. http://dx.doi.org/10.1016/j.aca.2010.04.016
- Rajawat, D.S., Srivastava, S. and Satsangee, S.P. (2012) Electrochemical Determination of Mercury at Trace Levels Using Eichhornia Crassipes Modified Carbon Paste Electrode. International Journal of Electrochemical Science, 7, 11456-11469.
- Ahmed, M.J., Jahan, I. and Banoo, S. (2002) A Simple Spectrophotometric Method for the Determination of Copper in Industrial, Environmental, Biological and Soil Samples Using 2,5-Dimercapto-1,3,4-Thiadiazole. Analytical Sciences, 18, 805-810. http://dx.doi.org/10.2116/analsci.18.805
- Ramanjaneyulu, G., Reddy, P.R., Reddy, V.K. and Reddy, T.S. (2008) Direct and Derivative Spectrophotometric Determination of Copper(II) with 5-Bromosalicylaldehyde Thiosemicarbazone. The Open Analytical Chemistry Journal, 2, 78-82. http://dx.doi.org/10.2174/1874065000802010078
- Rekha, D., Suvardhan, K., Kumar, K.S., Reddy, P., Jayaraj, B. and Chiranjeevi, P. (2007) Extractive Spectrophotometric Determination of Copper(II) in Water and Alloy Samples with 3-methoxy-4-hydroxy Benzaldehyde-4-bromophenyl Hydrazone. Journal of the Serbian Chemical Society, 72, 299-310. http://dx.doi.org/10.2298/JSC0703299R
- Reddy, G.C., Devanna, N. and Chandrasekhar, K.B. (2011) Derivative Spectrophotometric Determination of Mercury (ii) Using Diacetyl Monoxime Isonicotinoyl Hydrazone. International Journal of Chemistry, 3, 227-232.
- Khan, H., Ahmed, M.J. and Bhanger, M.I. (2005) A Simple Spectrophotometric Determination of Trace Level Mercury Using 1,5-diphenylthiocarbazone Solubilized in Micelle. Analytical Sciences, 21, 507-512. http://dx.doi.org/10.2116/analsci.21.507
- Cesur, H. (2007) Selective Solid-Phase Extraction of Cu(II) Using Freshly Precipitated Lead Diethyldithiocarbamate and Its Spectrophotometric Determination. Chemical Papers, 61, 342-347. http://dx.doi.org/10.2478/s11696-007-0045-0
- Uddin, M.N., Salam, M.A. and Hossain, M.A. (2012) Spectrophotometric Measurement of Cu(DDTC)2 for the Simultaneous Determination of Copper and Zinc. Chemosphere, 90, 366-373. http://dx.doi.org/10.1016/j.chemosphere.2012.07.029
- Uddin, M.N., Chowdhury, D.A. and Islam, J. (2013) Synthesis, Characterization and Antibacterial Evaluation of Some Mixed-Metal Mixed-Ligand Complexes. Chiang Mai Journal of Science, 40, 625-635.
- Skoog, D.A., West, D.M. and Holler, F.J. (1988) Fundamentals of Analytical Chemistry. 5th Edition, Saunders, New York.
NOTES

*Corresponding author.