American Journal of Analytical Chemistry
Vol.4 No.6A(2013), Article ID:33452,9 pages DOI:10.4236/ajac.2013.46A004
A New Biosensor for Glucose Based on Screen Printed Carbon Electrodes Modified with Tin (IV)-Oxide
1Departament of Chemistry, Faculty of Mathematical and Natural Science, University of Prishtina, Prishtina, Kosovo
2Institute of Chemistry, Analytical Chemistry, Karl-Franzens University Graz, Graz, Austria
Email: *tahir.arbneshi@uni-pr.edu
Copyright © 2013 Liridon Berisha et al. This is an open access article distributed under the Creative Commons Attribution License, which permits unrestricted use, distribution, and reproduction in any medium, provided the original work is properly cited.
Received April 14, 2013; revised May 15, 2013; accepted June 1, 2013
Keywords: Biosensor; Glucose; Hydrogen Peroxide; Tin (IV)-Oxide; Blood Serum
ABSTRACT
Tin (IV) oxide was used as a bulk mediator in carbon paste and carbon ink screen-printed electrodes to improve the better performance of the carbon electrodes for the detection of hydrogen peroxide in comparison with unmodified electrodes. A new glucose biosensor developed from modified carbon paste electrode and coated with glucose oxidase entrapped in Nafion was investigated with a flow injection system. The biosensor could be operated under physiological conditions (pH 7.5, 0.1 M phosphate buffer), with an operating potential of −200 mV (vs. Ag/AgCl), a flow rate of the carrier of 0.2 mL/min. and an injection volume of 100 μL. The amperometric response of the biosensor showed good linearity up to 200 mg/L with a detection limit (3σ) of 6.8 mg/L. The relative standard deviation for the repeatability of measurements for 100 mg/L glucose was 2.9% (n = 10 measurements) and the corresponding reproducibility was 12% (n = 5 sensors). The effect of all investigated interferences (uric acid, paracetamol, xanthine, hypoxanthine and ascorbic acid) was not fatal and could be eliminated by the use of the standard addition method. The new biosensor was successfully applied to the determination of glucose in human blood plasma.
1. Introduction
Nowadays electroanalytical methods are widely used for monitoring different important parameters in environment, food industry, medicine etc. because of their easy applicability and low cost. Development of amperometric sensors for determination of glucose in biological fluids is significant for the diagnosis and management of metabolic disease diabetes mellitus. Electrode materials used may vary a lot in their electrochemical properties and prices but most of the investigations are focused on low cost assays. Carbon paste electrode as an electrochemical sensing material has a lot of advantages including simple preparation and modification, as well as easy to handle. They also have a wide range potential application, which makes them very useful in electrochemical analysis for different analytes [1]. Screen-printing technology offers the advantages of miniaturization and mass fabrication for cost reduction [2]. Using oxidases as modifiers for electrochemical biosensors allows in many cases monitoring of the intermediate hydrogen peroxide, which is electroactive, but at relatively high potentials [3]. Due to its biological importance, hydrogen peroxide can be detected with chemically modified carbon paste electrodes in lower potential and make them useful in biological media without significant interference from sample matrix. Different modifiers were investigated on their ability to decrease overpotentials of hydrogen peroxide on carbon paste electrodes, such as iron and platinum metal or other transition metal oxides or complexes or organic compounds [4]. Metal oxides such as MnO2 [5], CuO [6], Fe2O3 [7], RhO2 [8], RuO2 [9], ReO2 [10] were found suitable for this purpose.Our research in this study is focused on the possibilities of carbon-based heterogeneous electrodes modified with tin (IV) oxide for the detection of hydrogen peroxide and its potential application as a glucose biosensor through glucose glucose oxidase/ Nafion entrapment on the electrode surface.
2. Experimental
2.1. Chemicals, Reagent and Solutions
Glucose oxidase (EC 1.1.3.4. from Aspergillus niger, 210 U/mg solid), Nafion® (5% m:m solution in lower aliphatic alcohols), tin (IV) oxide were purchased from Fluka. All chemicals used were of analytical reagent grade. Phosphate buffer solution (PBS) was prepared by mixing aqueous solutions of sodium dihydrogen phosphate (0.1 mol/L) and disodium hydrogen phosphate (0.1 mol/L) until the required pH was achieved. Hydrogen peroxide and glucose stock solution of 1.000 g∙L−1 were prepared and diluted appropriately; the glucose stock was left overnight at room temperature to allow equilibration of the anomers. Solutions of uric acid, ascorbic acid, xantine and hypoxantine, paracetamol were freshly prepared before use.
2.2. Apparatus
For cyclic voltammetry and hydrodynamic amperometry, a potentiostat EG&G Princeton Applied Research (Model 264A) with X-Y Recorder and a potentiostat Autolab PSTAT 10 with software GPES version 4.9 were used. The electrochemical cell consisted of a carbon paste electrode as the working electrode, an Ag/AgCl reference electrode (Metrohm 6.0733.100), and a platinum wire as the counter electrode. Argon or nitrogen was used for degassing the solutions. A magnetic stirrer provided convection of the solution. The flow injection system was assembled from a potentiostat (BAS 100B and the corresponding software, BAS 100W, version 2) as the detector, a high performance liquid chromatographic pump (510 Waters, Milford MA, USA in connection with a system controller, Waters 600E), a sample injection valve (5020 Rheodyne, Cotati, CA, USA), and a thin layer electrochemical detector (LC 4C, BAS, West Lafayette, Indiana, USA) with a flow through cell (spacer thickness 0.19 mm; CC-5, BAS). The working electrode was a screenprinted carbon electrode (modified with tin dioxide alone or in combination with a Nafion film containing glucose oxidase), the reference electrode an Ag/AgCl (3 M KCl) electrode, and the counter electrode was the steel back plate of the cell. All potentials mentioned in this paper are referred to the Ag/AgCl reference electrode.
2.2.1. Preparation of Working Electrodes
Unmodified carbon paste was prepared by mixing 1.000 g graphite powder and 360 μL paraffin oil (Uvasol®, 0.84 - 0.89 kg/L,) in an agate mortar by gently stirring with a pestle until uniformity and proper compactness was obtained. Modified carbon paste was prepared by mixing 0.950 g graphite powder with 0.050 g SnO2 and 360 μL paraffin oil. The carbon pastes were transferred to glass vials and allowed to stand overnight in a refrigerator.
Screen printed electrode modified with SnO2 (5% m: m), was prepared by weighing the desired mass of tin (IV) oxide into a glass vial, and the necessary mass of carbon ink (Electrodag 421 SS, Acheson). The mixture was stirred for 20 - 30 min with a glass-rod. After sonicating for about 20 min, the mixture was immediately printed onto ceramic supports (sintered aluminum oxide plates, COORS) using a semiautomatic screen printer (SP-200, MPM) and were dried at room temperature overnight.
Biosensors were prepared by coating the SnO2-modified SPE with a Nafion®/Glucose oxidase solution which was obtained by mixing 40 μL neutralized Nafion solution, 40 μL glucose oxidase solution (50 mg/mL) and 160 μL ethanol. 10 μL of the casting solution were drop-coated on the SPE surface (125 mm2). After the first layer had become dry at room temperature, a second layer was drop-coated similarly with 10 μL casting solution.
2.2.2. Procedures
Cyclic voltammograms were scanned between +1200 mV and −1200 mV with a scan rate of 20 mV/s except if stated otherwise. Hydrodynamic amperometric measurements were made at an operating potential of −200 mV if not mentioned otherwise; 250 mg/L H2O2 were added per step. Amperograms in flow injection analysis were recorded at potentials at −200 mV. The flow rate of the carrier (PBS 0.1) was 0.2 mL/min and the injection volume of the analyte was 200 µL
2.3. Analyses of Samples
Freshly sampled blood was transferred into a plastic tube containing an anticoagulant (EDTA) and centrifuged for 30 minutes at 4500 rpm. An amount of 1.00 mL of plasma was diluted with 9.00 mL PBS (0.1 M). The determination of the glucose level in the supernatant plasma was done in FIA mode using the standard addition method to exclude effects of the matrix and interferents. Reference determinations were made with a commercial glucometer Ascensia BRIO using whole blood.
3. Results and Discussion
Carbon paste electrodes and screen printed electrodes, unmodified and modified with SnO2, were studied to characterize the electrochemical behavior of the modifier and to evaluate its action on the analyte, hydrogen peroxide. The glucose biosensor was designed on the basis of a screen printed carbon electrode modified with tin dioxide in the electrode bulk and glucocose oxidase entrapped in a Nafion film on the electrode surface.
3.1. Studies with Hydrogen Peroxide
3.1.1. Cyclic Voltammetry
Figure 1 compares the cyclic voltammograms of a plain carbon paste electrode and a CPE modified with tin (IV) oxide. At positive potentials practically no difference between both electrodes can be noticed. At negative potentials the reduction of SnO2 can be noticed, probably to SnO, with a peak potential of around −0.8 V vs. Ag/AgCl. At this region also significant currents arise with the un-
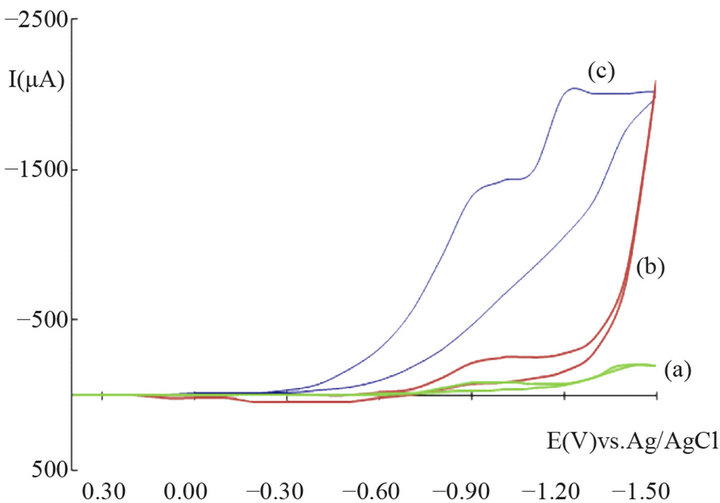
Figure 1. Cyclic voltammograms of a plain CPE (a), and a CPE modified with SnO2 before (b) and after (c) the addition of 50 mg/L H2O2, scan rate 20 mV/s, Einit. = +0.40 V, Efinal = −1.50 V; phosphate buffer 0.1 M, pH 7.5.
modified electrode, due to the reduction of oxygen-containing groups on the surface of carbon particles (carbonyls, ketones, quinones, etc.). The reduction of tin (IV) to tin (II) is electrochemically irreversible under these conditions because the corresponding re-oxidation is hardly detectable in the scan. Nevertheless, the shape of the anodic scan of the modified electrode in the range from −0.7 to −0.6 V indicates catalyticeffects which means that the electrochemical conversion of Sn(IV)/ Sn(II) could be also connected with the reduction of oxygen-carbon groups in this area of potential.
The cyclic voltammogram of hydrogen peroxide with an unmodified electrode shows negligible response down to potentials of −0.4 V. At more negative potentials a broad reduction signal can be observed with a peak maximum around −1 V (not shown); it represents the conversion of H2O2 to water.
The modified electrode shows a bit different picture. Hydrogen peroxide gives notable currents at potentials below 0.0 V. At more negative potentials the reduction current of hydrogen peroxide increases and exceeds the signal of an unmodified electrode for more than thirteen times (1100 µA vs. 84 µA) at the peak potential of the reduction of SnO2, i.e., around −0.9 V. Further reduction is noticeable at around −1.2 V and may be ascribed to the direct reduction of hydrogen peroxide at the electrode. Thus, it may be concluded that tin dioxide as a modifier has a significant effect on the analytical signal of the analyte and is well suitable for its mediated detection.
Based on the observations obtained from the cyclic voltammograms a reaction mechanism is suggested which explains the electrocatalytic behavior of tin dioxide. SnO2 contains tin in the highest oxidation state; its oxidation potential is not high enough to further oxidize hydrogen peroxide to oxygen. Tin (IV) is reduced already at slightly negative potentials, probably to tin (II). In fact, Sn(II) can be easily oxidized to Sn(IV) by H2O2. As reduction currents are measured the conversion of stannic oxide to stannous oxide is essential for the measurement.
Thus the action of the mediator on the reduction of hydrogen peroxide may be sketched as shown in Figure 2.
Primarily electrochemical reduction of tin (IV) to tin (II) occurs, which in turn is oxidized chemically to tin (IV) by hydrogen peroxide. Thus, the analyte is reduced in a mediated way generating the oxidized mediator, which is present at the surface of the electrode virtually in a higher concentration than in the absence of H2O2. At potentials more negative than −0.1 V the reduction currents in CV reflect the concentration of hydrogen peroxide already in the medium mg/L range.
3.1.2. Hydrodynamic Amperometry
Figure 3 shows a typical hydrodynamic amperogram for a carbon paste electrode modified with tin dioxide after addition of certain amounts of hydrogen peroxide.
With an operation potential of −300 mV 50 mg/L of hydrogen peroxide produce clearly distinct current steps already. The noise is produced by the agitation of the solution. The response time of the sensors is rather quick; usually after two seconds the full signal has evolved including dispersion of the analyte in the measurement solution. It is obvious that at this potential the current
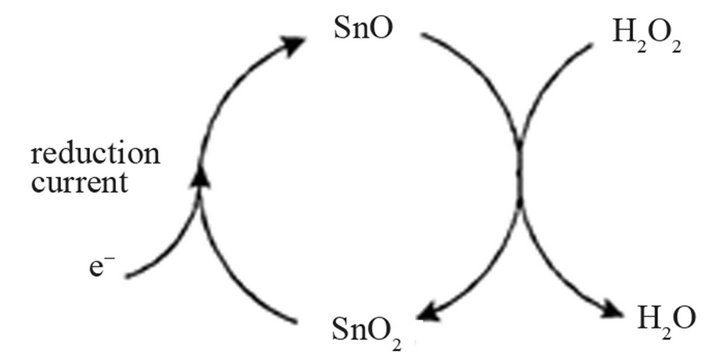
Figure 2. Suggested reaction mechanism of the electro-catalytic action of tin dioxide on hydrogen peroxide.
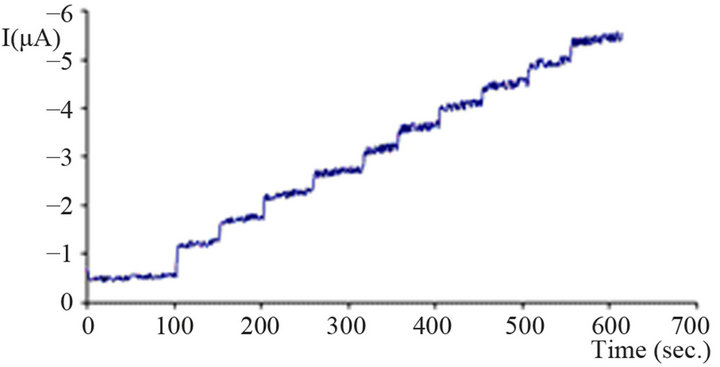
Figure 3. Hydrodynamic amperogram of modified CPE with SnO2. working potential −300 mV, addition 50 mg/L H2O2 per step; phosphate buffer (0.1 M, pH = 7.5); stirred solution (approx. 300 rpm).
steps decrease with increasing concentration of hydrogen peroxide together with a very slightly increasing baseline. The latter observation could be caused by slowly increasing amounts of mediator activated at this potential. Therefore even less negative operation potentials are preferential.
In Figure 4 the hydrodynamic voltamperogram for slightly negative potentials is shown. Lowering the potential causes an increase of the reduction current, but at the same time also the background current (current without hydrogen peroxide) increases. Additionally, more negative potentials produce a drift of the baseline which deteriorates the repeatability. With respect to practical applications, more negative potentials also increase the risk for co-reduction of other components in complex samples such as fruit juices, blood or blood plasma. For these reasons, an operation potential of −200 mV was chosen for more detailed studies. This potential provides still sufficient amperometric signal (compared to no signal for the unmodified electrode), the background current is reasonably small in combination with a good repeatability.
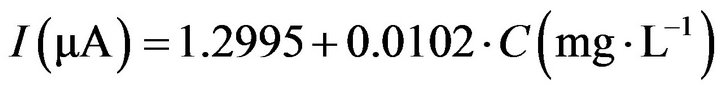
Calibration curves for different operating potentials, obtained from hydrodynamic studies, are summarized in Figure 5. In order to give an idea about the size of the background current, the latter was not subtracted from the signal but is represented as the intercept of the graph with the current axis at c = 0 mg/L hydrogen peroxide. At potentials of −250 mV and below there is a quasilinear relation between current and concentration of H2O2 up to approximately 200 mg/L; at less negative potentials the dynamic range extents up to 400 mg/L of hydrogen peroxide, above which concentration the relation levels off and deviates from linearity.
Because −200 mV was chosen as a suitable operation potential, a practically linear relation between current and concentration at this potential exists up to a concentration of about 400 mg/L H2O2 with the corresponding Equation (1). The correlation factor is R2 = 0.9945.
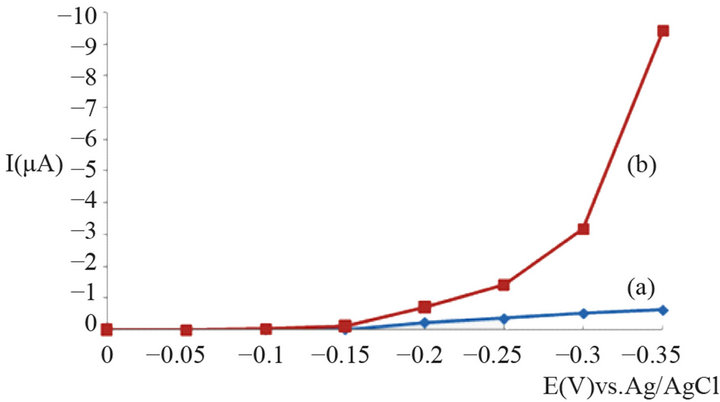
Figure 4. Hydrodynamic voltamperogram of hydrogen peroxide at a tin dioxide-modified carbon paste electrode; H2O2 250 mg/L; (a)—background current, (b)—signal of the first step in the hydrodynamic amperogram.
 (1)
(1)
The sensitivity of the calibration curve (slope) is 0.0102 µA×L×mg−1.
From this we may estimate the detection limit (3s of noise) as around 15 mg/L when using hydrodynamic amperometry as the analytical method.
3.2. Studies with Screen Printed Carbon Electrodes Modified with SnO2 Using Flow Injection Analysis
For detailed quantitative analytical studies flow injection analysis (FIA) was used because it allows simple operation and can manage a big number of analyses in a comparably short time which is much more appropriate in case that repetitive measurements with the same sensor should be made. For the work presented here FIA was employed in one of its simplest forms. A pump was connected to an injection block for sample introduction and to a detector containing the electrochemical sensor (modified screen-printed electrode). The current flow was monitored in dependence on time.
Figure 6 shows a typical amperogram as obtained by
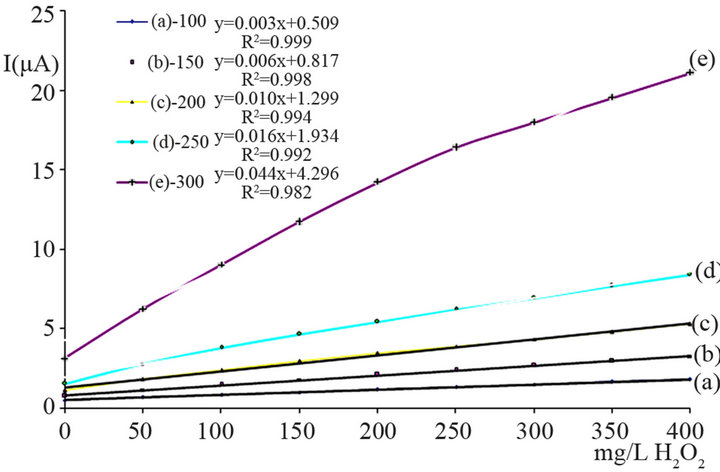
Figure 5. Hydrodynamic amperometric calibration curves for H2O2 of a CPE modified with SnO2 at various potentials (a) 100, (b) 150, (c) 200, (d) 250 and (e) 300 mV vs. Ag/AgCl.
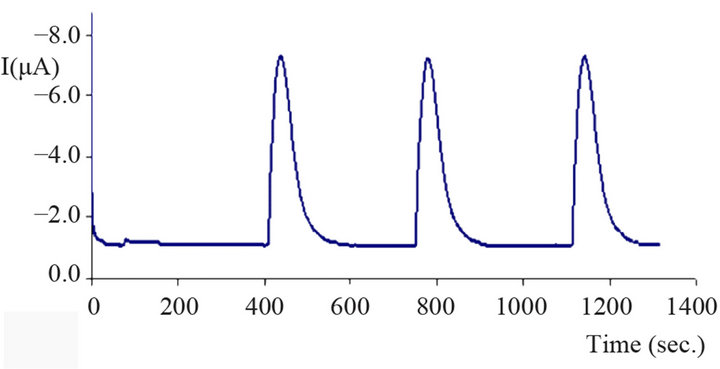
Figure 6. Amperogram obtained by FIA with a SnO2-modifed SPCE; operating potential −200 mV vs. Ag/AgCl, flow rate 0.4 mL/min, injection volume 200 µL, H2O2 concentration 100 mg/L.
flow injection. After injection the carries stream transport the analyte solution to the detector where it produces a current response. The signal is peak-shaped and of typical transient nature. When the sample plug reaches the detector it causes a sharp increase of the response. As the tailing part of the sample plug is more subject to dispersion in the carrier, the typical peak shapes from flow injection exhibit tailing with a slower relaxation of the signal to the background current value compared to the increase at the front end of the peak. Thus typically asymmetric peaks are obtained as a result. In fact the overall shape is dependent on the geometry of the practical setup and on some experimental parameters, such as injection volume and flow rate. For quantitative evaluation both, peak height and peak area may be exploited. Nevertheless for the sake of simplicity peak heights are evaluated in the current study.
3.2.1. Operating Potential
As can be expected the dependence of the signal height in FIA on the operating potential (Figure 7) is similar tocarbon paste electrodes in hydrodynamic mode (compare Figure 4).
Also the background current (height of the base line) behaves similarly as in hydrodynamic amperometry. The more negative the potential, the higher the signal and the background. For the same reasons as explained with hydrodynamic amperometry already, an operating potential of −200 mV seems a favorable compromise still having a good signal-to-background ratio in combination with good repeatability.
3.2.2. Calibration Curve and Statistics
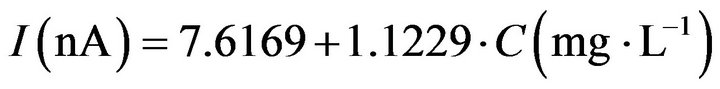
For investigations on the dynamic range of the response of screen printed electrodes, hydrogen peroxide in a concentration range from 10 mg/L to 1000 mg/L was injected into the flow system. A linear range between and concentration was found upto 200 mg/L according to Equa-
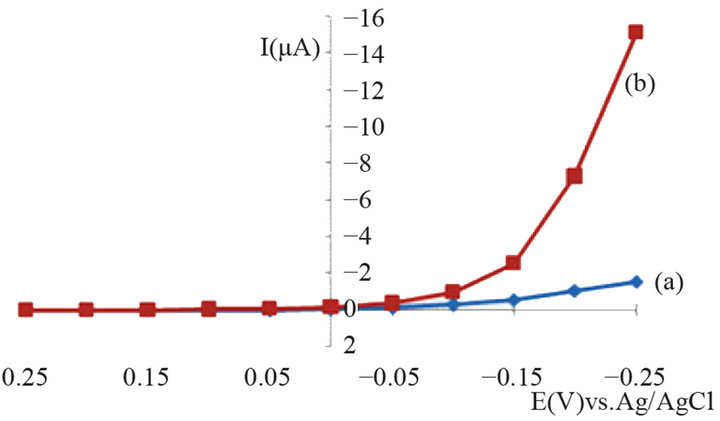
Figure 7. Dependence of the current in FIA mode on the operating potential; (a)—background current (b)—peak current; carrier phosphate buffer 0.1 M pH 7.5, hydrogen peroxide concentration 100 mg/L, flow rate 0.4 mL/s, injection volume 200 µL.
tion (2) with a correlation factor of 0.9993. The sensitivity of calibration curve was 0.0302 µA·L·mg−1 and the detection limit (3σ estimated from the standard deviation of FIA-peaks at 10 mg/L H2O2) was 4.6 mg/L. The relative standard deviation for repeatability of measurements for 100 mg/L hydrogen peroxide was 2.0% (n = 5 measurements) and for the repeatability 1.7% (n = 5 sensors).
 (2)
(2)
3.3. Glucose Biosensor
The glucose biosensor was designed on the basis of the screen printed electrode modified with tin dioxide, which was investigated in details above. On the surface of such sensors the enzyme (glucose oxidase) was immobilized in a film of Nafion.
Glucose oxidase oxidizes glucose to gluconolactone with the aid of oxygen; the latter is reduced to hydrogen peroxide and represents the electroactive species which is to be detected. Thus, the glucose sensor consists of a doubly modified electrode: a thick film which is bulkmodified with the mediator (SnO2) and film-modified with the enzyme. The overall sketch of the way how the biosensor functions is shown in Figure 8.
A typical amperogram of glucose obtained with the biosensor in FIA mode is shown in Figure 9. Increasing the concentration from 10 mg/L glucose produces peaks with increasing peak heights. This demonstrates clearly that the biosensor can be used for the determination of glucose, and that the operational principle as sketched
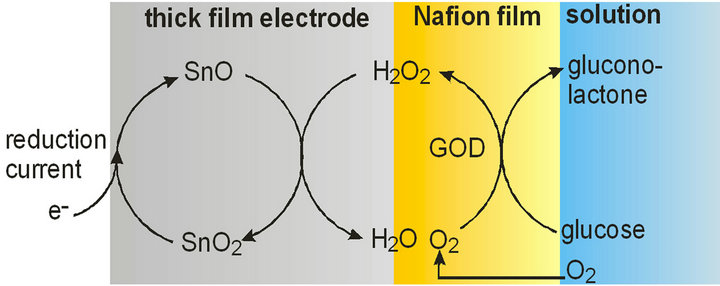
Figure 8. Working principle of the glucose biosensor

Figure 9. Amperogram of glucose in FIA mode; carrier phosphate buffer (0.1 M pH 7.5), operation potential −200 mV, flow rate 0.2 mL/min, injection volume 100 μL.
above is a reasonable explanation of its way of function. In the following chapters the most important experimental parameters will be investigated, and the applicability of the biosensor to the determination of glucose in blood plasma samples will be investigated.
3.3.1. Operating Potential
As the biosensor relies on the detection of hydrogen peroxide similar optimal operation potentials can be expected as for the hydrogen peroxide sensor alone. In fact the additional membrane changes somehow the characteristics of the sensor a bit due to a slightly increased hindrance of the diffusion towards the electrode surface, but nevertheless the potential should not be practically affected by this.
Suitable operating potentials for the biosensor for glucose were examined by injecting 100 mg/L glucose at different potentials. The dependence of the peak currents on the operating potential is shown in Figure 10. Signal responses are detectable with negative operation potentials; the more negative the latter the higher the current. At the same time a slight increase of the background current can be observed, very similar to the findings with hydrogen peroxide alone. For reasons displayed above already it is good to have high responses at relatively low operating potentials. Based on these considerations a working potential of −200 mV was chosen, because according to experience the potential was considered as sufficiently not to cause interferences from other compounds present in the plasma matrix combined with a high signal response. At a potential of −150 mV the peak current was only about 30% of the one at the chosen value.
3.3.2. Flow Rate
The peak shape, in particular the peak width and the peak height, are dependent on the flow rate of the carrier solution in FIA mode. The peak width is indirectly proportional to the flow rate, because with small velocities of
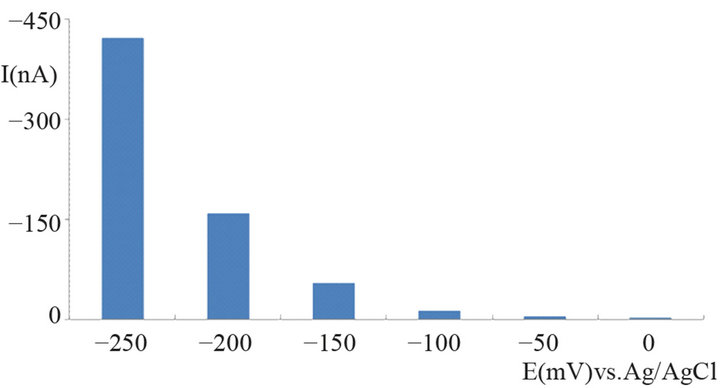
Figure 10. Dependence of the current response on the operating potential of the glucose biosensor in FIA mode; carrier phosphate buffer 0.1 M (pH 7.5); injection volume 200 µL of 100 mg/L D-glucose solution, flow rate 0.4 mL/min.
the carrier the analyte resides longer over the electrode surface. The peak height of the current depends mainly on two effects: diffusion of the analyte (glucose) to the reaction center (enzyme) and kinetics of the enzymatic reaction. In contrast to the bulk modified screen printed electrodes for the determination of hydrogen peroxide only, where H2O2 could diffuse directly to an unshielded electrode surface, a membrane always represents a barrier to diffusion. Superimposed on the diffusion effect is the enzymatic conversion of oxygen to hydrogen peroxide which controls the generation of the molecule to be probed.
Based on these considerations it may be expected that the longer glucose resides over the enzyme the higher will be the efficiency of the enzymatic reaction and the higher will be the response.
Also with the biosensor under consideration the peak current decreases from slower to faster flow rates; the corresponding background current varies only slightly.
The choice of the proper flow rate was guided by a few considerations. Basically it was intended to select a slow flow rate in order to obtain high signal responses. From this point of view 0.1 mL/min or even slower would be the value of choice. At this rate the peaks are very broad and one injection lasts for about 4.1 min. A flow of 0.2 mL/min increases the speed of analysis considerably by more than the double, whereas the signal is only about 20% lower than with 0.1 mL/min. In fact the detection is still sufficiently low and the sensitivity sufficiently high for unambiguous determination of glucose in blood plasma.
3.3.3. Calibration Curves and Statistics
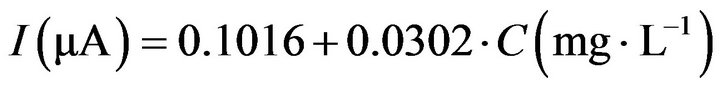
Calibration curves for the biosensor at different operating potentials (−100 mV, −150 mV, −200 mV vs. Ag/AgCl) were made with glucose in the concentration range from 10 mg/L to 1000 mg/L. A quasi-linear relation between concentration and signal could be obtained for glucose concentrations up to 200 mg/L with a sensitivity 1.2 nA L∙mg−1 (Equation (3)) and a correlation factor R2 = 0.9975.
 (3)
(3)
The detection limit (3σ) estimated from the standard deviation of FIA-peaks for 10 mg/L glucose concentration is 6.8 mg/L. The relative standard deviation for the repeatability of measurements for 100 mg/L glucose was 2.9% (n = 10 measurements), and the corresponding reproducibility was 11.9% (n = 5 sensors). Stability of the baseline is usually achieved 1 hour after application of the potential, and biosensor may be used for two weeks or even longer with no significant change of signal response.
3.3.4. Interferences
The glucose biosensor was tested for its susceptibility to possible interfering substances which might possibly occur in blood as a matrix component of the analyte. The following compounds were tested: uric acid, paracetamol, xanthine, hypoxanthine, and ascorbic acid. Uric acid, xanthine and hypoxanthine may be present in the blood as degradation products of purine compounds. Ascorbic acid is the most important water soluble antioxidant of the human body (vitamin C) and appears in the body fluids. Paracetamol is a frequently use analgetic, and may as such also occur in the plasma.
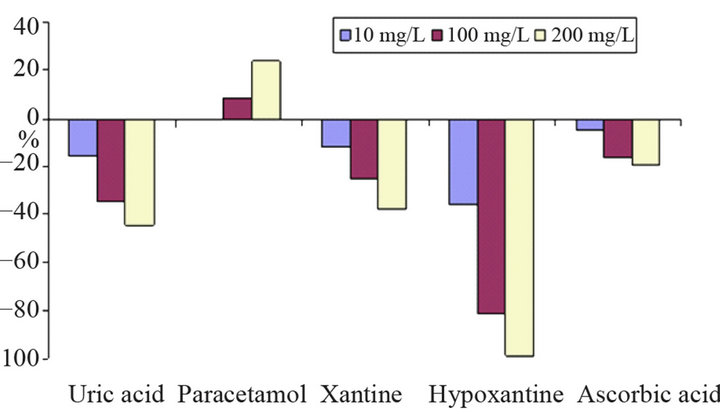
Interference measurements were performed in two ways: a) signals from the substances alone (Figure 11(a)), and b) influence of interferents on the signal of glucose in the same solution (Figure 11(b)). Hypoxanthine and uric acid cause significant signals already at low concentrations (10 mg/L). Ascorbic acid, the usual main interferent, produces only small peaks due to the low operating potential. In contrast to the other substances investigated paracetamol causes oxidation peaks at the applied potential.
 (a)
(a)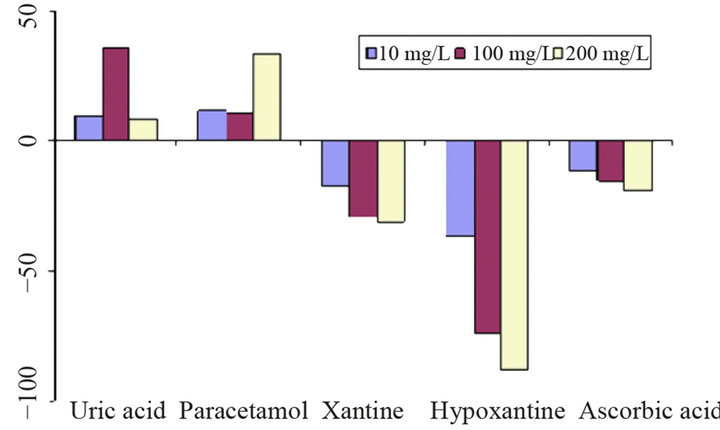 (b)
(b)
Figure 11. Interference of uric acid, paracetamol, xantine, hypoxantine and ascorbic acid on the determination of glucose; (a) separate solution method with interferent signal expressed as relative signal of 100 mg/L glucose; (b) mixed solution method showing the relative change of the signal of 100 mg/L glucose (100% = −148 nA); carrier phosphate buffer 0.1 M (pH 7.5), flow rate 0.2 mL/min, injection volume 200 µL, operation potential −200 mV.
Measured interferences such as hypoxanthine and xanthine cause a decrease of the glucose signal at low concentrations when they are in same solution.
The reason for this is a probable consumption of the enzymatic intermediate, i.e., hydrogen peroxide. In the same context also ascorbic decreases the glucose peak. Paracetamol and uric acidincrease the peak height of glucosein higher concentration, but in lower concentrations its interference is negligible.
Uric acid gives a reduction signal itself already which explains its signal-enhancing effect if it is occurring together with glucose. The reason for the influence of paracetamol is somehow unclear. It yields an oxidation signal itself at the electrode but increases the reduction response of hydrogen peroxide; probably the oxidized form of the interferent exerts an electron-shuttling effect on H2O2.
The level concentration of glucose in normal range is between 100 - 125 mg/dL [11], ascorbic acid and uric acid concentration range is 6 - 20 mg/L [12] and 20 - 65 mg/L [13], respectively. Compared to glucose, the concentrations of possible interferents in blood are small, particularly after the dilution 1 + 9 prior to analysis. Therefore it may be concluded that for blood samples with average concentrations of interferents the influence may be regarded as small andnegligible. Nevertheless for avoiding matrix effects the standard addition method can be applied as long as the concentrations are within the dynamic range of the sensor.
3.3.5. Samples
Finally the biosensor was tested for measuring glucose in a human sample, i.e. blood serum. After centrifugation of the whole blood, 1.00 mL of the obtained serum was diluted to 10 mL with phosphate buffer (0.1 M, pH 7.5) and was stored in the refrigerator. The determination of the glucose level in the blood was done with FIA mode using the standard addition method. This was done basically for two reasons: first to exclude effects of the matrix and interferents, and second to investigate if the linear relation between signal and different concentrations of glucose in the plasma is maintained. The results for a serum sample are presented in Table 1" target="_self"> Table 1.
A comparison of the slope from the calibration curve in pure buffer (1.12 nA×L×mg−1 from Equation (3)) with the one in blood plasma (1.18 nA×L×mg−1) suggests there is practically no influence from the diluted plasma matrix
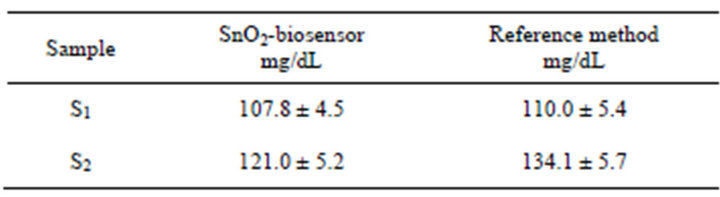
Table 1. Determination of glucose in blood
but that the external calibration curve with pure buffer solutions may be also used for the evaluation of blood glucose concentrations with reasonable precision.
Reference determinations were made with a comercial glucometer using whole blood. Glucose concentrations obtained with the biosensor (blood plasma) were multiplied with a factor of 1.15 in order to convert them to whole blood concentrations [14].
Two blood samples were measured, and the results between the method employing the new biosensor and the reference are in very good agreement (Table 1).
4. Conclusions
The work presented here has clearly demonstrated that heterogeneous carbon sensors (carbon paste, screen printed carbon electrodes) with tin dioxide as a mediator exhibit improve the performance for the determination of hydrogen peroxide compared to unmodified electrodes because the modifier lowers the over-potential for the electrochemical reduction of the analyte. The suggested reaction mechanism assumes the reduction of tin (IV) to tin (II) which in turn is oxidized by the enzymatic intermediate hydrogen peroxide.
The modified electrodes have a long life time, good stability and high sensitivity which can be exploited for the determination of hydrogen peroxide up to 400 mg/L.
A new glucose biosensor has been developed based on the thick film type of the new sensors characterized in this work. Thus screen printed carbon electrode have been modified with tin (IV) oxide and glucose oxidase entrapped in a Nafion film and could be used for the detection of glucose at physiological pH (7.5) and low negative operation potential (−200 mV) as an amperometric detector in flow injection analysis. The biosensor may be used for two weeks or even longer with continuous operation.
The influence of possible interferents (uric acid, paracetamol, xanthine, hypoxanthine and hypoxanthine) on the determination of glucose has been estimated. The extent of all investigated interferences is not fatal and can be eliminated by the use of the standard addition method. The new biosensor has been successfully applied to the determination of glucose in human blood plasma. The sensor seems also to promise to detect glucose in plant materials and food products.
5. Acknowledgements
L. B. wishes to acknowledge support for this work by the ӦAD-Büro für Austauschprogramme, Ӧsterreichische Rektorkonferenz and World University Service-Graz, Austria, for financial support. The authors are thankful to CEEPUS project CII-CZ-0212-02-0809-M-28727 for mobility grants.
REFERENCES
- N. W. Beyene, P. Kotzian, K. Schachl, H. Alemuc, E. Turkušic, A. Copra, H. Moderegger, I. Švancara, K. Vytras and K. Kalcher, “(Bio)Sensors Based on Manganese Dioxide-Modified Carbon Substrates: Retrospections, Further Improvements and Applications,” Talanta, Vol. 64, No. 5, 2004, pp. 1151-1159. doi:10.1016/j.talanta.2004.03.068
- G. Cui, J. Hyun Y. J. Yoo, S. W. Lee, H. Nam and G. S. Cha, “Differential Thick-Film Amperometric Glucose Sensor with an Enzyme-Immobilized Nitrocellulose Membrane,” Electroanalysis, Vol. 13, No. 3, 2001, pp. 224- 228. doi:10.1002/1521-4109(200103)13:3<224::AID-ELAN224>3.0.CO;2-N
- J. Wang, X. Zhang and L. Chen, “Comparison of Glucose Enzyme Electrodes Based on Dispersed Rhodium Particles and Cupric Hexacyanoferrate within Carbon Paste Transducers,” Electroanalysis, Vol. 12, No. 16, 2000, pp. 1277-1281. doi:10.1002/1521-4109(200011)12:16<1277::AID-ELAN1277>3.0.CO;2-M
- P. Kotzian, P. Brazdilova, K. Kalcher, K. Handlir and K. Vytras, “Oxides of Platinum Metal Group as Potential Catalysts in Carbonaceous Amperometric Biosensors Based on Oxidases,” Sensors and Actuators B, Vol. 124, No. 2, 2007, pp. 297-302. doi:10.1016/j.snb.2006.12.032
- K. Schachl, H. L. Alemu, K. Kalcher, J. Ježkova, I. Svancara and K. Vytřas, “Amperometric Determination of Hydrogen Peroxide with a Manganese Dioxide-Modified Carbon Paste Electrode Using Flow Injection Analysis,” Analyst, Vol. 122, No. 9, 1997, pp. 985-989. doi:10.1039/a701723e
- R. Garjonyte and A. Malinauskas, “Amperometric Sensor for Hydrogen Peroxide, Based on Cu2O or CuO Modified Carbon Paste Electrodes,” Fresenius’ Journal of Analytical Chemistry, Vol. 360, No. 1, 1998, pp. 122-123. doi:10.1007/s002160050655
- J. Hrbac, V. Halouzka, R. Zboril, K. Papadopoulos and T. Triantis, “Carbon Electrodes Modified by Nanoscopic Iron(III) Oxides to Assemble Chemical Sensors for the Hydrogen Peroxide Amperometric Detection,” Electroanalysis, Vol. 19, No. 17, 2007, pp. 1850-1854. doi:10.1002/elan.200703938
- P. Kotzian, P. Brázdilová, S. Řezková, K. Kalcher and K. Vytřas, “Amperometric Glucose Biosensor Based on Rhodium Dioxide-Modified Carbon Ink,” Electroanalysis, Vol. 18, No. 15, 2006, pp. 1499-1504. doi:10.1002/elan.200503549
- P. Kotzian, P. Brázdilová, K. Kalcher and K. Vytřas, “Determination of Hydrogen Peroxide, Glucose and Hypoxanthine Using (Bio)Sensors Based on Ruthenium Dioxide-Modified Screen-Printed Electrodes,” Analytical Letters, Vol. 38, No. 7, 2005, pp. 1099-1113. doi:10.1081/AL-200057205
- A. Veseli, A. Hajrizi, T. Arbneshi and K. Kalcher, “A New Amperometric Glucose Biosensor Based on Screen Printed Carbon Electrodes with Rhenium(IV)—Oxide as a Mediator,” Journal of Electrochemical Science and Engineering, Vol. 2, No. 4, 2012, pp. 199-210. doi:10.5599/jese.2012.0023
- American Diabetes Association, “Standards of Medical Care in Diabetes,” Diabetes Care, Vol. 29, No. S1, 2006, pp. 54-542.
- J. P. Moran, L. Cohen, J. M. Greene, G. Xu, E. B. Feldman, C. G. Hames and D. S. Feldman, “Plasma Ascorbic Acid Concentrations Relate Inversely to Blood Pressure in Human Subjects,” American Journal of Clinical Nutrition, Vol. 57, No. 2, 1993, pp. 213-217.
- K. K. Melinda and B. L. Firestein, “Altered Uric Acid Levels and Disease States,” The Journal of Phamacology and Experimental Therapeutics, Vol. 324, No. 1, 2008, pp. 1-7.
- K. G. M. M. Alberti and P. Z. Zimmet, “Definition, Diagnosis and Classification of Diabetes Mellitus and its Complications. Part 1: Diagnosis and Classification of Diabetes Mellitus Provisional Report of a WHO Consultation,” Diabetic Medicine, Vol. 15, No. 7, 1998, pp. 539- 553. doi:10.1002/(SICI)1096-9136(199807)15:7<539::AID-DIA668>3.0.CO;2-S
NOTES
*Corresponding author.