American Journal of Analytical Chemistry
Vol.4 No.1(2013), Article ID:26742,10 pages DOI:10.4236/ajac.2013.41004
An Ultra-sensitive LC Method for the Simultaneous Determination of Paracetamol, Carbamazepine, Losartan and Ciprofloxacin in Bulk Drug, Pharmaceutical Formulation and Human Serum by Programming the Detector
1Department of Pharmaceutical Chemistry, Faculty of Pharmacy, University of Karachi, Karachi, Pakistan
2Department of Chemistry, University of Karachi, Karachi, Pakistan
Email: *saeeda_khowaja@hotmail.com
Received October 23, 2012; revised November 20, 2012; accepted December 8, 2012
Keywords: Paracetamol; Carbamazepine; Losartan; Ciprofloxacin; Time Program
ABSTRACT
An ultra-sensitive LC method for the simultaneous quantitation of paracetamol, carbamazepine, losartan and ciprofloxacin have been developed and validated following the ICH guidelines at isobestic point and by programming the detector at individual wavelength of each component. The components were eluted by 50:50 v/v acetonitrile-water (pH 3.0) using a Bondapak, C18 (10 µm, 25 × 0.46 cm) column at flow rate of 1.0 mL∙min−1 with detection wavelength 240 nm at isobestic point and 245, 230, 206 and 272 nm for paracetamol, carbamazepine, losartan potassium and ciprofloxacin respectively by programming the detector. Linearity was found to be 0.5 - 24, 0.25 - 8.0, 0.4 - 12 and 0.75 - 10 µg∙mL−1 (R2 > 0.999) with detection limits 99, 20, 30 and 6.0 ng∙mL−1 respectively. Comparison study with time program method showed more sensitivity with calibration range of 0.4 - 12, 0.2 - 6.0, 0.1 - 3.0 and 0.25 - 8.0 µg∙mL−1 (R2 > 0.999) and LOD values 29, 11, 2.0 and 5.0 ng∙mL−1 respectively. Percent recoveries >98.37% from pharmaceutical formulation and human serum samples and RSD < 2% for inter-day and intra-day assay were obtained. The method was found to be robust and can be successfully applied for the determination of studied drugs in, pharmaceutical formulations and human serum without interference of excipients or endogenous components of serum.
1. Introduction
Since least decades, our research colleagues are involved in developing new liquid chromatographic method with UV detection for different classes of drugs including statins [1], NSAIDs [2], ACE inhibitors [3], H2-receptor antagonists [4], antidiabetic drugs [5], quinolones [6] and so on. These methods involve alone or simultaneous determination of drugs which are available in pharmacy or prescribed to the patients in combination with each other. Almost all of these methods have been developed and validated isocratically at isobestic point of studied drugs.
In this paper, we aimed to report the original approach that allows a rapid and economical ultra-sensitive RPHPLC method for the simultaneous determination of paracetamol (PCT), carbamazepine (CBZ), losartan potassium (LSR) and ciprofloxacin (CIP) in API, pharmaceutical formulation and in human serum at isobestic point and also by programming the detector at individual wavelength of each component without any undesired signals of tablet fillers and excipients or endogenous serum components.
PCT, chemically N-(4-hydroxyphenyl)ethanamide, is a non carcinogenic [7] commonly used analgesic and antipyretic non steroidal inflammatory drug frequently prescribed to relief the symptoms of fever, cough, cold and mild to moderate pain of everyday life like headache, backache muscular aches, joint pain and others [8,9]. CBZ, chemically 5 H-dibenzo[b,f]azepine-5-carbox-amide, is extensively used anti epileptic and mood stabilizing drug, also advised to treat bipolar affective disorder like resistant schizophrenia, ethanol withdrawal, restless leg syndrome, psychotic behavior associated with dementia and post-traumatic stress disorders [10,11]. It is usually taken in combination with other antiepileptic drugs such as phenytoin or valproic acid. LSR, the potassium salt of 2-n-butyl-4-chloro-5-hydroxymeth-yl-1-[(2%-(1H-tetra-zol- 5-yl)biphenyl-4-yl)methyl]imidazole is a competitive nonpeptide angiotensin II antagonist, first marketed in 1995. It is recommended for treating hypertension [12] and hypertensive patients with diabetic nephropathy. It is available alone or in combination with other low dose thiazide diuretic to achieve an additive antihypertensive effect. CIP, [1-cyclopropyl-6-fluoro-1,4-dihydro-4-oxo- 7(piperazinyl) quinolones-3 carboxylic acid], is a synthetic derivative of fluoroquinolones [13]. Along with its great medical importance for human, it has been found to be potential veterinary antibiotic and possesses broad spectrum activity against many pathogenic gram negative and gram-positive bacteria. Figure 1 shows the chemical structures of all the studied drugs.
 (a)
(a)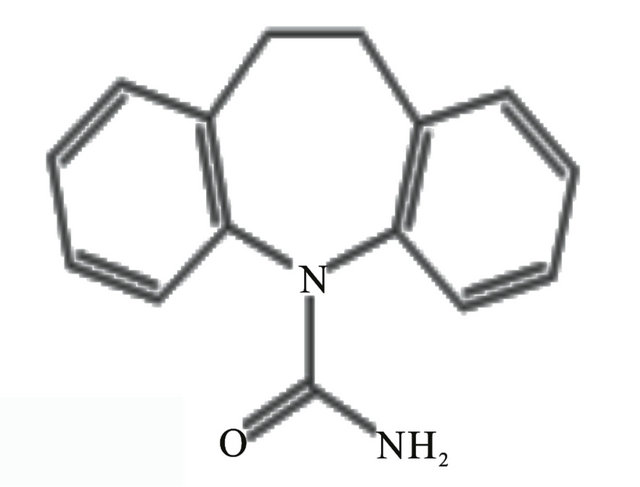 (b)
(b) (c)
(c)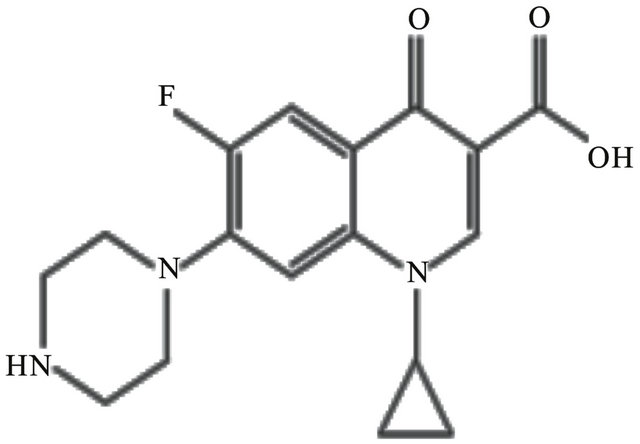 (d)
(d)
Figure 1. Chemical structures of PCT (a), CMZ (b), LSR (c) and CIP (d).
Literature survey revealed many of the methods with different analytical techniques including spectrophotometry, spectrofluorimetry, high performance liquid chromatography, capillary electrophoresis, FT-IR Raman spectrometry, chemiluminescene, flow injection analysis, voltametry and so on for alone or simultaneous determination of PCT [14-18], CBZ [19-25], LSR [26-30] and CIP [31-36] in dosage formulation and in body fluids.
2. Experimental
2.1. Standards and Reagents
50 µg∙mL−1 stock solutions of PCT (AGP pharmaceuticals Pvt Ltd), CIP (AGP pharmaceuticals Pvt Ltd), LSR (MSD) and CBZ (Novartis Pharma Pvt Ltd) were prepared and accordingly diluted. Pharmaceutical formulations Panadol® 500 mg (GlaxoSmithKline), Tegral® 200 mg (Novartis Pharma Pvt Ltd.), Cozaar® 25 mg (MSD) and Ciproxen® 250 mg (Bayer Pakistan Private Limited) were purchased from local pharmacy. HPLC grade methanol and 85% o-phosphoric acid were obtained from Merck Darmstadt, Germany. Double distilled de-ionized water was used throughout the analysis. Drug free human serum was obtained from blood sample collected from healthy donor at Fatmid Foundation Karachi.
2.2. Instrumentation
High performance liquid chromatographic system was equipped with Shimadzu model LC-20 AT VP solvent delivery pump, rheodyne manual injector fitted with a 20 µL loop and a SPD-20A Shimadzu UV visible detector. Data integration was performed by using Shimadzu CBM-102 communication Bus Module. The system was connected with Pentium IV installed with Shimadzu Class-GC 10 software (version 2) for data acquisition. Shimadzu 1800 UV-visible spectrophotometer was used for the determination of isosbestic point and individual λmax of analyte.
2.3. HPLC Condition
Chromatographic separation was carried out using a Bondapack, C18 (10 µm, 25 × 0.46 cm) column. The mobile phase was acetonitrile-water (50:50 v/v) whose pH was adjusted to 3.0 with o-phosphoric acid (85%). Prior to delivering in to the chromatographic system, the mobile phase was filtered with 0.45 µm pore size filter millipore vacuum filter system and degassed with an ultrasonic bath (LC 30 H). The flow rate was adjusted at 1.0 mL∙min−1 at room temperature for elution of all the analyte. Initially, the peak response was monitored at isobestic point of 240 nm and then the spectrophotometric detector was operated by programming it at 245, 230, 206 and 272 nm for PCT, CBZ, LSR and CIP respectively.
2.4. Preparation of Calibration Curves
Calibration standards were prepared by diluting 50 µg∙mL−1 stock solution of each drug in to 0.5 - 24, 0.25 - 8.0, 0.4 - 12.0 and 0.75 - 20 µg∙mL−1 for isobestic point and 0.4 - 12, 0.2 - 6.0, 0.1 - 3.0 and 0.25 - 8.0 for time program method for PCT, CMZ, LSR and CIP. These working standard solutions were prepared once and analyzed daily for interday and intraday precision of the method. 20 µL of degassed and filtered (0.45 µm pore size) sample was injected into the system.
2.5. Sample Preparation
2.5.1. Pharmaceutical Preparations
The method was successfully applied for the dosage form. For this purpose, ten tablets of each sample were powdered to obtain homogenous mixture. The amount equivalent to 10 mg of drug was stirred well in diluent and then sonicated for complete solubilization. The resulting solutions were then filtered and the volume of each flask was completed. The sample flasks were prepared and analyzed following the procedure given for calibration standards.
2.5.2. Drug Serum Solution
Blood sample was collected from a human donor at Fatmid Foundation Karachi in an Ethylene Diamine Tetra Acetic Acid (EDTA) glass tube and centrifuged at 1600 × g for 10 min at 4˚C. The plasma collected was treated with 9.0 mL acetonitrile (per mL plasma) and vortexed for one minute followed by centrifugation for 10 minutes at 10,000 rpm. The clear serum solution thus obtained in supernatant was spiked with drug solutions to produce desired concentrations of PCT, CMZ, LSR and CIP in human serum for analysis at isobestic point and at individual λmax.
2.6. Method Development and Optimization
To optimize the operating conditions for isocratic liquid chromatographic detection of PCT, CMZ, LSR and CIP at isobestic point and at individual λmax, a number of chromatographic parameters such as the mobile phase composition, pH, flow rate and wavelength were varied and the best conditions for better separation were selected.
Reversed phase chromatographic column of two different particulate like Bondapak and Discovery were tried with different mobile phase compositions. The mobile phase composition was optimized using different ratios of ACN: H2O and MeOH: H2O with variable pH. Flow rates ranging from 0.8 - 1.5 were applied in isocratic mode for the analysis. The suitable detector wavelength was chosen for the analysis at isobestic point by considering the UV-scan of each analyte, taken on Shimadzu 1800 UV-vis spectrophotometer. For the time program analysis, the detector was programmed by adjusting at 245, 230, 206 and 272 nm for PCT, CMZ, LSR and CIP respectively.
2.7. Method Validation
The standard ICH guidelines for validation of analytical methods have recommended the accomplishment of system suitability test, specificity, linearity, accuracy precision, detection and quantitation limits and robustness of the method.
For specificity studies, the chromatograms of blank serum, excipients and filler of each tablet, spiked serum sample and solution of pharmaceutical formulation were analyzed. The 10% solutions of commonly present excipients i.e.: lactose monohydrate, magnesium stearate, sucrose, talc and starch were prepared in methanol and analyzed.
The system suitability studies were carried out by equilibrating the HPLC system with initial mobile phase composition, followed by ten injections of same standard and detector response was observed. The system suitability was evaluated on each day of method validation and the parameters including capacity factors (k’), theoretical plates (N), tailing factor (T), resolution (Rs), and separation factor (α) were calculated.
For linearity, accuracy and precision, six calibration standards ranging from 0.5 - 24, 0.25 - 8.0, 0.4 - 12.0 and 0.75 - 20 µg∙mL−1 for isobestic point and 0.4 - 12, 0.2 - 6.0, 0.1 - 3.0 and 0.25 - 8.0 for time program method for PCT, CMZ, LSR and CIP respectively for bulk drug and pharmaceutical formulation and three serum samples were analyzed in five replicates on three separate days. Calibration curves were constructed for all the analytes in mobile phase and spiked serum samples by plotting concentration vs. area and regression characteristics were calculated.
Accuracy of the method was tested from pharmaceutical formulations and spiked serum sample at above mentioned concentration levels of each analyte by calculating recovery from the formulae (%Recovery = [C]/[A] × 100), where [C] and [A] are the peak response of sample and reference standard at specific concentration respectively.
The inter-day and intra-day precision of the method was assessed at the same concentrations for bulk drug and human serum for three days by calculating percent relative standard deviation using formulae, (% RSD = SD /M × 100), where SD and M are the standard deviation and mean of the peak area at specific concentration.
The detection and quantitation limits were determined at the concentration where signal to noise ratio was three times and ten times to the baseline noise respectively. These were calculated from the formulae; LOD = 3.3 × SD/α and LOQ = 10 × SD/α, where SD and α are the standard deviation and slope of the calibration curve.
Minor changes in the chromatographic parameters were intentionally introduced, like mobile phase composition was changed to ±2 mL, pH up to ±2 and flow rate was varied to 0.1 mL∙min−1 and their effect was observed on analytical results.
3. Results and Discussion
Epilepsy is a chronic medical condition characterized by seizures [37,38], which is not cured completely but controlled by anticonvulsant treatment. CBZ is a drug of choice [39], increasingly being utilized anticonvulsant in modern society [40] and is completely consumed by the body [41]. Hypertension is a major health problem in which the blood pressure in the arteries is chronically elevated. One of its causes may be changes in autonomic functions which also brings about epileptic seizures [42]. Hypertension is usually not identified by any symptom, and is detected through screening when the patient visits to physician for an unrelated problem. LSR is an oral drug of class angiotensin II receptor antagonist, prescribed to the hypertensive patients who cannot put up with ACE inhibitors or calcium channel blockers. During anticonvulsant therapy, patients found to have symptoms of urinary tract infections, upper respiratory tract infection, skin and soft tissue infection, are cured with fluoroquinolones like CIP along with CBZ [43]. Analgesic drugs, like PCT, one of the most extensively employed drugs in the world, may generally be taken with other medication to relief the pains associated with different body parts.
3.1. Method Development and Optimization
The optimized analytical method was developed by evaluating initial chromatographic parameters and selecting the efficient conditions suitable for reliable LC method. Mobile phase methanol-water with variable ratios 80:20, 70:30, 60:40 and 50:50 showed poor separation of components, and therefore acetonitrile-water was tried which exhibited good separation and high resolution in the ratio of 50:50 with pH 3.0. The flow rate was adjusted to 1.0 mL∙min−1. Separation was achieved at isobestic point of 240 nm. The UV spectra showing λmax and chromatogram showing retention times of each component are given in Figures 2 and 3 respectively.
3.2. Method Validation
The validation parameters accomplished were system suitability test, robustness, ruggedness, linearity, accuracy, precision, selectivity, specificity and detection and quantitation limits. These parameters were studied according to ICH guidelines.
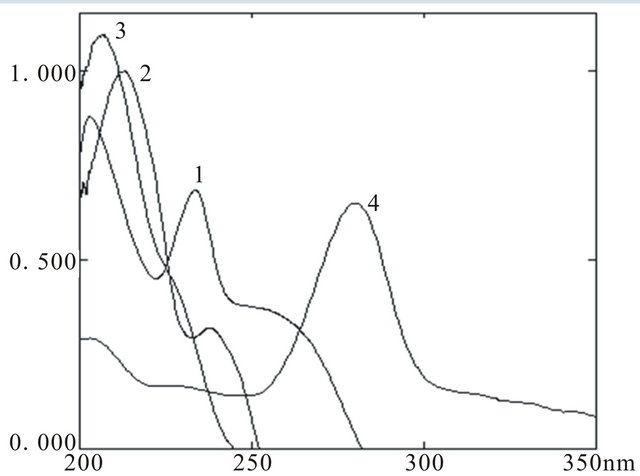
Figure 2. UV spectra of PCT (1), CMZ (2), LSR (3) and CIP (4).
 (a)
(a) (b)
(b)
Figure 3. Representative chromatogram of PCT (1), CMZ (2), LSR (3) and CIP (4) in API (a) and serum (b).
3.2.1. Specificity
The mobile phase acetonitrile-water in the ratio of 50:50 with pH adjusted to 3.0 was found to be suitable for separation and elution of drugs showing good peak shape and symmetry. The conditions were optimized with respect to specificity, resolution and time of analysis. Chromatogram showed no other peak besides the four active components with retention times 2.63, 4.49, 5.30 and 8.65 min for PCT, CMZ, LSR and CIP respectively. Figure 4 showed the good separation of components in presence of tablet excipients and human serum.
3.2.2. System Suitability Test
System suitability tests are the essential part of liquid chromatography and performed to endorse the resolution of the chromatographic system. It was observed that the number of theoretical plates was found to be greater than 2000 and tailing factor was less than 2 for all the studied drugs. Also the resolution was less than 2 confirming the suitability of the method (Table 1).
3.2.3. Linearity
All calibration curves plotted between concentrations of drug against peak area for concentration range 0.5 - 24, 0.25 - 8.0, 0.4 - 12.0 and 0.75 - 20 µg∙mL−1 at isobestic point for PCT, CMZ, LSR and CIP respectively were found to be linear with R2 greater than 0.997. The regression characteristics for drugs including linearity, slope, intercept, correlation coefficient, standard error and standard error estimate are given in Table 2.
3.2.4. Precision
Precision was investigated by means of percent relative standard deviation. Six concentration level in the range of 0.5 - 24, 0.25 - 8.0, 0.4 - 12.0 and 0.75 - 20 µg∙mL−1 at isobestic point for PCT, CMZ, LSR and CIP respectively and three concentration levels 3.0, 6.0 and 12 µg∙mL−1 for PCT, 1.0, 2.0 and 4.0 µg∙mL−1 for CMZ, 1.5, 3.0 and 6.0 µg∙mL−1 for LSR and 2.5, 5.0 and 10.0 µg∙mL−1 for CIP for human serum were analyzed within the same day (intra-day) for repeatability and for two consecutive days (inter-day) for intermediate precision. %RSD for both inter-day and intra-day precision was found to be in the range of 0.11 - 2.01 ascertaining the good precision of the method (Table 3).
3.2.5. Accuracy
Accuracy of the proposed method was assessed at isobestic
Table 1. System suitability parameters.
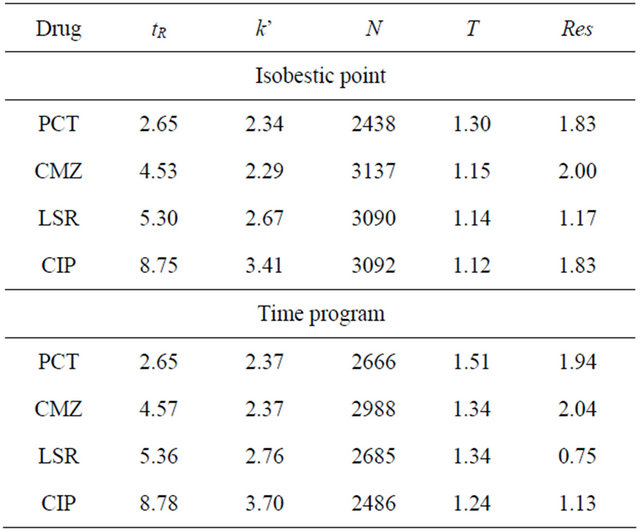
tR = retention times; k’ = capacity factor; N = theoretical plates; T = tailing factor; Res = resolution; α = separation factor.
Table 2. Regression characteristics and sensitivity of the method.
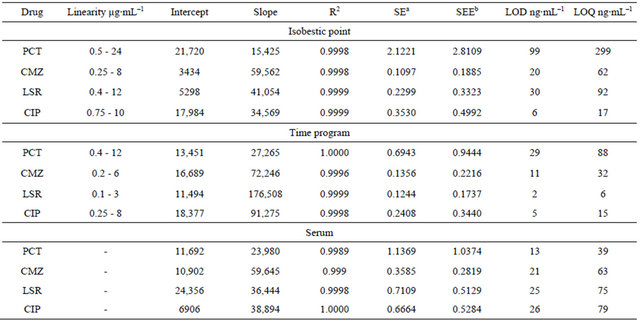
aStandard error; bStandard error estimate.
Table 3. Precision of the proposed method.
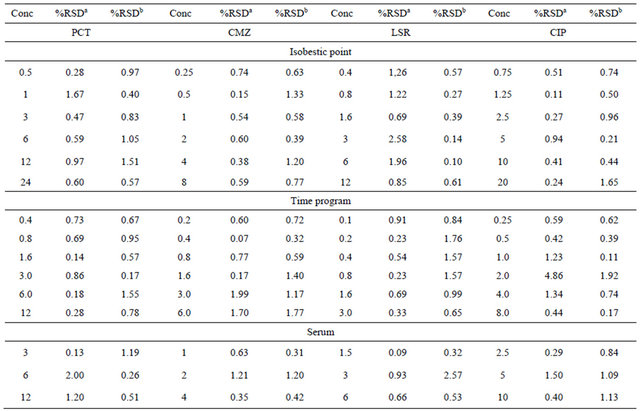
aIntra-day %RSD; bInter-day %RSD.
point by five times analysis at six calibration standards ranging from 0.5 - 24, 0.25 - 8.0, 0.4 - 12.0 and 0.75 - 20 µg∙mL−1 for PCT, CMZ, LSR and CIP respectively for the pharmaceutical formulation and three concentration levels 3.0, 6.0 and 12 µg∙mL−1 for PCT, 1.0, 2.0 and 4.0 µg∙mL−1 for CMZ, 1.5, 3.0 and 6.0 µg∙mL−1 for LSR and 2.5, 5.0 and 10.0 µg∙mL−1 for CIP for samples of human serum. It was presented in terms of percent recovery and was found to be 99.44% - 102.27%, 98.37% - 100.14%, 98.19% - 101.76% and 99.41% - 100.68% for PCT, CMZ, LSR and CIP respectively. The accuracy data is mentioned in Table 4.
3.2.6. Detection and Quantitation Limits
Detection and quantitation limits are the signal to noise ration three times or ten times to the baseline noise and were determined to be 99, 20, 30, 6 ng∙mL−1and 299, 62, 92, 17 ng∙mL−1 for bulk drug and 13, 21, 25, 26 ng∙mL−1 and 39, 63, 75, 79 ng∙mL−1 for human serum for PCT, CMZ, LSR and CIP respectively. Table 2 represents the data.
3.2.7. Robustness
To ensure the consistency and reliability of developed analytical method, small deliberate changes in the chromatographic parameters were made and their subsequent effect was observed. It was observed that the change in mobile phase composition and flow rate show shifting of retention time up to 0.1% which is negligible, where as change in pH did not affect the results. However, variation in wavelength influenced the area under curve of peak. Overall, the method was found to be robust. Data is tabulated in Table 5.
3.3. Programming the Detector
The individual λmax of each drug was taken on Shimadzu 1800 UV-visible spectrophotometer which was found to be 245, 230, 206 and 272 nm. The detector was programmed at 245 nm for 0 - 3.5 min, 230 nm for 3.6 - 4.9 min, 206 nm for 5.0 - 6.5 min and 272 nm for 6.6 - 9.0 min for complete elution of PCT, CMZ, LSR and CIP respectively. The analytical method was found to be more sensitive showing good separation and high resolution of each component. The technique was applied for the simultaneous determination of all the studied analytes in bulk drug, human serum and pharmaceutical formulation by programming the detector (Figure 5).
The linearity of the proposed method was found to be 0.4 - 12, 0.2 - 6.0, 0.1 - 3.0 and 0.25 - 8.0 µg∙mL−1 for PCT, CMZ, LSR and CIP respectively with correlation 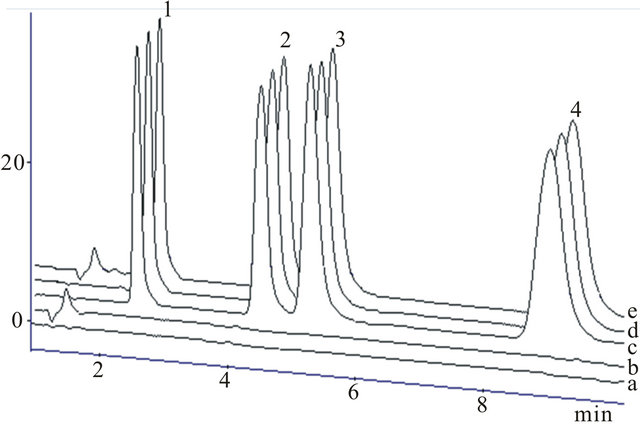
Figure 4. Chromatograms of (a) solvent, (b) blank serum, (c) PCT, CMZ, LSR and CIP in reference standard, (d) in pharmaceutical formulations and (e) serum sample spiked with standards for PCT (1), CMZ (2), LSR (3) and CIP (4).
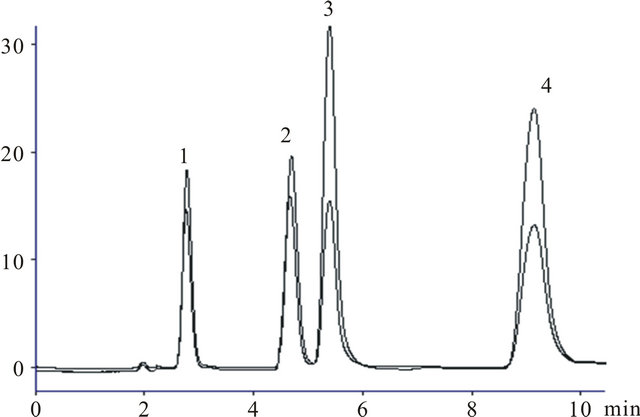
Figure 5. Representative chromatogram of PCT (1), CMZ (2), LSR (3) and CIP (4) at isobestic point and at individual λmax.
coefficient greater than 0.998. The regression data calculated from calibration curve constructed between peak area and concentration of each analyte including slope, intercept, correlation coefficient, standard error and standard error estimate are given in (Table 2).
The % recovery of all the analytes were in the range of 99.77 - 100.18 and 98.51 - 100.42 for human serum and pharmaceutical formulation and inter-day and intra-day precision was in the range of 0.14 - 1.99 assuring the accuracy and precision of method. The sensitivity of the method was enhanced by programming the detector at individual wavelength and it showed LOD values 29, 112.0 and 5.0 ng∙mL−1 for PCT, CMZ, LSR and CIP respectively.
3.4. Application of Proposed Method
The developed and validated LC method enables the simultaneous determination and quantification of PCT, CMZ, LSR and CIP in reference standard, pharmaceutical formulation and in human serum because of good separation and resolution of chromatographic peaks. Separation was accomplished without interference of undesired excipients of tablet or serum substances. The results obtained showed good percent recovery within the acceptable limits indicating the accuracy and precision of the method. The correlation coefficient, detection limit and variance speak of good sensitivity of the proposed method. Therefore, it is concluded that the proposed method is free from constant error and is suitable for the simultaneous determination of studied drugs in pharmaceutical formulation and in human serum.
Table 4. Recovery of PCT, CMZ, LSR and CIP
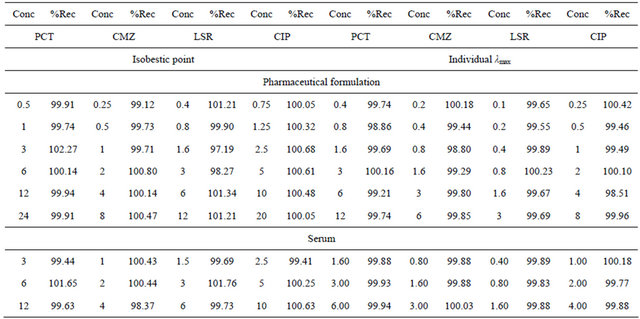
Table 5. Robustness.
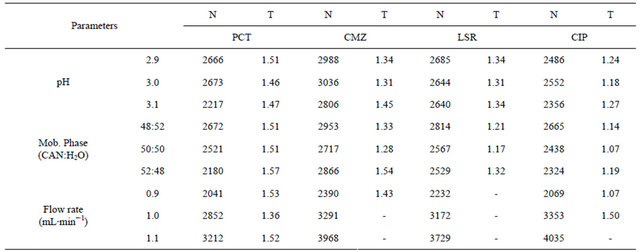
N = Theoretical plates; T = Tailing factor.
4. Conclusion
This paper reports quick, precise and simple isocratic HPLC method for the determination of PCT, CMZ, LSR and CIP in pharmaceutical formulation and human serum as well. All the necessities like accuracy, linearity, re covery and precision are accomplished for the reliability of developed method. The chromatographic run time of 10 min allows the analysis of all four analytes with acceptable chromatographic resolution in a short period of time. All calibration curves were found to be linear with correlation coefficient greater than 0.998. The RSD values were less than 3%. The analytical results of samples were in accordance with those of standards in the same concentration. Chromatograms were free from excipients or serum interferences. The proposed analytical method is suitable for routine analysis in quality control laboratories.
5. Acknowledgements
Ms Saeeda Nadir Ali greatly acknowledges Higher Education Commission, Pakistan for providing Indigenous Scholarship for this research work.
REFERENCES
- N. Sultana, M. S. Arayne and W. Shahzad, “Simultaneous Determination of Ceftriaxone Sodium and Statin Drugs in Pharmaceutical Formulations and Human Serum by RPHPLC,” Journal of the Chilean Chemical Society, Vol. 55, No. 2, 2010, pp. 193-198. doi:10.4067/S0717-97072010000200010
- N. Sultana, M. S. Arayne, R. Siddiqui and S. Naveed, “RP-HPLC Method for the Simultaneous Determination of Lisinopril and NSAIDs in API, Pharmaceutical Formulations and Human Serum,” American Journal of Analytical Chemistry, Vol. 3, No. 2, 2012, pp. 147-152. doi:10.4236/ajac.2012.32021
- M. S. Arayne, N. Sultana, A. Tabassum, S. N. Ali and S. Naveed, “Simultaneous LC Determination of Rosuvastatin, Lisinopril, Captopril, and Enalapril in API, Pharmaceutical Dosage Formulations, and Human Serum,” Medicinal Chemistry Research, Vol. 21, No. 12, 2012, pp. 4542- 4548. doi:10.1007/s00044-012-9997-x
- N. Sultana, M. S. Arayne, S. Shamim and A. Naz, “Validated Method for the Simultaneous Determination of Gemifloxacin and H2-receptor Antagonists in Bulk, Pharmaceutical Formulations and Human Serum by RP-HPLC; In-vitro Applications,” Journal of the Chinese Chemical Society, Vol. 58, No. 5, 2011, pp. 629-636. doi:10.1002/jccs.201190098
- N. Sultana, M. Saeed Arayne, S. N. Ali and M. H. Zuberi, “Simultaneous Determination of Glipizide and Glimepride by Rp-Hplc in Dosage Formulations and in Human Serum,” Medicinal Chemistry Research, Vol. 21, No. 9, 2012, pp. 2443-2448. doi:10.1007/s00044-011-9772-4
- M. S. Arayne, N. Sultana, S. B. S. Rizvi and U. Haroon, “In Vitro Drug Interaction Studies of Atorvastatin with Ciprofloxacin, Gatifloxacin, and Ofloxacin,” Medicinal Chemistry Research, Vol. 19, No. 8, 2010, pp. 717-731. doi:10.1007/s00044-009-9225-5
- K. Bergman, L. Muller and S. W. Teigen, “The Genotoxicity and Carcinogenicity of Paracetamol: A Regulatory (Re) View,” Mutation Research/Fundamental and Molecular Mechanisms of Mutagenesis, Vol. 349, No. 2, 1996, pp. 263-288.
- R. B. Lipton, M. E. Bigal, K. B. Kolodner, P. B. Gorelick, K. Wilks, M. Schoebelock and G. Davidai, “Acetaminophen in the Treatment of Headaches Associated with Dipyridamole-Aspirin Combination,” Neurology, Vol. 63, No. 6, 2004, pp. 1099-1101. doi:10.1212/01.WNL.0000138494.66691.07
- C. J. Nikles, M. Yelland, C. Del Mar and D. Wilkinson, “The Role of Paracetamol in Chronic Pain: An EvidenceBased Approach,” American Journal of Therapeutics, Vol. 12, No. 1, 2005, pp. 80-91. doi:10.1097/00045391-200501000-00011
- J. B. Leikin and F. P. Paloucek, “Poisoning and Toxicology, Handbook,” 4th Edition, Informa Healthcare, New York, 2008.
- L. J. Dodds, Ed., “Drugs in Use: Clinical Case Studies for Pharmacists,” Pharmaceutical Press, London, 2010, p. 357.
- D. J. Carini, D. D. Christ, J. V. Duncia and M. E. Pierce, “The Discovery and Development of Angiotensin II Antagonists,” In: R. T. Borchardt, R. M. Freidinger, T. K. Sawyer and P. L. Smith, Eds., Integration of Pharmaceutical Discovery and Development: Case Histories, Plenum Press, New York, 1998, pp. 29-56.
- A. A. J. Torriero, E. Salinas, J. Raba and J. J. Silber, “Sensitive Determination of Ciprofloxacin and Norfloxacin in Biological Fluids Using an Enzymatic Rotating Biosensor,” Biosensors and Bioelectronics, Vol. 22, No. 1, 2006, pp. 109-115. doi:10.1016/j.bios.2005.12.004
- V. P. Godse, M. N. Deodhar, A. V. Bhosale, R. A. Sonawane, P. S. Sakpal, D. D. Borkar and Y. S. Bafana, “Reverse Phase HPLC Method for Determination of Aceclofenac and Paracetamol in Tablet Dosage Form,” Asian Journal of Research Chemistry, Vol. 2, No. 1, 2009, pp. 37-40.
- D. T. T. An and V. D. Hoang, “Simultaneous Determination of Paracetamol and Codeine Phosphate in Combined Tablets by First-Order Derivative and Ratio Spectra FirstOrder Derivative UV Spectrophotometry,” Asian Journal of Research Chemistry, Vol. 2, No. 2, 2009, pp. 143-147.
- B. Dejaegher, M. S. Bloomfield, J. Smeyers-Verbeke and Y. Vander Heyden, “Validation of a Fluorimetric Assay for 4-Aminophenol in Paracetamol Formulations,” Talanta, Vol. 75, No. 1, 2008, pp. 258-265. doi:10.1016/j.talanta.2007.11.029
- R. N. Goyal, V. K. Gupta and S. Chatterjee, “Voltammetric Biosensors for the Determination of Paracetamol at Carbon Nanotube Modified Pyrolytic Graphite Electrode,” Sensors and Actuators B: Chemical, Vol. 149, No. 1, 2010, pp. 252-258. doi:10.1016/j.snb.2010.05.019
- S. S. Nair, S. A. John and T. Sagara, “Simultaneous Determination of Paracetamol and Ascorbic Acid Using Tetraoctylammonium Bromide Capped Gold Nanoparticles Immobilized on 1,6-Hexanedithiol Modified Au Electrode,” Electrochimica Acta, Vol. 54, No. 27, 2009, pp. 6837-6843. doi:10.1016/j.electacta.2009.06.077
- C. E. Leite, G. O. Petersen, A. Lunardelli and F. V. Thiesen, “A High-Performance Liquid Chromatography Method for the Determination of Carbamazepine and Carbamazepine-10,11-Epoxide and Its Comparison with Chemiluminescent Immunoassay,” Clinical Chemistry and Laboratory Medicine, Vol. 47, No. 4, 2009, pp. 458-463. doi:10.1515/CCLM.2009.105
- L. Hu, H. M. Martin, O. Arce-Bulted, M. N. Sugihara, K. A. Keating and T. J. Strathmann, “Oxidation of Carbamazepine by Mn (VII) and Fe (VI): Reaction Kinetics and Mechanism,” Environmental Science & Technology, Vol. 43, No. 2, 2008, pp. 509-515. doi:10.1021/es8023513
- C. Wang, Z. Wang, D. Han, Q. Wu and X. Zang, “Analysis of Carbamazepine in Tablet and Human Serum by Sweeping-Micellar Electrokinetic Chromatography Method,” Analytical Letters, Vol. 39, No. 9, 2006, pp. 1927- 1939. doi:10.1080/00032710600721746
- R. J. Perchalski and B. J. Wilder, “Rapid Gas-Liquid Chromatographic Determination of Carbamazepine in Plasma,” Clinical Chemistry, Vol. 20, No. 4, 1974, pp. 492-493.
- S. S. Kalanur and J. Seetharamappa, “Electrochemical Oxidation of Bioactive Carbamazepine and Its Interaction with DNA,” Analytical Letters, Vol. 43, No. 4, 2010, pp. 618-630. doi:10.1080/00032710903406870
- M. S. Cámara, C. Mastandrea and H. C. Goicoechea, “Chemometrics-Assisted Simple UV-Spectroscopic Determination of Carbamazepine in Human Serum and Comparison with Reference Methods,” Journal of Biochemical and Biophysical Methods, Vol. 64, No. 3, 2005, pp. 153-166. doi:10.1016/j.jbbm.2005.07.001
- C. Huang, Q. He and H. Chen, “Flow Injection Photochemical Spectrofluorimetry for the Determination of Carbamazepine in Pharmaceutical Preparations,” Journal of Pharmaceutical and Biomedical Analysis, Vol. 30, No. 1, 2002, pp. 59-65. doi:10.1016/S0731-7085(02)00200-5
- L. Yang, T. Guo, D. Y. Xia and L. S. Zhao, “Pharmacokinetics of Losartan and Its Active Carboxylic Acid Metabolite E-3174 in Five Ethnic Populations of China,” Journal of Clinical Pharmacy and Therapeutics, Vol. 37, No. 2, 2012, pp. 226-231. doi:10.1111/j.1365-2710.2011.01279.x
- R. N. Rao, S. S. Raju, R. M. Vali and G. G. Sankar, “Liquid Chromatography-Mass Spectrometric Determination of Losartan and Its Active Metabolite on Dried Blood Spots,” Journal of Chromatography B, Vol. 902, 2012, pp. 47-54. doi:10.1016/j.jchromb.2012.06.013
- M. G. Quaglia, E. Donati, G. Carlucci, P. Mazzeo and S. Fanali, “Determination of Losartan and Hydrochlorothiazide in Tablets by CE and CEC,” Journal of Pharmaceutical and Biomedical Analysis, Vol. 29, No. 6, 2002, pp. 981-987. doi:10.1016/S0731-7085(02)00138-3
- N. Erk, “Three New Spectrophotometric Methods Applied to the Simultaneous Determination of Hydrochlorothiazide and Irbesartan,” Die Pharmazie—An International Journal of Pharmaceutical Sciences, Vol. 58, No. 8, 2003, 2003, pp. 543-548.
- A. R. Omayma, “Electrochemical Study of Hydrochlorothiazide and Its Determination in Urine and Tablets,” Journal of Pharmaceutical and Biomedical Analysis, Vol. 34, No. 2, 2004, pp. 433-440. doi:10.1016/S0731-7085(03)00497-7
- M. I. Pascual-Reguera, G. P. Parras and A. M. Diaz, “A Single Spectroscopic Flow-Through Sensing Device for Determination of Ciprofloxacin,” Journal of Pharmaceutical and Biomedical Analysis, Vol. 35, No. 4, 2004, pp. 689-695. doi:10.1016/j.jpba.2004.03.002
- M. S. Attia, Amr A. Essawy and A. O. Youssef, “Europium-Sensitized and Simultaneous pH-Assisted Spectrofluorimetric Assessment of Ciprofloxacin, Norfloxacin and Gatifloxacin in Pharmaceutical and Serum Samples,” Journal of Photochemistry and Photobiology A: Chemistry, Vol. 236, 2012, pp. 26-34. doi:10.1016/j.jphotochem.2012.03.007
- S. Chen, F. Ding, Y. Liu and H. Zhao, “Electrochemiluminescence of Terbium (III)-Two Fluoroquinolones-Sodium Sulfite System in Aqueous Solution,” Spectrochimica Acta Part A: Molecular and Biomolecular Spectroscopy, Vol. 64, No. 1, 2006, pp. 130-135. doi:10.1016/j.saa.2005.07.006
- S. M. Esponda, M. E. T. Padran, Z. S. Ferrera and J. J. S. Rodríguez, “Solid-Phase Microextraction with Micellar Desorption and HPLC-Fluorescence Detection for the Analysis of Fluoroquinolones Residues in Water Samples,” Analytical and Bioanalytical Chemistry, Vol. 394, No. 4, 2009, pp. 927-935. doi:10.1007/s00216-009-2629-8
- M. Hernandez, F. Borrull and M. Calull, “Determination of Quinolones in Plasma Samples by Capillary Electrophoresis Using Solid-Phase Extraction,” Journal of Chromatography B: Biomedical Sciences and Applications, Vol. 742, No. 2, 2000, pp. 255-265. doi:10.1016/S0378-4347(00)00169-9
- R. E. Ionescu, N. Jaffrezic-Renault, L. Bouffier, C. Gondran, S. Cosnier, D. G. Pinacho, M. P. Marco, F. J. Sánchez-Baeza, T. Healy and C. Martelet, “Impedimetric Immunosensor for the Specific Label Free Detection of Ciprofloxacin Antibiotic,” Biosensors and Bioelectronics, Vol. 23, No. 4, 2007, pp. 549-555.
- B. S. Chang and D. H. Lowenstein, “Epilepsy,” New England Journal of Medicine, Vol. 349, No. 13, 2003, pp. 1257-1266. doi:10.1056/NEJMra022308
- J. S. Duncan, J. W. Sander, S. M. Sisodiya and M. C. Walker, “Adult Epilepsy,” Lancet, Vol. 367, No. 9516, 2006, pp. 1087-1100. doi:10.1016/S0140-6736(06)68477-8
- R. H. Mattson, J. A. Cramer, J. F. Collins, D. B. Smith, A. V. Delgado-Escueta, T. R. Browne, P. D. Williamson, D. M. Treiman, J. O. McNamara, C. B. McCutchen, R. W. Homan, W. E. Crill, M. F. Lubozynski, N. P. Rosenthal and A. Mayersdorf, “Comparison of Carbamazepine, Phenobarbital, Phenytoin, and Primidone in Partial and Secondarily Generalized Tonic-Clonic Seizures,” New England Journal of Medicine, Vol. 313, No. 3, 1985, pp. 145- 151. doi:10.1056/NEJM198507183130303
- Y. Zhang, S. U. Geißen and C. Gal, “Carbamazepine and Diclofenac: Removal in Wastewater Treatment Plants and Occurrence in Water Bodies,” Chemosphere, Vol. 73, No. 8, 2008, pp. 1151-1161. doi:10.1016/j.chemosphere.2008.07.086
- G. M. Escandar, D. González Gómez, A. E. Mansilla, A. M. de la Peña and H. C. Goicoechea, “Determination of Carbamazepine in Serum and Pharmaceutical Preparations Using Immobilization on a Nylon Support and Fluorescence Detection,” Analytica Chimica Acta, Vol. 506, No. 2, 2004, pp. 161-170. doi:10.1016/j.aca.2003.11.014
- M. I. B. M. I. Beig, R. C. R. Chandra, A. T. A. Talwar, M. F. M. Fahim and A. K. A. Katyal, “Epileptic Seizure-Induced Hypertension and Its Prevention by Calcium Channel Blockers: A Real-Time Study in Conscious Telemetered Rats,” Canadian Journal of Physiology and Pharmacology, Vol. 87, No. 7, 2009, pp. 572-580. doi:10.1139/Y09-034
- A. Shahzadi, I. Javed, B. Aslam, F. Muhammad, M. R. Asi and M. Y. Ashraf, “Therapeutic Effects of Ciprofloxacin on the Pharmacokinetics of Carbamazepine in Healthy Adult Male Volunteers,” Pakistan Journal of Pharmaceutical Sciences, Vol. 24, No. 1, 2011, pp. 63-68.
NOTES
*Corresponding author.