American Journal of Analytical Chemistry
Vol.3 No.11(2012), Article ID:24469,9 pages DOI:10.4236/ajac.2012.311098
A Stability Indicating UPLC Method for Finasteride and Its Related Impurities
1Sri Krishna Chaitanya College of Pharmacy, Madanapalle, India
2Department of Chemistry, JNTUA College of Engineering, Pulivendula, India
3Jawaharlal Nehru Technological (JNT) University, Anantapur, India
4Bioanalytical Department, Integrated Product Development, Dr. Reddy’s Laboratories Ltd., Bachupally, India
Email: *kishorekumarhotha@gmail.com
Received September 2, 2012; revised October 2, 2012; accepted October 11, 2012
Keywords: RP-UPLC; Forced Degradation; Validation; Finasteride; Method Development
ABSTRACT
The objective of the present research work is to develop a gradient, reversed-phase liquid chromatographic (RP-UPLC) method for the determination of Finasteride in pharmaceutical bulk drugs for assay and its related impurities. The chromatographic separation was achieved on a Waters ACQUITYTM UPLC BEH Phenyl Column (150 mm × 2.1 mm, 1.7 µm), The gradient LC method employs solutions A and B as mobile phase. The solution A Contains 2.5 mM ortho phosphoric acid (Buffer) and solution B contains a mixture of acetonitrile and water in the ratio of (90:10 v/v). The flow rate was 0.22 ml/min and the detection wavelength was 210 nm. In the developed UPLC method, the resolution between Finasteride and its potential impurities, namely Imp-1, Imp-2, Imp-3 and Imp-4 was found to be greater than 2.0. The drug was subjected to stress conditions of hydrolysis, oxidation, photolysis and thermal degradation. Considerable degradation was found to occur in alkaline medium and oxidative stress conditions. Degradation product formed during oxidative hydrolysis was found to be Imp-1. The stress samples were assayed against a qualified reference standard and the mass balance was found close to 99.5%. The developed RP-UPLC method was validated with respect to linearity, accuracy, precision and robustness. The limit of quantification of Imp-1, Imp-2, Imp-3 and Imp-4 were 0.06, 0.06, 0.05 and 0.036% (of analyte concentration, i.e. 0.5 mg/ml) with 1 µl injection volume. The developed method was found to be linear in the range of 2.5 - 15 µg/mL with correlation coefficient of 0.999 for assay procedures and found to be linear in the range of 0.05 - 3 µg/mL with correlation coefficient of 0.999 for related impurities.
1. Introduction
Benign prostate hyperplasia (BPH) is an androgen-dependent, nonmalignant growth of the periurethral prostate gland that results in enlargement of the prostate gland and urinary obstruction [1]. Prostate cancer, the most common cancer among men over 50 years with increasing prevalence with age, is the leading cause of cancer death [1,2]. Finasteride (FIN) (CAS 98319-26-7), a member of the 4-azasteroid family, is a potent inhibitor of 5-alphareductase,this synthesizes androgen dihydrotestosterone (DHT) through the reduction of testosterone [3]. Increased levels of DHT are responsible for maintaining growth in the development of prostratecancer and BPH [4]. Chemotherapeutic treatment with FIN has shown a beneficial effect in the prevention of prostate cancer [5], as FIN is rapidly absorbed and widely distributed in the body after oral administration. Therefore, developing an assay that is both sensitive and specific for FIN is essential for pharmaceutical bulk drugs as well as in human biofluids.
The quantitation of FIN in biological samples has been performed with several methods including high performance liquid chromatography (HPLC) [6-8], isotopedilution mass spectrometry [9], polarography [10], spectrophotometer [11], and high performance liquid chromatography-tandem mass spectrometry(HPLC-MS/MS) [12-19]. Although HPLC is a wellestablished technique, it suffers from poor sensitivity and specificity. The addition of tandem MS/MS significantly enhances the sensitivity and specificity [13], but the application of MS/MS to the assay procedures and related impurities is still restricted due to the sensitive care of the instrument and limitation of the ingredients present in the related impurities which will form adduct and ionization issues during the sample analysis which will lead to undesired precision and accuracy assays. UPLC techniques offer efficient chromatography with reduced run times and improved sensitivity [20] by taking advantage of smaller particle size (1.7 µm) and higher operating pressures than conventional HPLC. Even though UPLC techniques have been explored for applications in pharmacokinetic analyses [21], drug metabolism [22], and metabolite profiling [23], to the best of our knowledge, there were no method application by UPLC presented for the related impurities. Here we are presenting first time the use of UPLC method for quantification of FIN and its impurities with a run time of 16 min by separating the related four impurities with a resolution more than 2. The limit of quantification of Imp-1, Imp-2, Imp-3 and Imp-4 were 0.06, 0.06, 0.05 and 0.036% (of analyte concentration, i.e. 0.5 mg/ml) with 1 µl injection volume.
2. Experimental
2.1. Chemicals
Samples of FIN and its related impurities were obtained as gift samples from Emmanr industries (Hyderabad, India) (Figures 1 and 2). HPLC grade acetonitrile, analytical reagent grade ortho phosphoric acid were purchased from Merck, Darmstadt, Germany. High purity water was prepared by using Millipore Milli-Q plus water purification system. All samples and impurities used in this study were of greater than 99.0% purity.
2.2. Equipment
The UPLC system, used for method development, forced degradation studies and method validation was waters ACQUITYTM UPLC system equipped with a diode array detector, from Waters Corp. (Milford, MA, USA). The output signal was monitored and processes using Empower software (Waters) Water bath equipped with temperature controller was used to carry out degradation studies for all solution. Photo stability studies were carried out in a photo stability chamber (Mack Pharmatech, Hyderabad, India). Thermal stability studies were performed in a dry air oven (Mack Phar-matech, Hyderabad, India).
2.3. Chromatographic Conditions
The chromatographic column used was a waters ACQUITYTM UPLC BEH Phenyl Column 150 mm × 2.1 mm, 1.7 µm, all obtained from Waters Corp. (Milford, MA, USA). The gradient LC method consists of solution A and B as mobile phase. The solution A Contains 2.5 mM Ortho phosphoric acid (Buffer) and solution B contains a mixture of acetonitrile and water in the ratio of (90:10 v/v).The flow rate of the mobile phase was 0.22 ml/min. The gradient program was set as: Time/% solu-
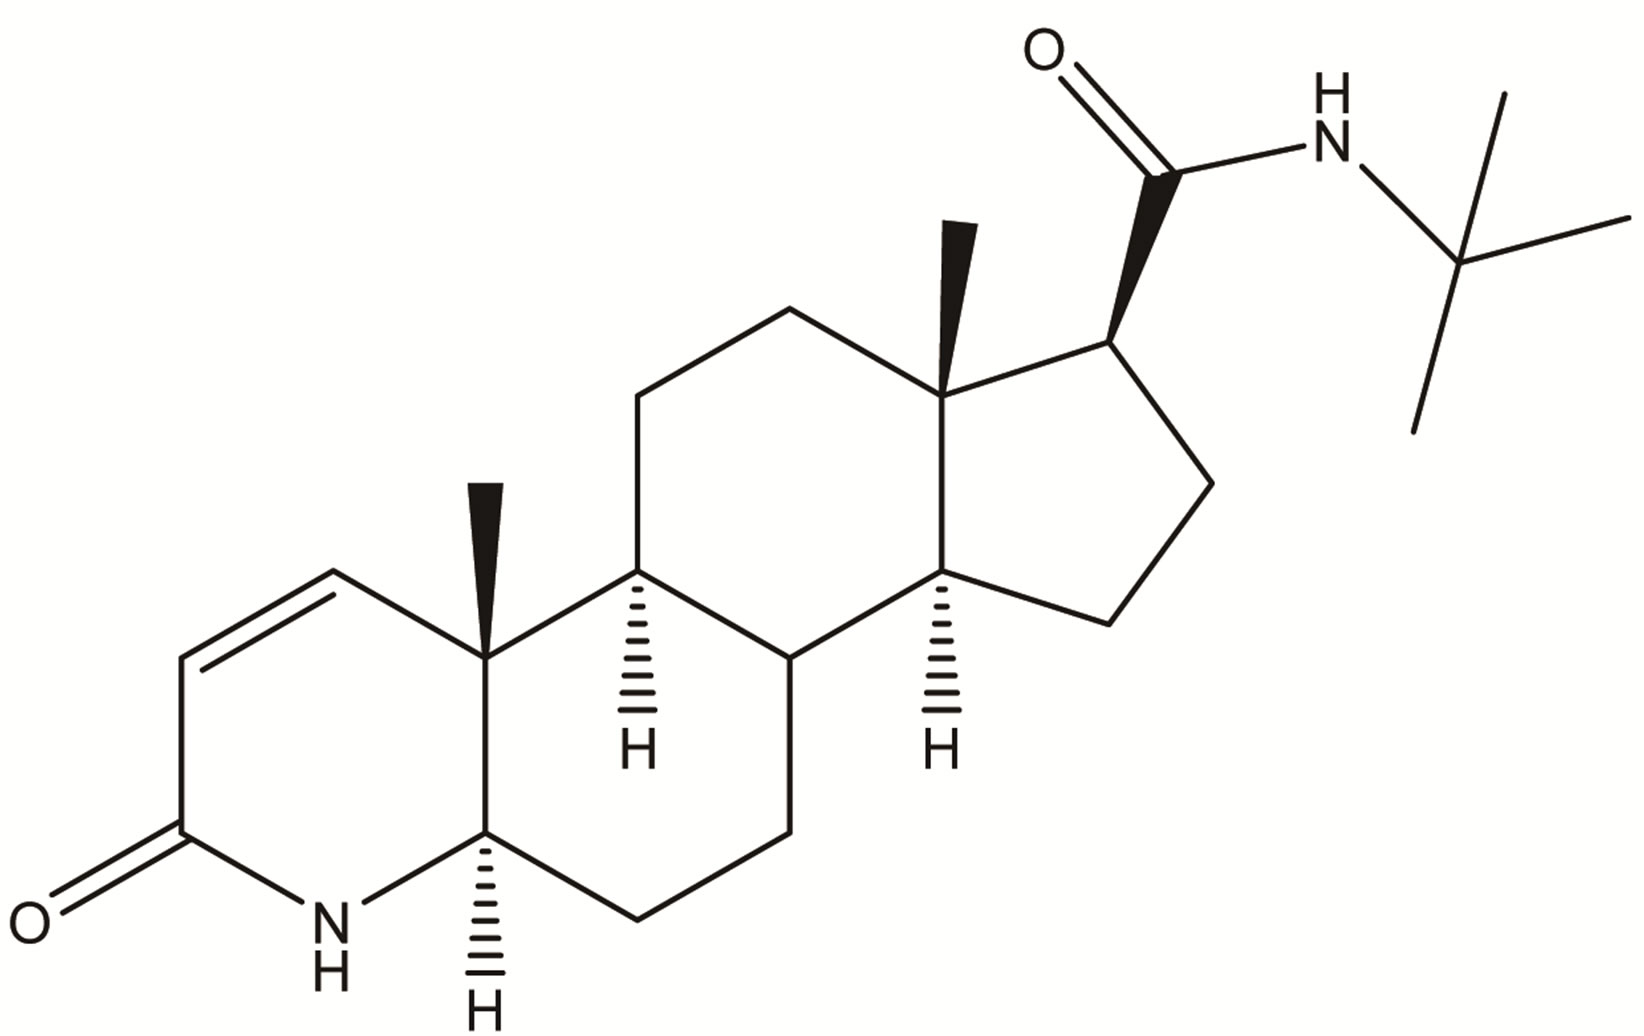 Finasteride
Figure 1. Chemical structure of Finasteride.
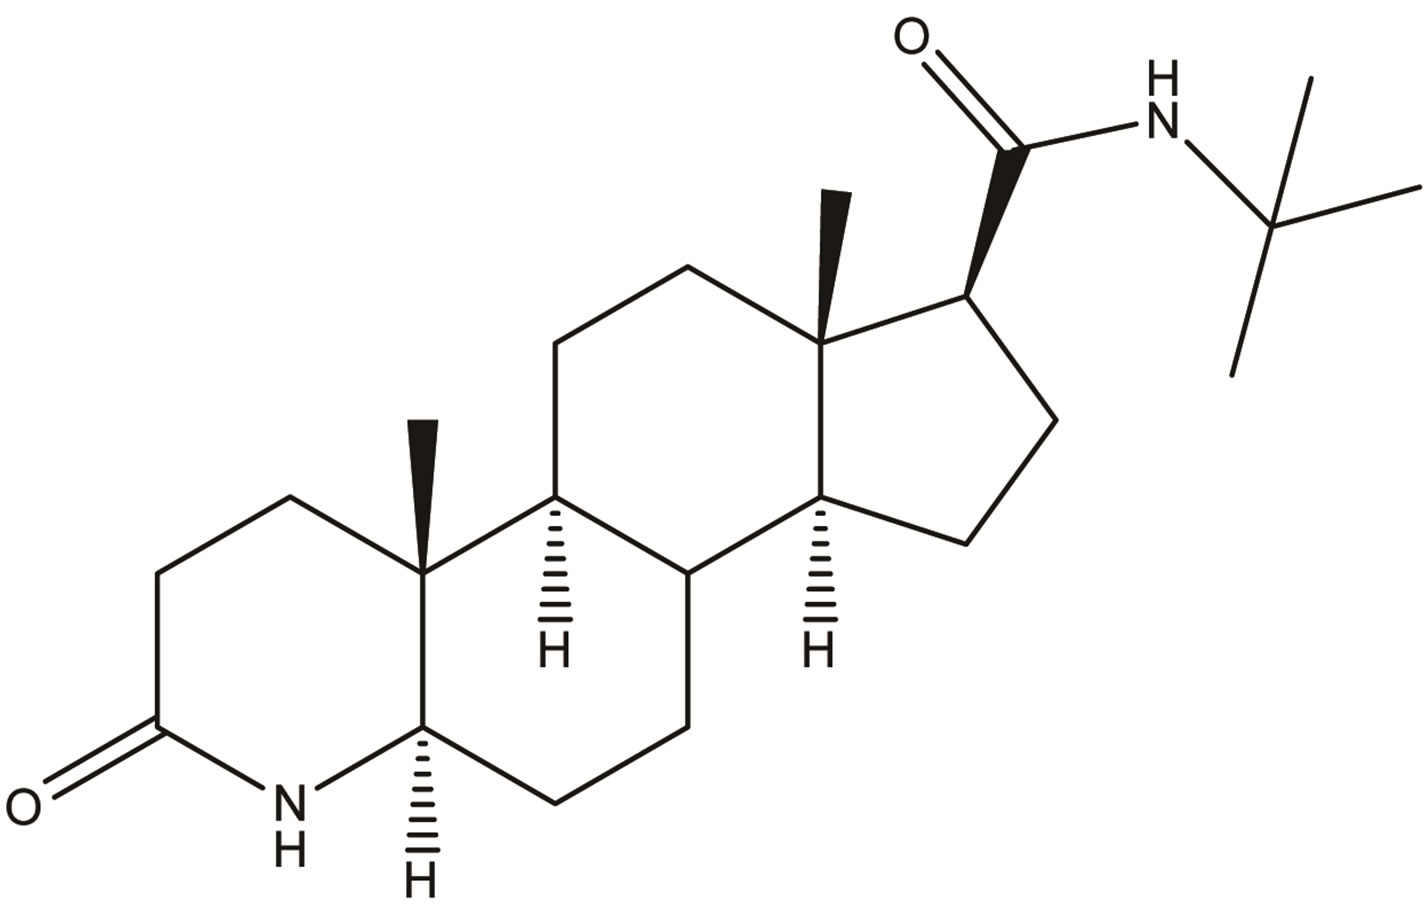 Impurity-1
 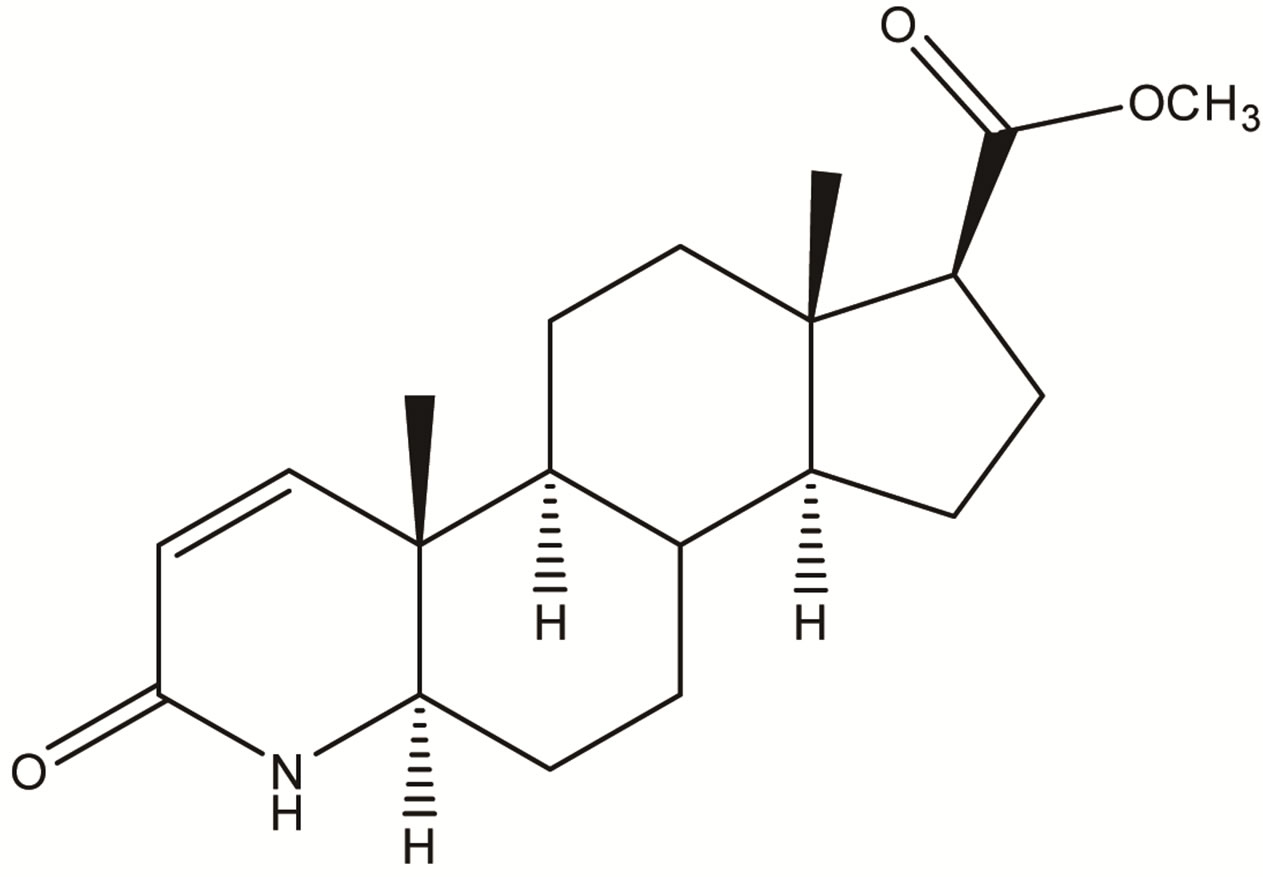 Impurity-2
 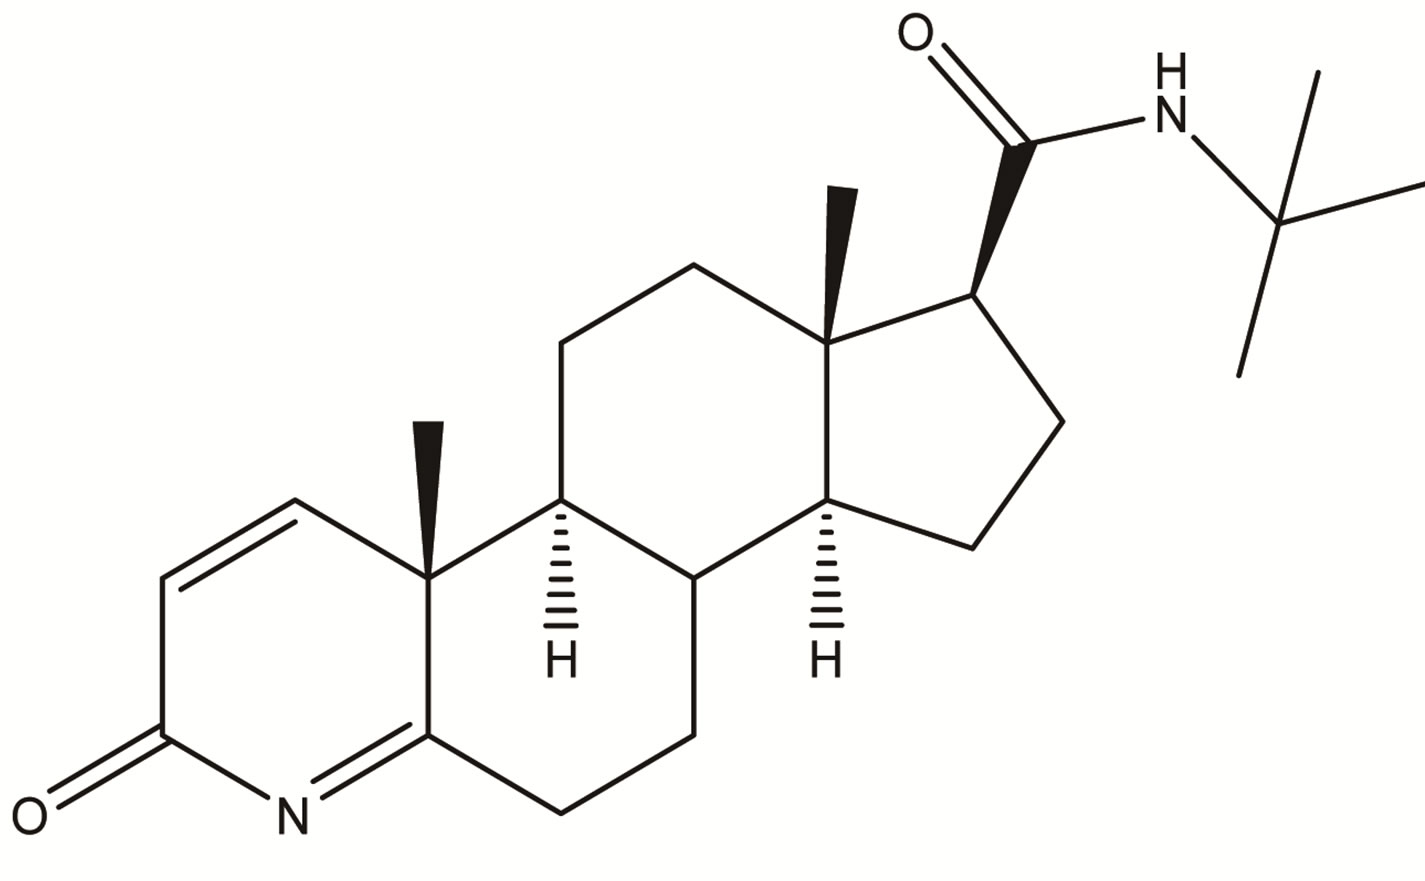 Impurity-3
 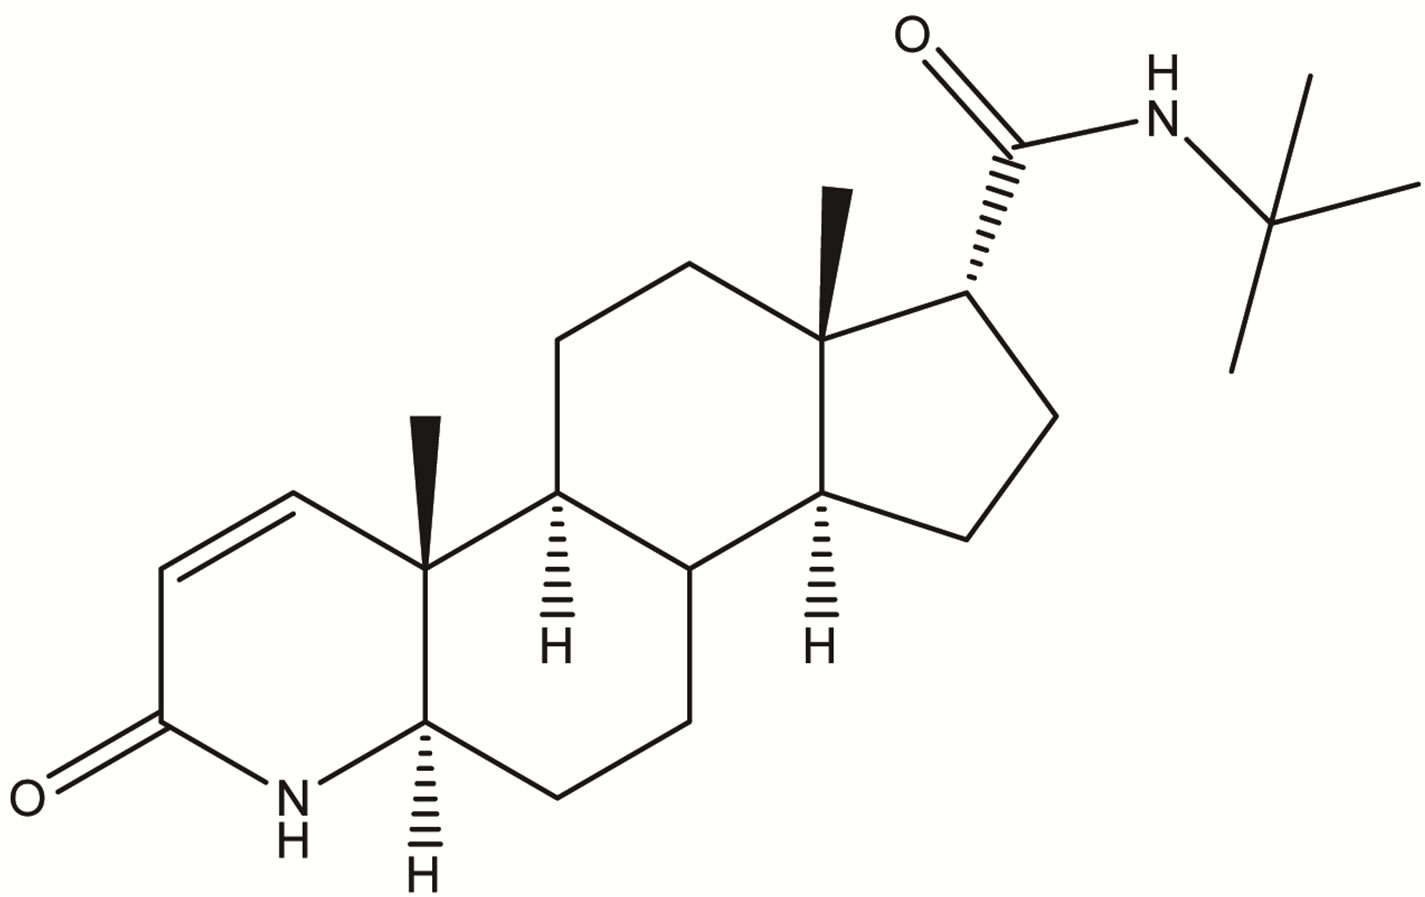 Impurity-4
Figure 2. Chemical structures of Impurity-1, Impurity-2, Impurity-3 and Impurity-4.
tion: B 0/40,3/40,10.5/45,12.0/50,13.5/40 and 16/40. The column temperature was maintained 25˚C and the detection was monitored at a wavelength of 210 nm. The injection volume was 1 µl. A mixture water: Acetonitrile (1:1) was used as a diluent.
The concentration is 0.5 mg·mL–1 for related impurities method and 0.01 mg·mL–1 for Assay method.
2.4. Preparation of Solutions
A stock solution of FIN (0.5 mg·mL–1) was pre-pared by dissolving appropriate amount in the diluent. Working solutions were prepared from above stock solution for related impurities determination and assay determination, respectively. A stock solution of impurities (mixture of Imp-1, Imp-2, Imp-3 and Imp-4) at a concentration of 0.5 mg·mL–1 was also prepared in diluent.
2.5. Specificity
Specificity is the ability of the method to measure the analyte response in the presence of its potential impurities [24]. Stress testing of the drug impurities can help identify the likely degradation products, which can in turn help establish the degradation pathways and the intrinsic stability of the molecule and validate the stability indicating power of the analytical procedures used.
The specificity of the developed LC method for FIN was determined in the presence of its impurities, namely Imp-1, Imp-2, Imp-3, Imp-4 and degradation products. Forced degradation studies were also performed on FIN to provide an indication of the stability indicating property and specificity of the proposed method. The stress conditions employed for degradation study includes light (carried out as per ICH Q1B), heat (60˚C), acid hydrolysis (0.1 N HCl), base hydrolysis (0.1 N NaOH), water hydrolysis and oxidation (3% H2O2). For heat and light studies, study period was 10 days whereas for acid, base, water hydrolysis and oxidation, it was 24 h. Peak purity of stressed samples of FIN was checked by using Photo diode array detector (PDA). The purity factor is within the threshold limit obtained in all stressed samples demonstrates the analyte peak homogeneity. Assay studies were carried out for stress samples against qualified reference standard and the mass balance (%assay + %impurities + %degradation products) was calculated. Specificity of the FIN was shown by spiking all four impurities (Imp-1, Imp-2, Imp-3 and Imp-4) at the specification level (i.e. 0.15% of analyte concentration which is 0.5 mg/ml).
2.6. Analytical Method Validation
The developed chromatographic method was validated for linearity, precision, accuracy, sensitivity, robustness and system suitability [25].
2.6.1. Precision
The precision of the related impurities method was checked by injecting six individual preparations of (0.5 mg·mL–1) FIN spiked with 0.15% each Imp-1, Imp-2, Imp-3 and Imp-4. The %RSD area of each Imp-1, Imp-2, Imp-3 and Imp-4 was calculated.
Assay method precision was evaluated by carrying out six independent assays of test sample of FIN against qualified reference standard. The percentage of R.S.D. of six assay values obtained was calculated.
2.6.2. Limit of Detection (LOD) and Limit of Quantification (LOQ)
Sensitivity was determined by establishing the Limit of detection (LOD) and Limit of quantitation (LOQ) for Imp-1, Imp-2, Imp-3, Imp-4 and Imp-5 estimated at a signal-to-noise ratio of 3:1 and 10:1 respectively, by injecting a series of dilute solutions with known concentration. The precision study was also carried out at the LOQ level by injecting six individual preparations of Imp-1, Imp-2, Imp-3 and Imp-4, calculated the %RSD for the areas of each Impurity.
2.6.3. Linearity and Range
A linearity test solution for related impurities method was prepared by diluting the impurity stock solution to the required concentrations. The solutions were prepared at seven concentration levels. From 0.05% to 0.3% of the permitted maximum level of the impurity (i.e. 0.05%, 0.1%, 0.15%, 0.2%, 0.25% and 0.3% was subjected to linear regression analysis with the least square method. Calibration equation obtained from regression analysis was used to calculate the corresponding predicted responses. The residuals and sum of the residual squares were calculated from the corresponding predicted responses.
Linearity test solutions for assay method has prepared from stock solution at five concentration levels from 25% to 150% of assay analyte concentration (2.5, 5, 7.5, 10, 12.5 and 15 μg·mL–1).
2.6.4. Accuracy
The accuracy of the related impurities method was evaluated in triplicate at 0.05%, 0.1%, 0.15%, 0.2%, 0.25% and 0.3% of the analyte concentration (500 μg·mL–1). The percentage of recoveries for Imp-1, Imp-2, Imp-3 and Imp-4 were calculated. UPLC chromatograms of blank, spiked sample with all four impurities and FIN bulk drug sample are shown in Figures 3-5.
The accuracy of the assay method was evaluated in triplicate at three concentration levels, i.e. 50, 100 and 150 μg·mL–1 in bulk drugs. At each concentration, three sets were prepared and injected in triplicate. The percentage of recovery was calculated at each level.
2.6.5. Robustness
To determine the robustness of the developed method, experimental conditions were deliberately changed and the resolution (Rs) between FIN, Imp-1, Imp-2, Imp-3 and Imp-4 was evaluated. The flow rate of the mobile phase was 0.22 mL·min–1. To study the effect of flow rate on the developed method, 0.02 units of flow was changed (i.e. 0.2 and 0.24 mL·min–1). The effect of column temperature on the developed method was studied at 20˚C and 30˚C instead of 25˚C. In the all above varied conditions, the components of the mobile phase were held constant.
2.6.6. Solution Stability and Mobile Phase Stability
The solution stability of FIN and its related impurities were carried out by leaving both spiked sample and unspiked sample solution in tightly capped volumetric flask at room temperature for 48 h. Content of Imp-1, Imp-2, Imp-3 and Imp-4 was determined at every 6 h interval, up to the study period. Mobile phase stability was also carried out for 48 h by injecting the freshly prepared sample solutions, for every 6 h interval. Content of Imp-1, Imp-2, Imp-3 and Imp-4 was checked in the test solutions. Mobile phase prepared was kept constant during the study period.
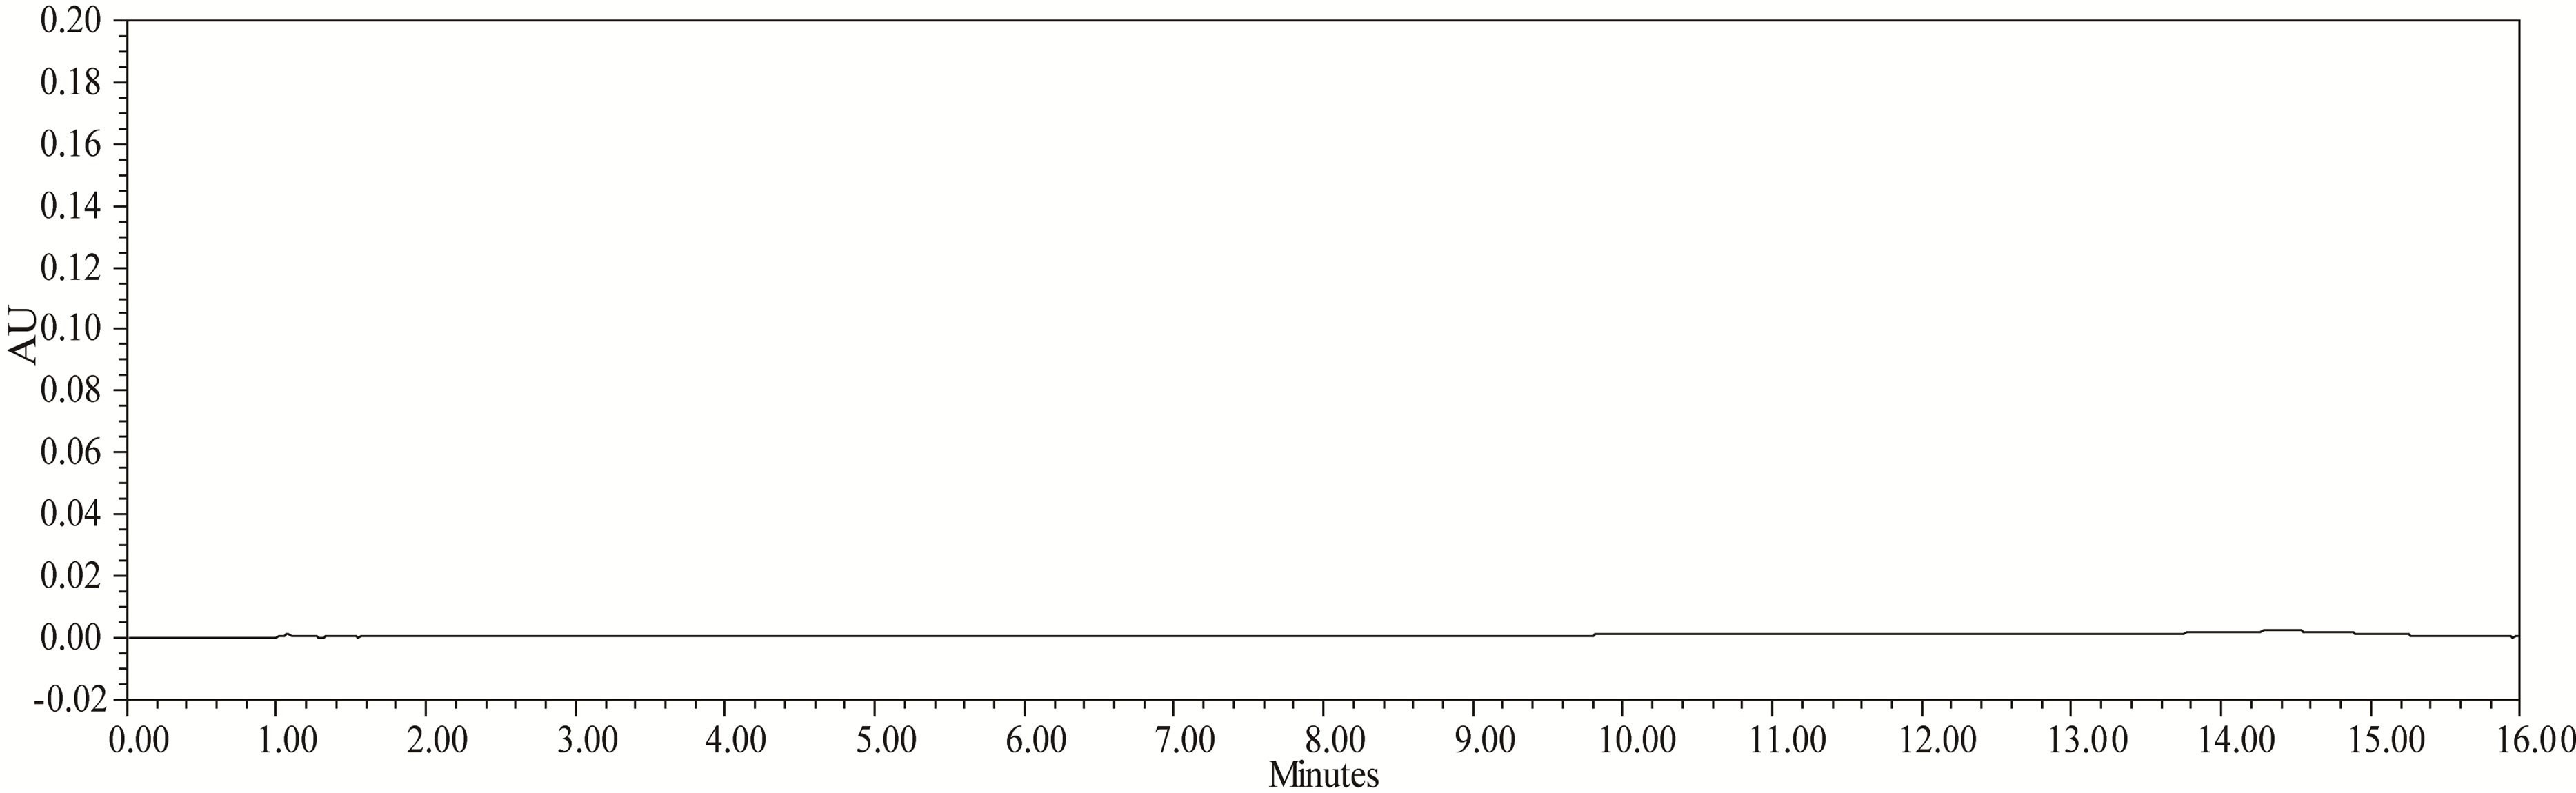
Figure 3. Typical chromatogram of diluent.
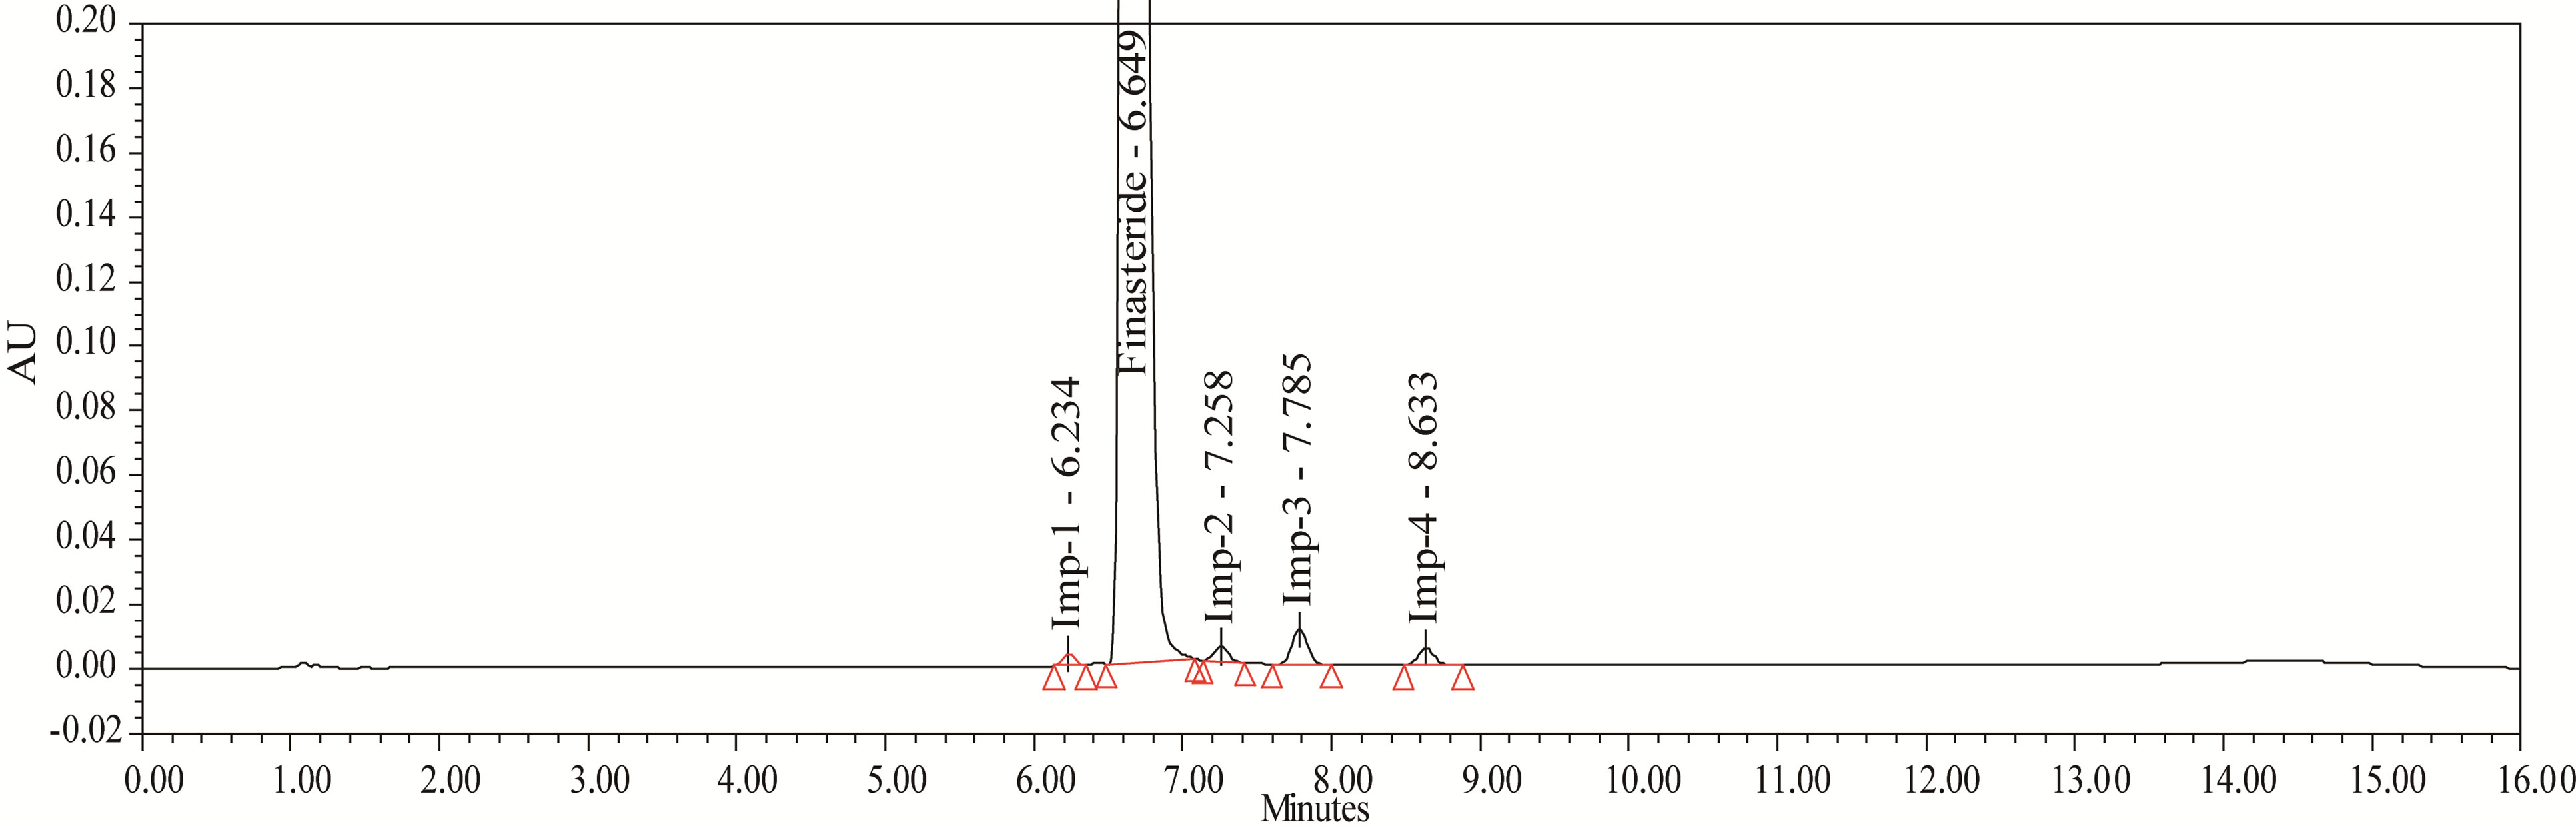
Figure 4. Typical chromatigram of Impurities blend solution.
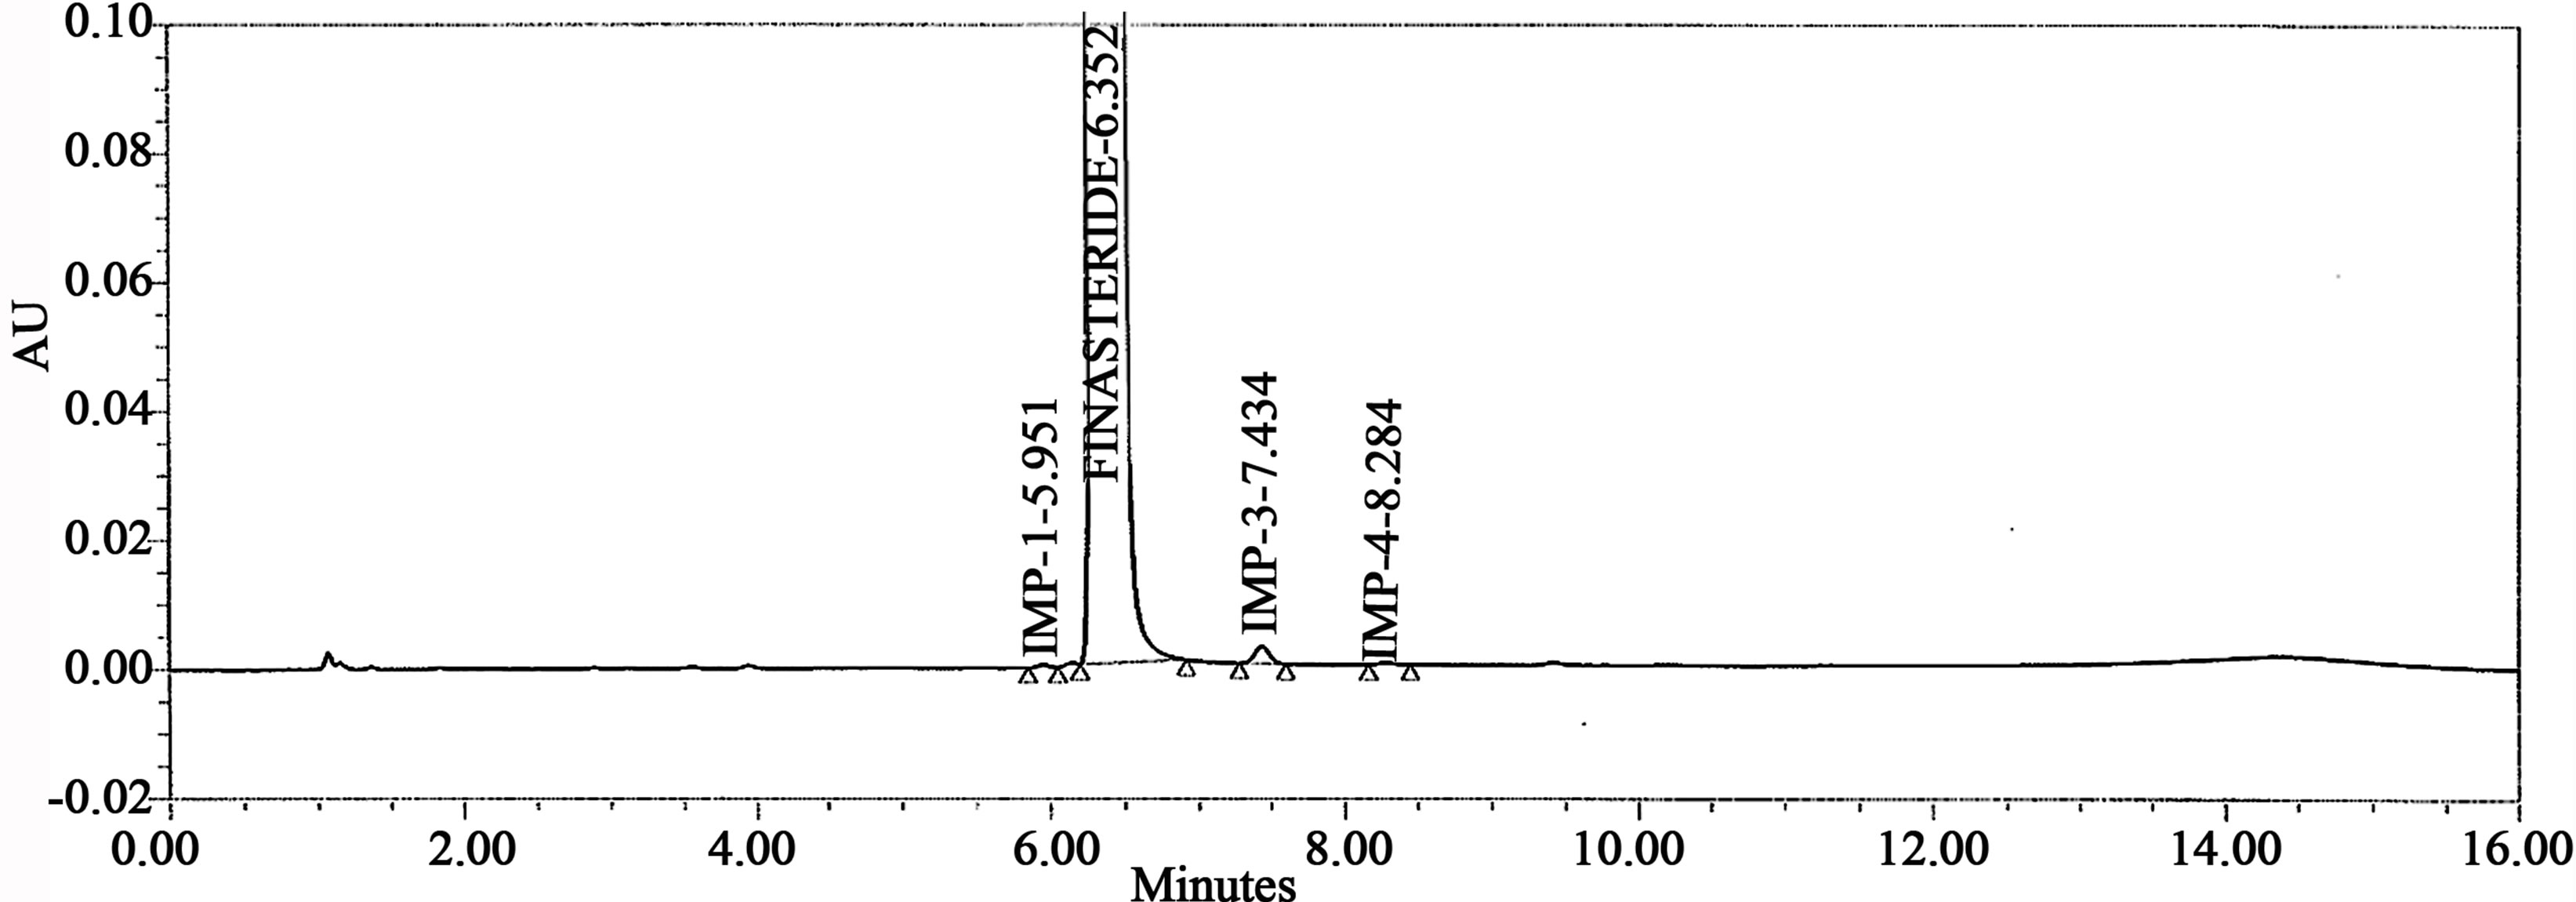
Figure 5. Typical chromatogram of sample.
The solution stability of FIN in the assay method was carried out by leaving the test solutions of samples in tightly capped volumetric flasks at room temperature for 48 h. The same sample solutions were assayed at 6 h intervals up to the study period against freshly prepared standard solution. The mobile phase stability was also carried out by assaying the freshly prepared sample solutions against freshly prepared reference standard solutions at 6 h intervals up to 48 h. Mobile phase prepared was kept constant during the study period. The %RSD of assay of FIN was calculated for the study period during mobile phase and solution stability experiments.
3. Results and Discussion
3.1. Method Development and Optimization
The main target of the chromatographic method is to get the separation of critical closely eluting impurities, namely Imp-1 and Imp-2. Impurities were co-eluted by using different stationary phases like C18, C8 and cyano and different mobile phases containing buffers like phosphate, sulphate and acetate with different pH (2 - 8) and using organic modifiers like acetonitrile, methanol and ethanol in the mobile phase.
The chromatographic separation was achieved on a Waters ACQUITYTM UPLC BEH Phenyl Column 150 mm × 2.1 mm, 1.7 µm column, by using solutions A and B as mobile phase. The solution A Contains 2.5 mM Orthophosphoric acid (Buffer) and solution B contains a mixture of acetonitrile and water in the ratio of (90:10 v/v). The flow rate of the mobile phase was 0.22 ml/min. The gradient program was set as: Time/% solution: B 0/40, 3/40, 10.5/45, 12.0/50, 13.5/40 and 16/40. The column temperature was maintained 25˚C and the detection was monitored at a wavelength of 210 nm. The injection volume was 1 µl. A mixture water: Acetonitrile (1:1) was used as a diluent. The peak shape of FIN was found symmetrical. In the optimized conditions FIN, Imp-1, Imp-2, Imp-3 and Imp-4 were well separated with a resolution of greater than 2.0 and the typical retention times of Imp-1, FIN, Imp-2, Imp-3 and Imp-4 were about 5.9, 6.3, 6.9, 7.4 and 5.2 min respectively. The system suitability results are given in Table 1 and the developed UPLC method was found to be specific for FIN and its four impurities, namely Imp-1, Imp-2, Imp-3 and Imp-4.
After many logical trials, chromatographic condition was established such that which could be suitable for separation of drug-degradation products and drug-four known impurities. Using the optimized conditions FIN and its known impurities were well separated with a resolution of greater than 2.0. The system suitability results are given in Table 1.
3.2. Results of Forced Degradation Studies
The drug was exposed to 0.1 N HCl at 70˚C for 24 h. FIN has shown no significant sensitivity towards the treatment of 0.1 N HCl. The representative chromatogram present in Figure 6.
3.2.1. Degradation in Basic Solution
The drug was exposed to 0.1 N NaOH at 70˚C for 24 h. FIN has shown significant sensitivity towards the treatment of 0.1 N NaOH. The drug gradually undergone degradation with time in 0.1N NaOH and prominent degradation was observed (≈4%). The representative chromatogram present in Figure 7.
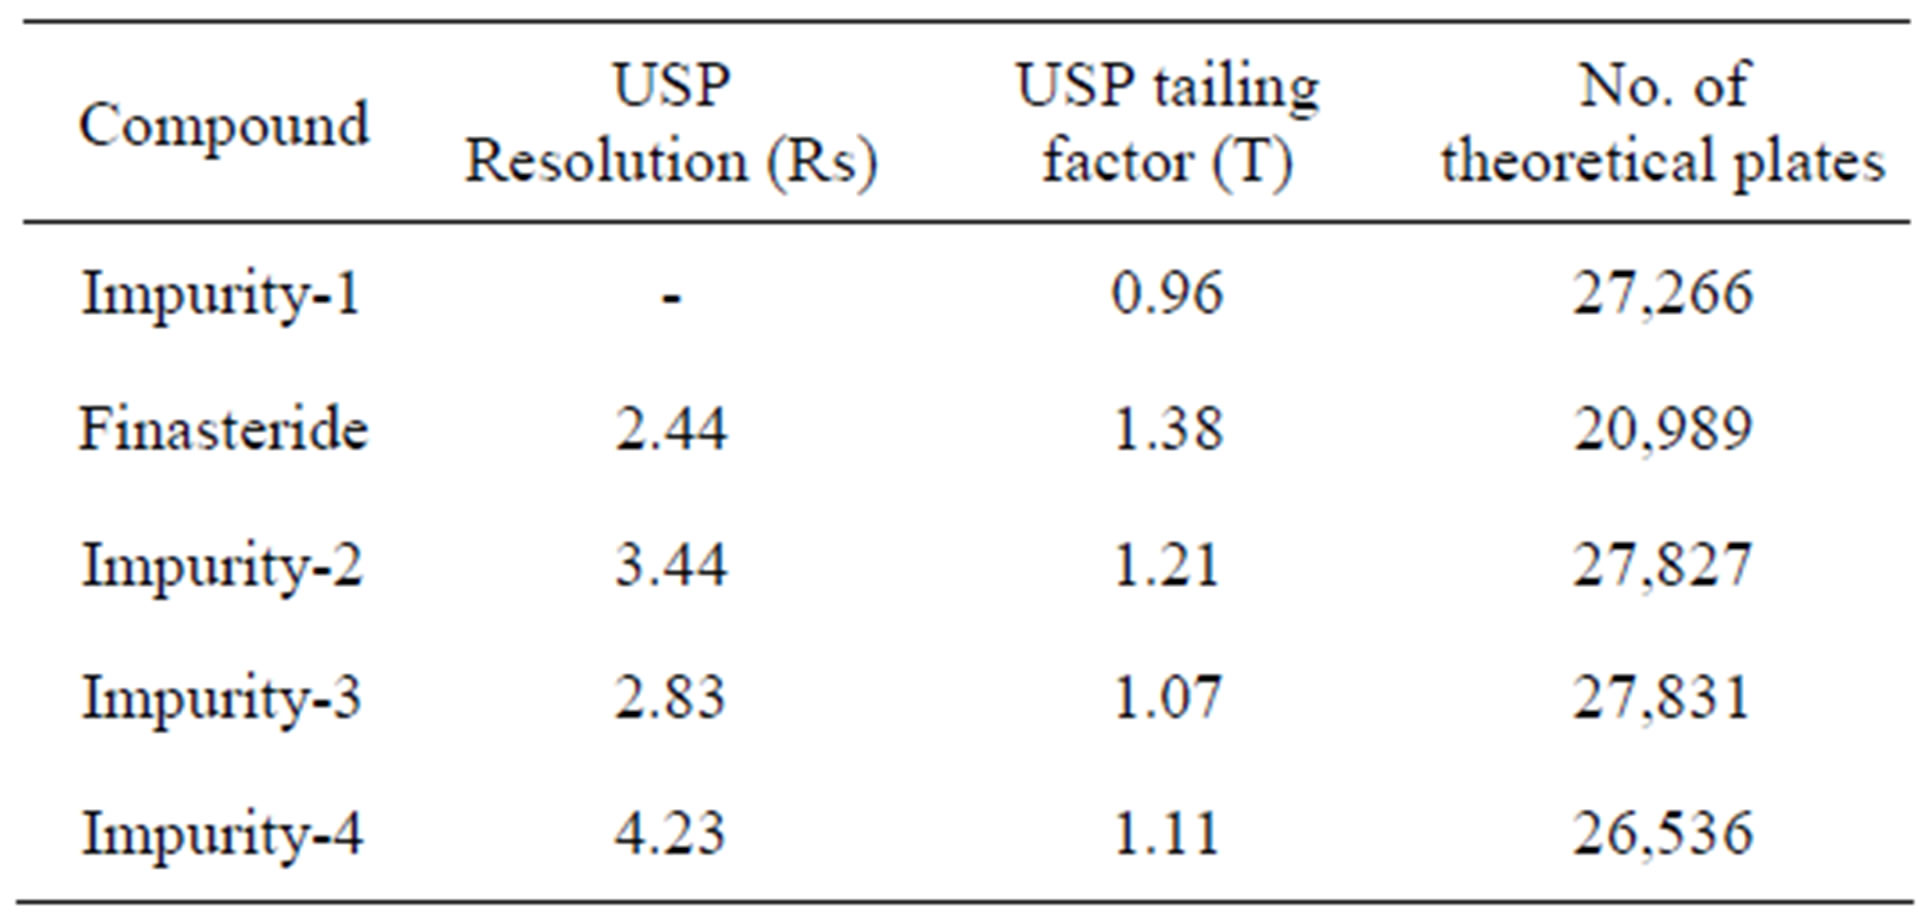
Table 1. System suitability report.
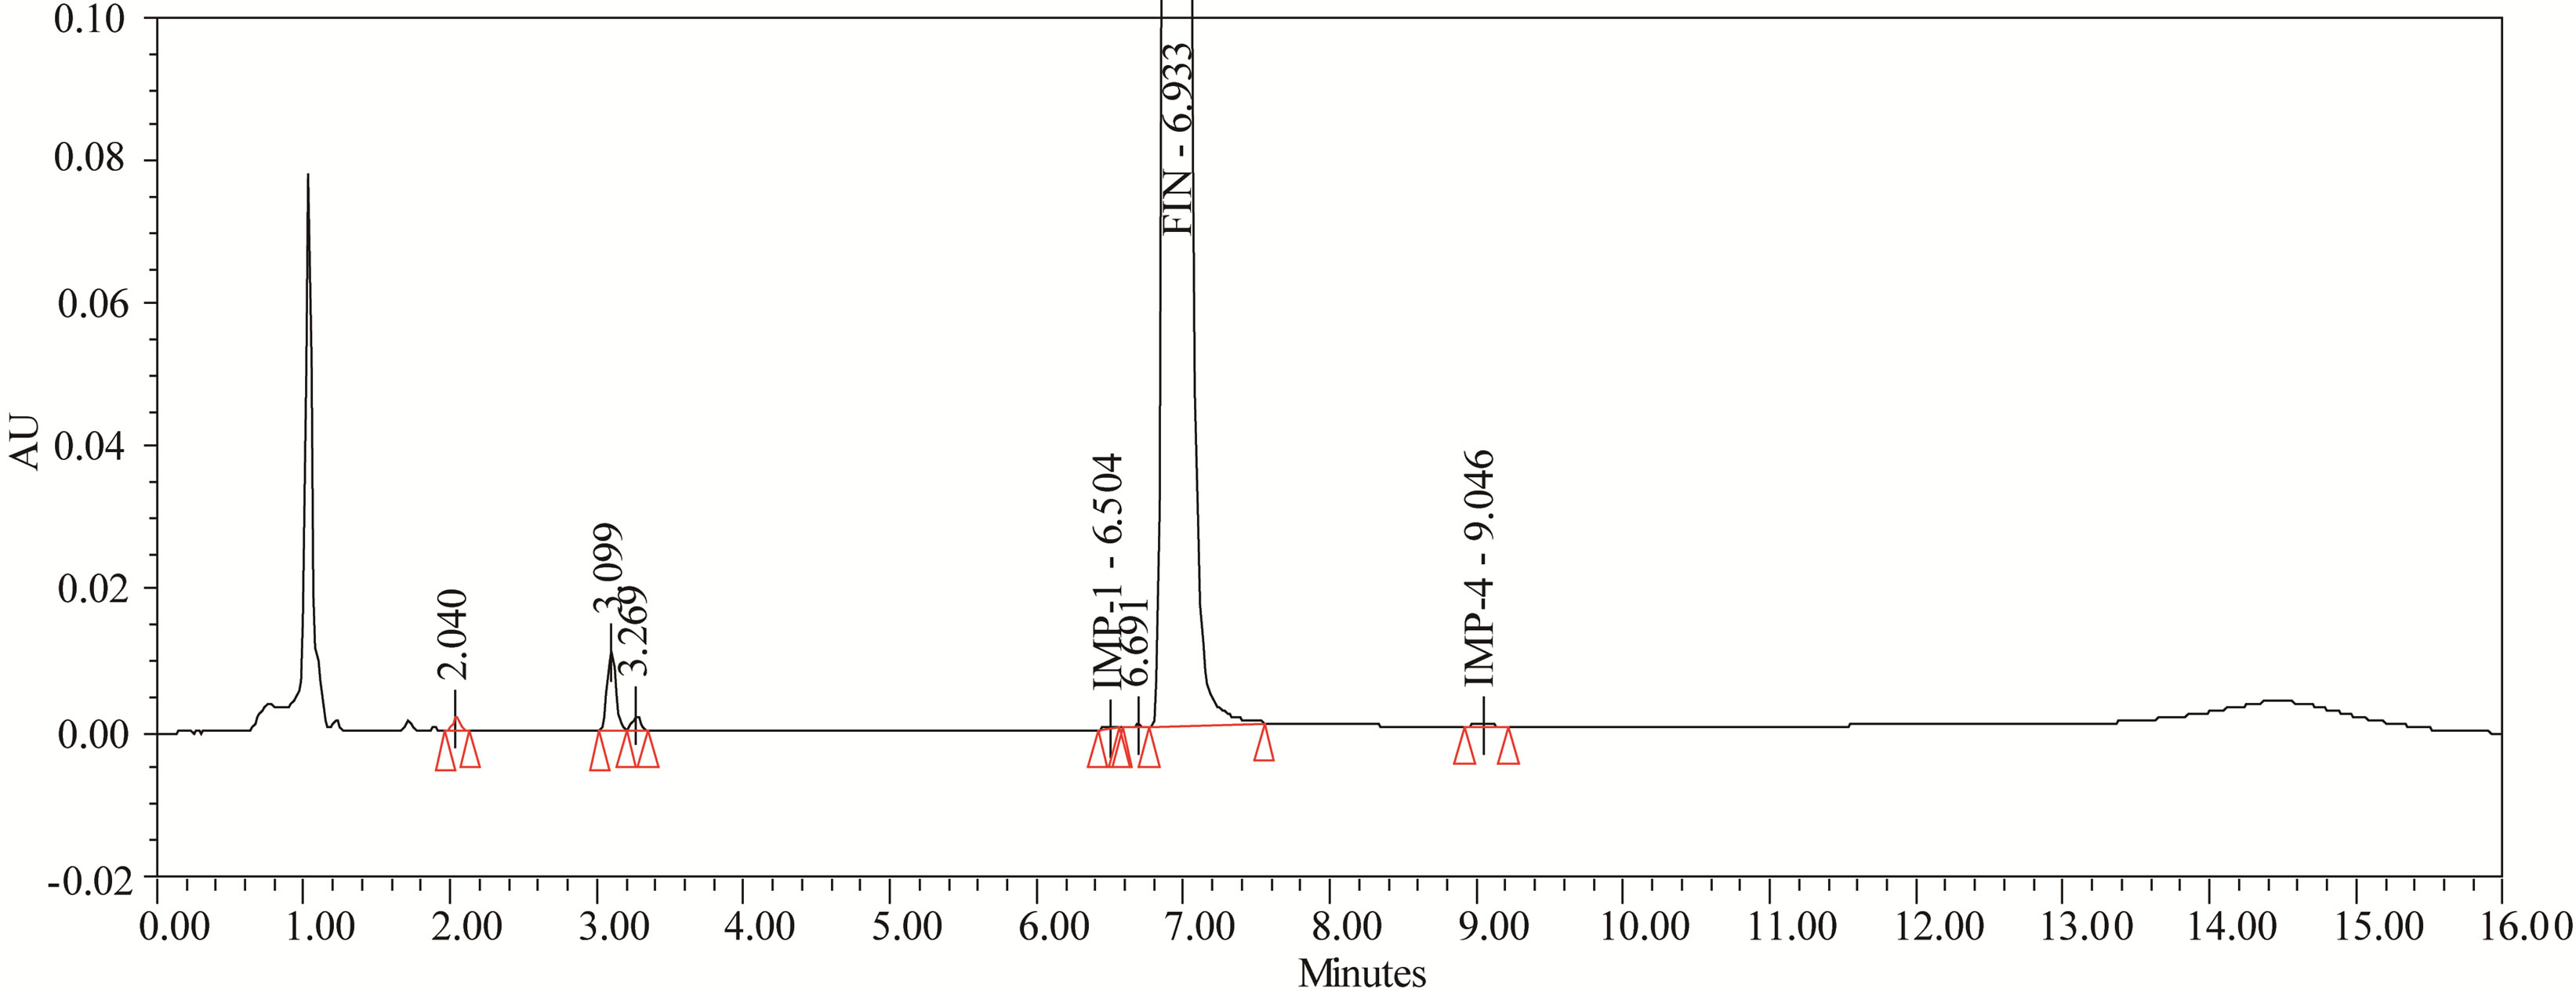
Figure 6. Typical chromatogram of acid degradation.
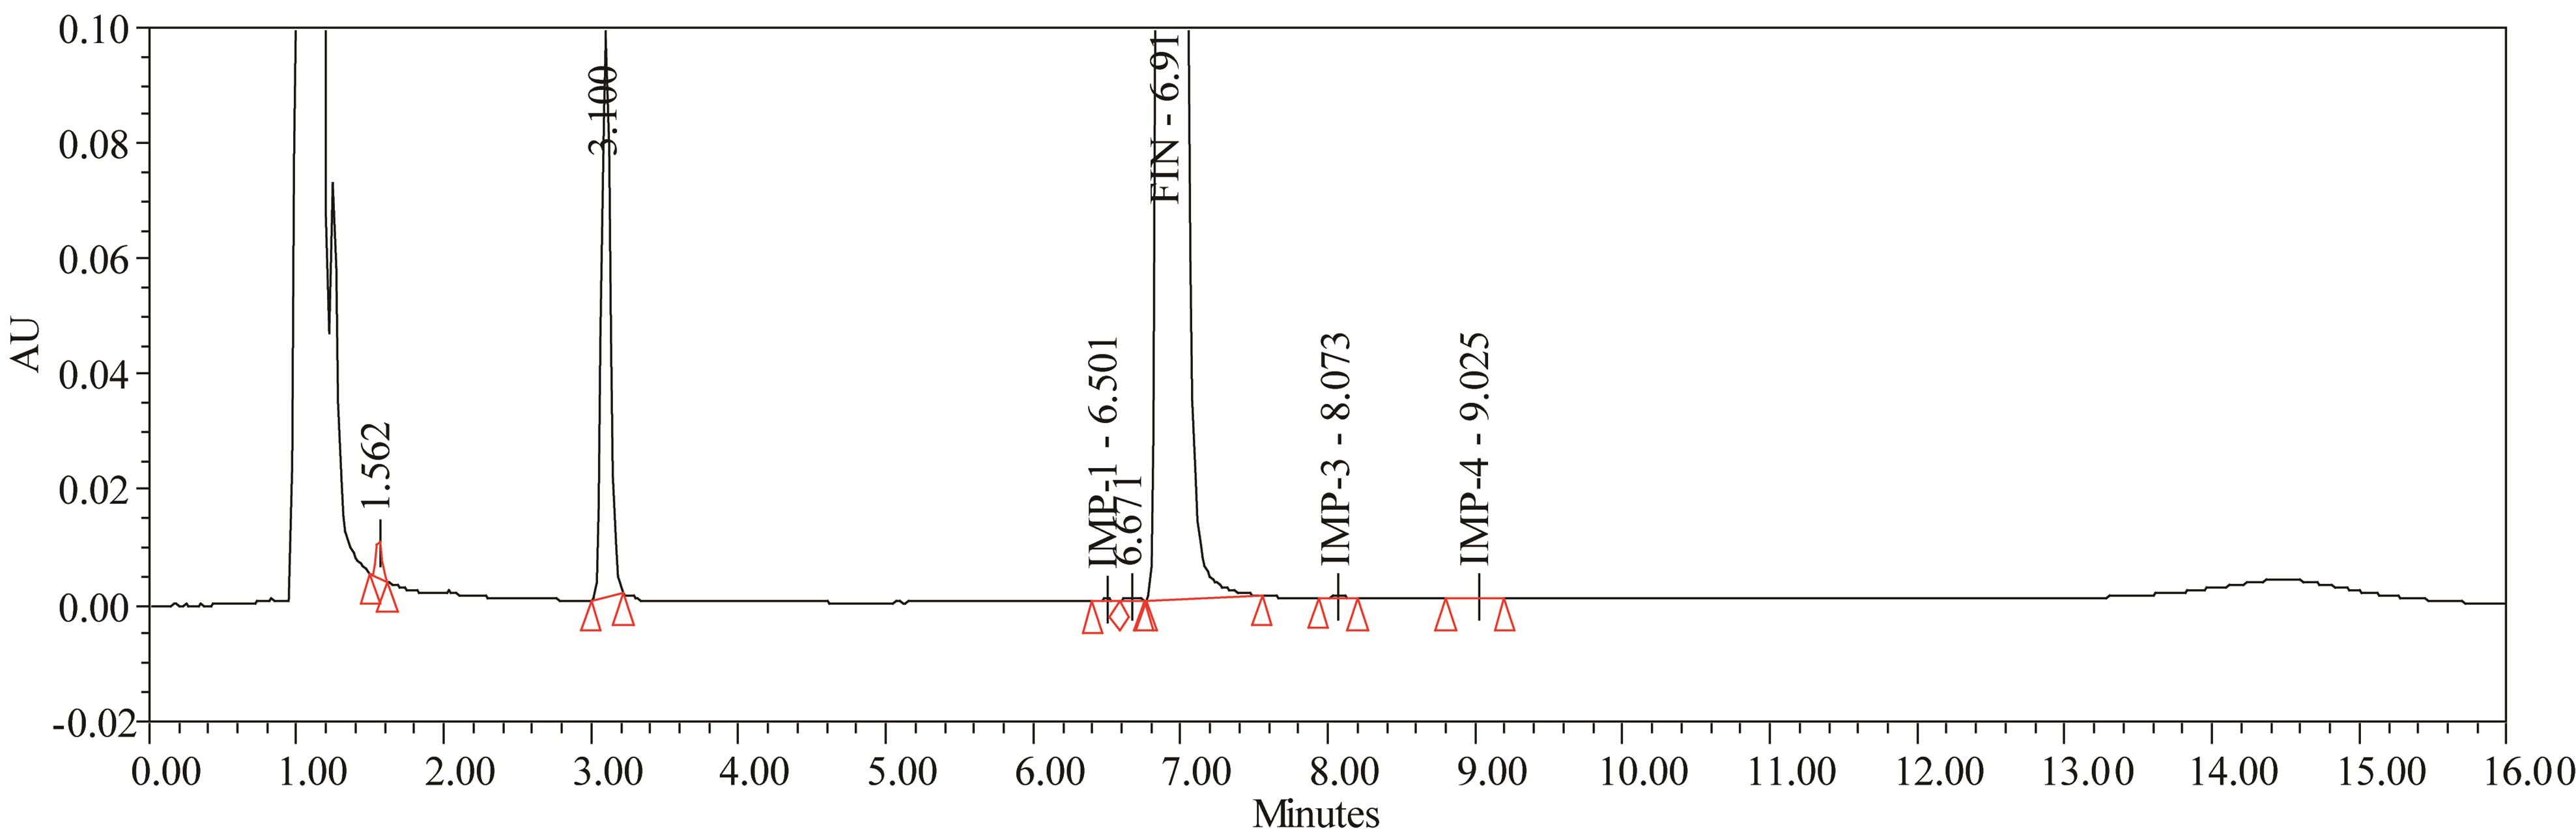
Figure 7. Typical chromatogram of base degradation.
3.2.2. Oxidative Conditions
The drug was exposed to 3% hydrogen peroxide at room temperature for 24 hours and it was degraded up to (≈ 10%). FIN has shown significant sensitivity towards the treatment of 3% hydrogen peroxide and the drug gradually undergone prominent degradation (≈10%).
FIN was stable under forced photo and thermal degradation. From the degradation studies, Peak purity test results derived from PDA detector, confirmed that the FIN peak was homogeneous and pure in all the analyzed stress samples. The mass balance of stressed samples was close to 99.5%. No degradants were observed after 10 min in the extended runtime of 20 min of all the FIN samples. The developed UPLC method was found to be specific in the presence of Imp-1, Imp-2, Imp-3, Imp-4, and its degradation products confirm the stability indicating power of the developed method. The forced degradation study results are given in Table 2. The representative chromatogram present in Figure 8.
3.3. Method Validation
3.3.1. Precision
The %RSD of area of Imp-1, Imp-2, Imp-3 and Imp-4 in related impurities method precision study was within 2.5. The %RSD of assay of FIN during assay method precision study and intermediate precision study was 0.3 which confirms the good precision of the developed analytical method for both assay and related impurities.
3.3.2. Sensitivity
The limit of detection of Imp-1, Imp-2, Imp-3 and Imp-4 were 0.02%, 0.02%, 0.015% and 0.012% (of analyte concentration, i.e. 0.5 mg/ml) for 1 µl injection volume. The limit of quantification of Imp-1, Imp-2, Imp-3 and Imp-4 were 0.06%, 0.06%, 0.05% and 0.036% (of analyte concentration, i.e. 0.5 mg/ml) for 1µl injection volume.
The precision at LOQ concentration for Imp-1, Imp-2, Imp-3 and Imp-4 were below 5%.
Experimental data shown in Table 3. Calibration curves represented in Figure 9.
3.3.3. Linearity and Range
Linear calibration plot for related impurities method was obtained over the calibration ranges tested, i.e. 0.05% to 0.3% for Imp-1, Imp-2, Imp-3 and Imp-4. The correlation coefficient obtained was greater than 0.999 for all four impurities. The result shows an excellent correlation existed between the peak area and concentration of Imp-1, Imp-2, and Imp-3 and Imp-4.
Linear calibration plot for assay method was obtained over the calibration ranges tested, i.e. 2.5 - 15 μg/mL and the correlation coefficient obtained was greater than 0.999. The result shows an excellent correlation existed between the peak area and concentration of the analyte.
The best-fit linear equation obtained was y = 7.3514x + 36.8876. At all concentration levels, standard deviation of peak area was significantly low and RSD was below 1.0%. Analysis of residuals indicated that residuals were scattered within ±2% with respect to 100% concentration response. Linearity was checked for related impurities over the same concentration ranges on three consecutive days the %RSD of the slopes and Y-intercept of the calibration plots were with in 2.3 and 5.0 respectively. The range of the method was found from LOQ to 0.3% of the analyte concentration (250 μg·mL–1).
3.3.4. Accuracy
The percentage recovery of FIN in bulk drug samples ranged from 99.1% - 100.1%. The percentage recovery of Imp-1, Imp-2, Imp-3 and Imp-4 in bulk drug samples ranged from 99.7% to 102.1% (Table 4).
3.3.5. Robustness
Close observation of analysis results for deliberately changed chromatographic conditions (flow rate, pH and column temperature) revealed that the resolution between closely eluting impurities, namely Imp-1, Imp-2, Imp-3, Imp-4 and Imp-5 was always greater than 2.0, illustrating the robustness of the method.
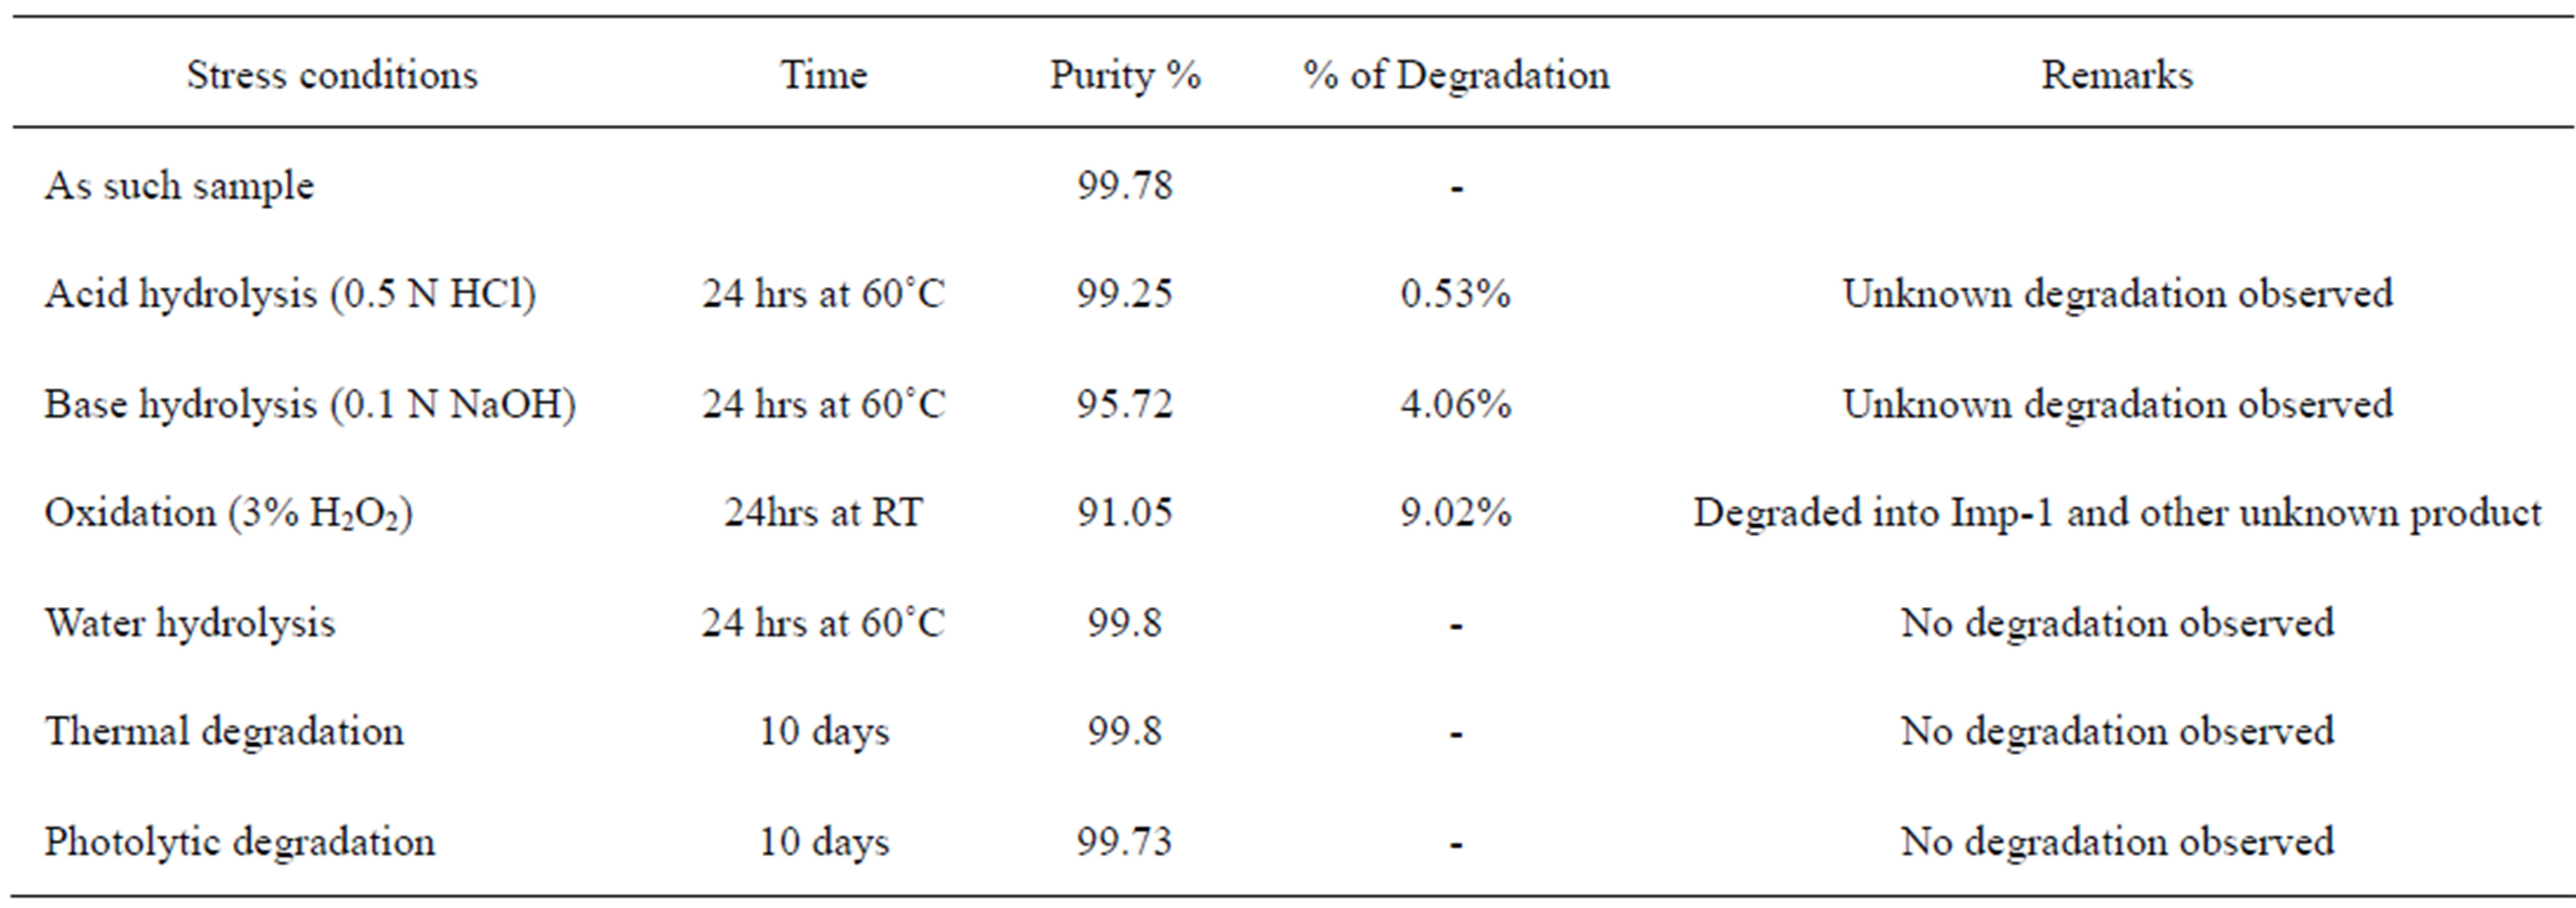
Table 2. Summary of forced degradation study report.
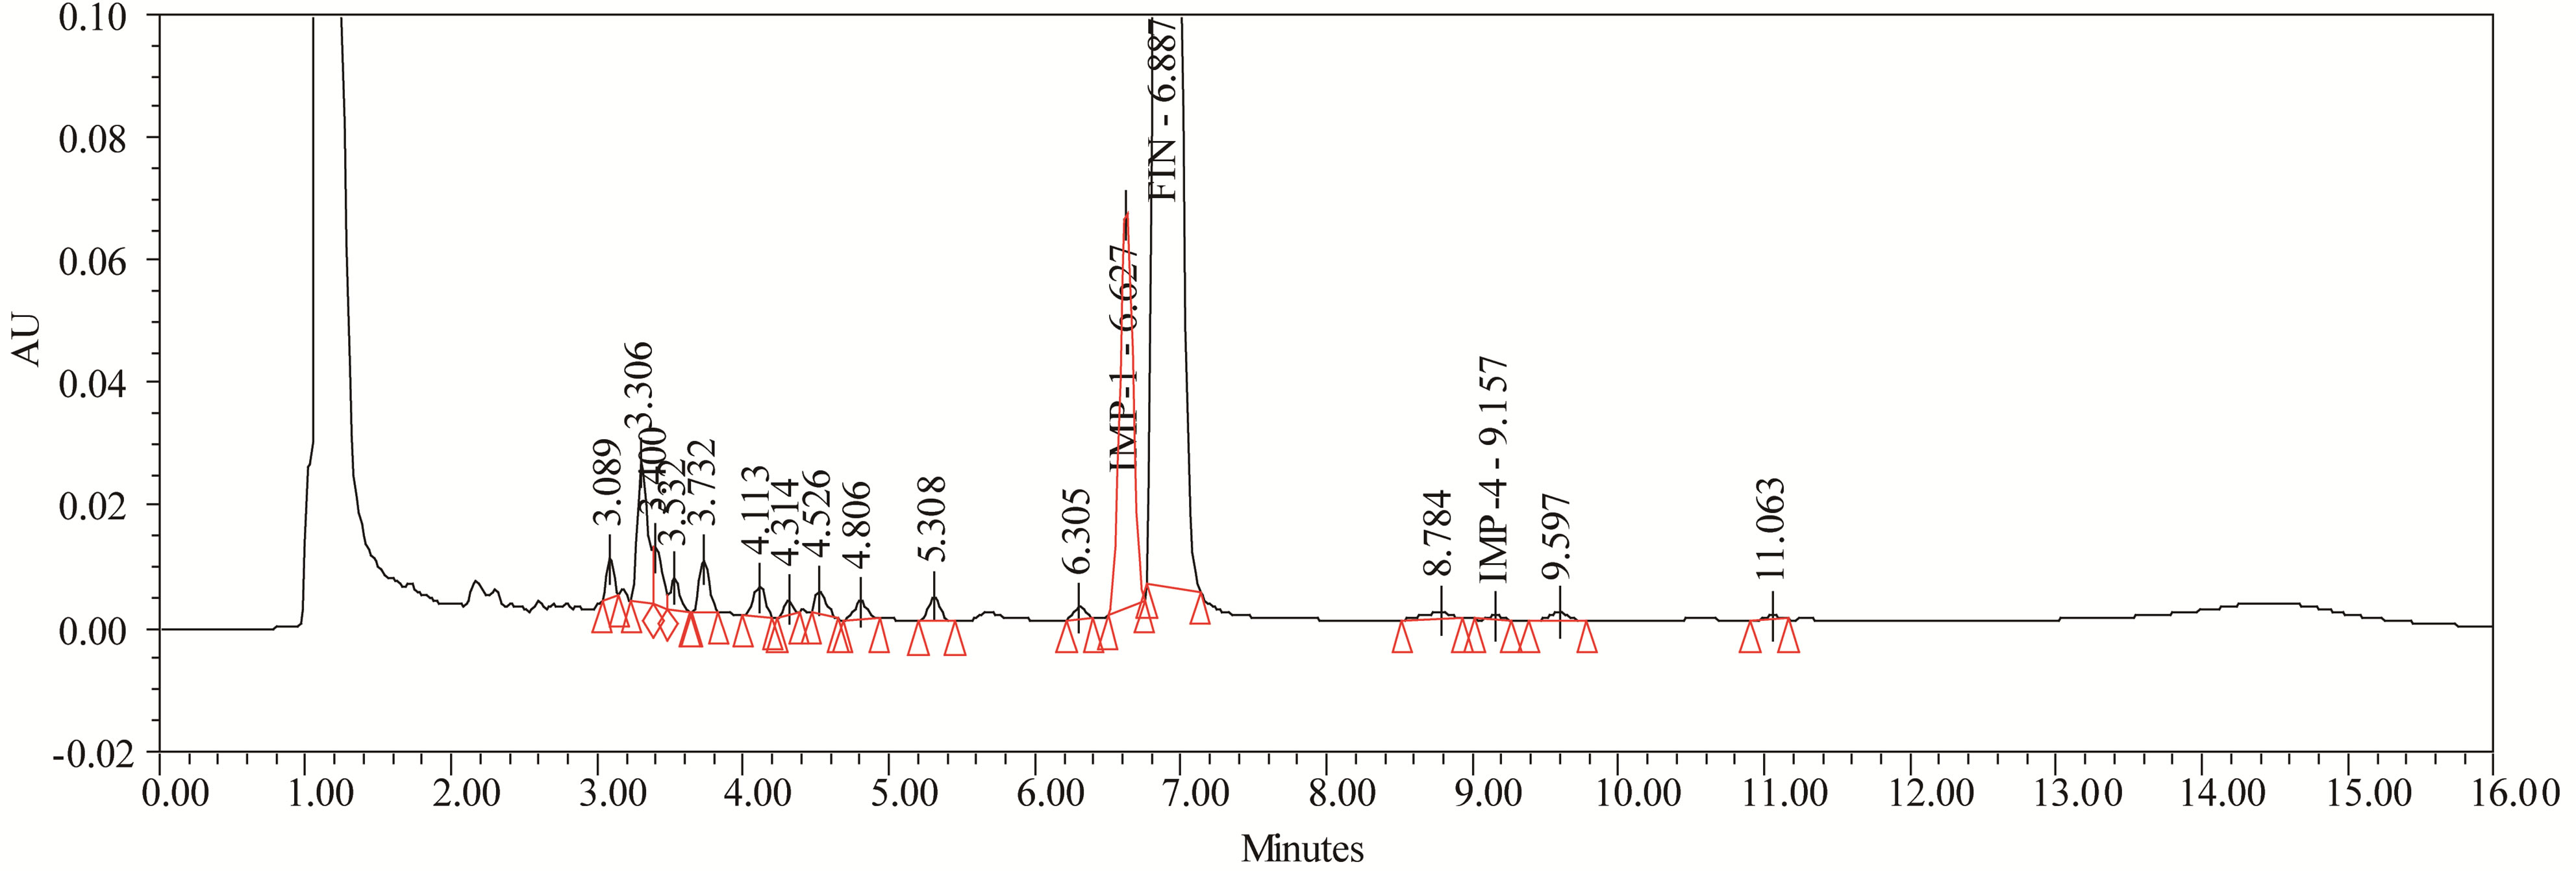
Figure 8. Typical chromatogram of oxidation degradation.
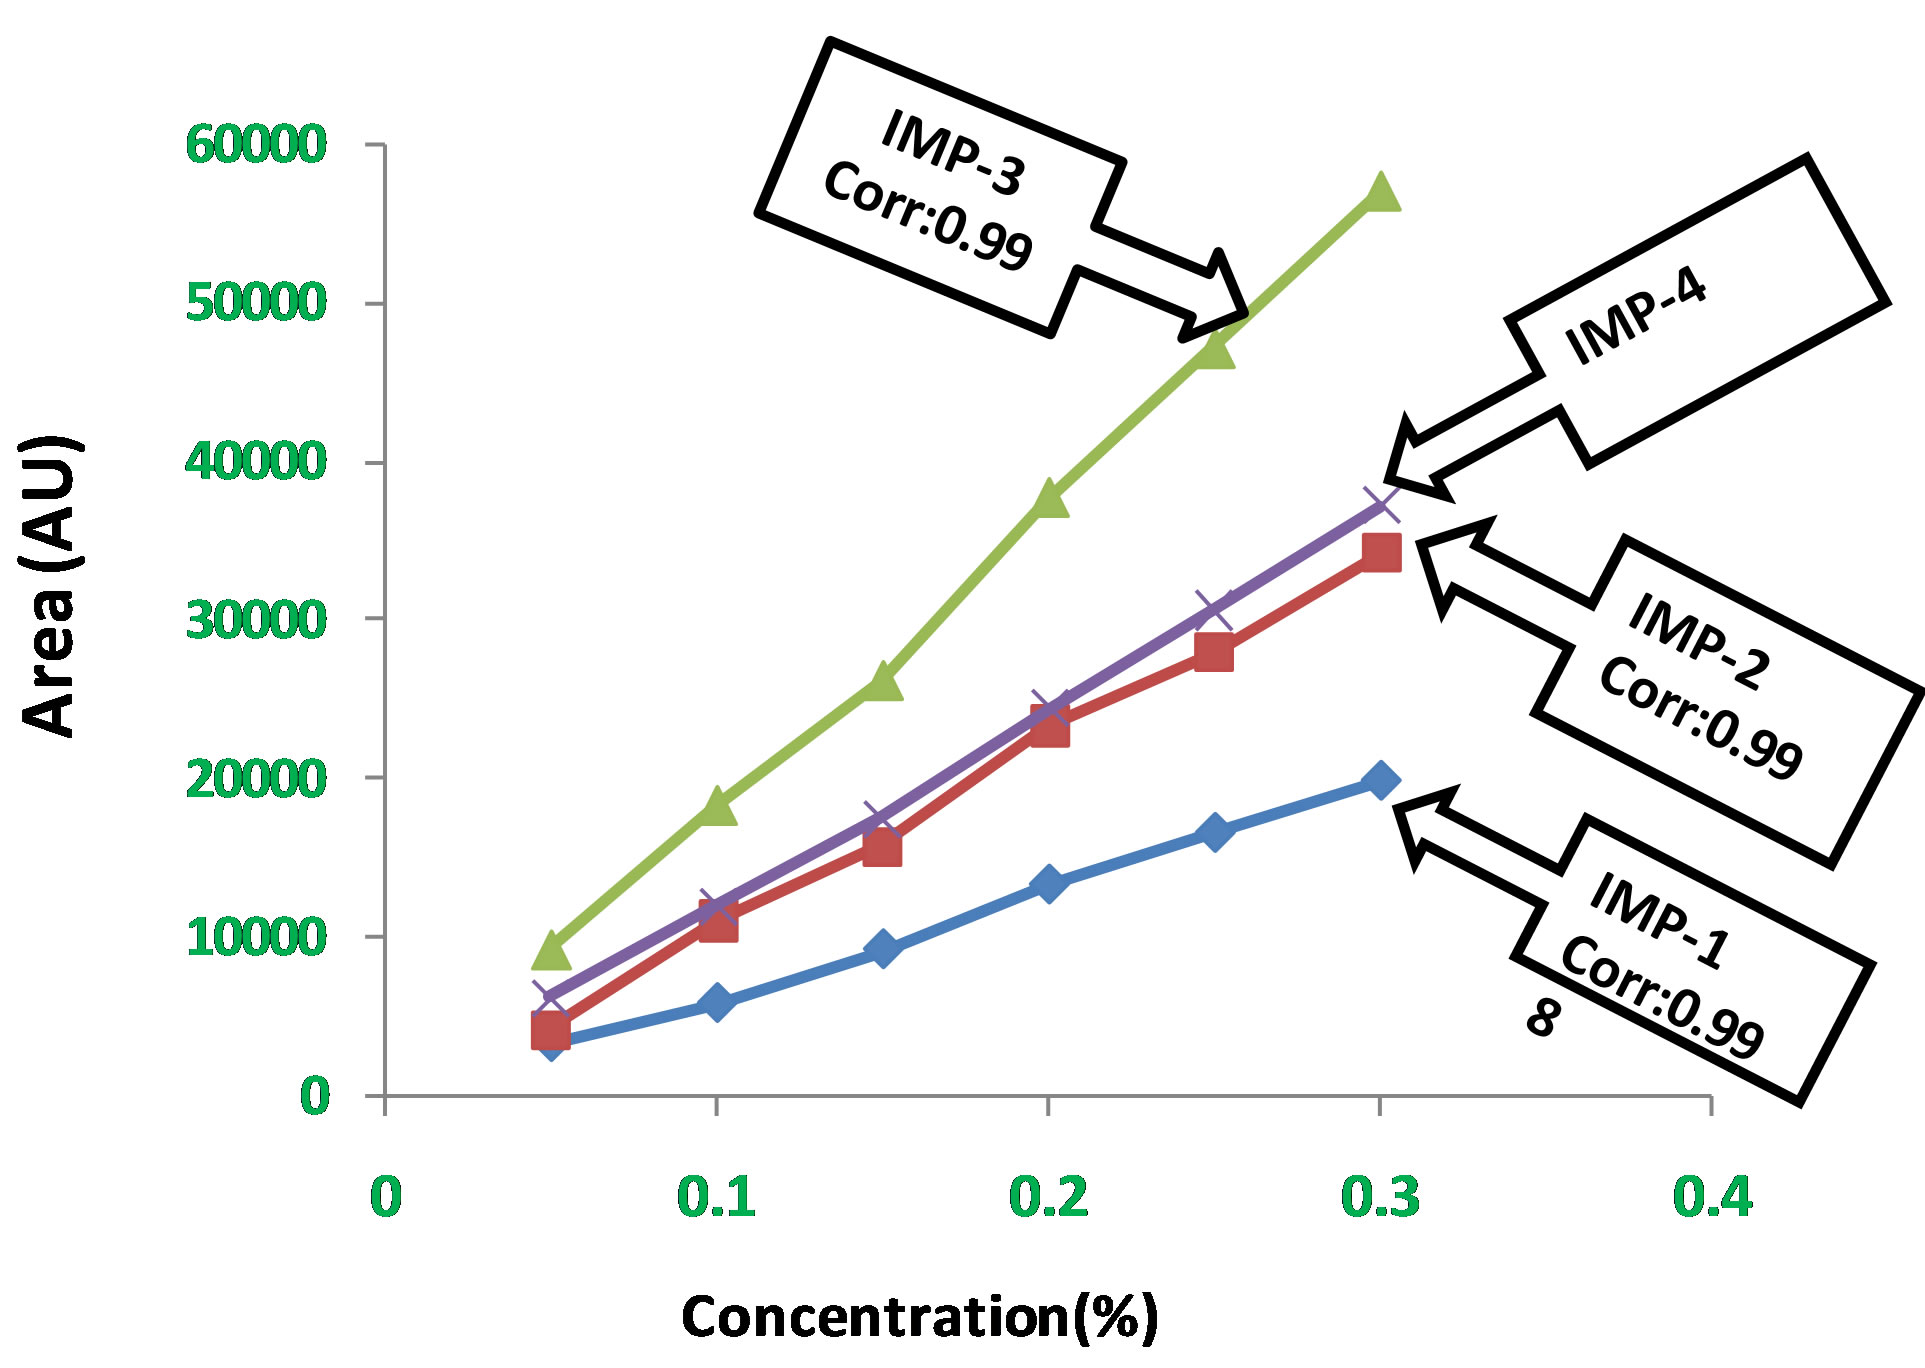
Figure 9. Calibration curve for LOD and LOQ.
3.3.6. Solution Stability and Mobile Phase Stability
No significant changes were observed in the content of Imp-1, Imp-2, Imp-3, Imp-4 and Imp-5 during solution stability and mobile phase stability experiments for related impurities. The %RSD of assay of FIN during solution stability and mobile phase stability experiments was
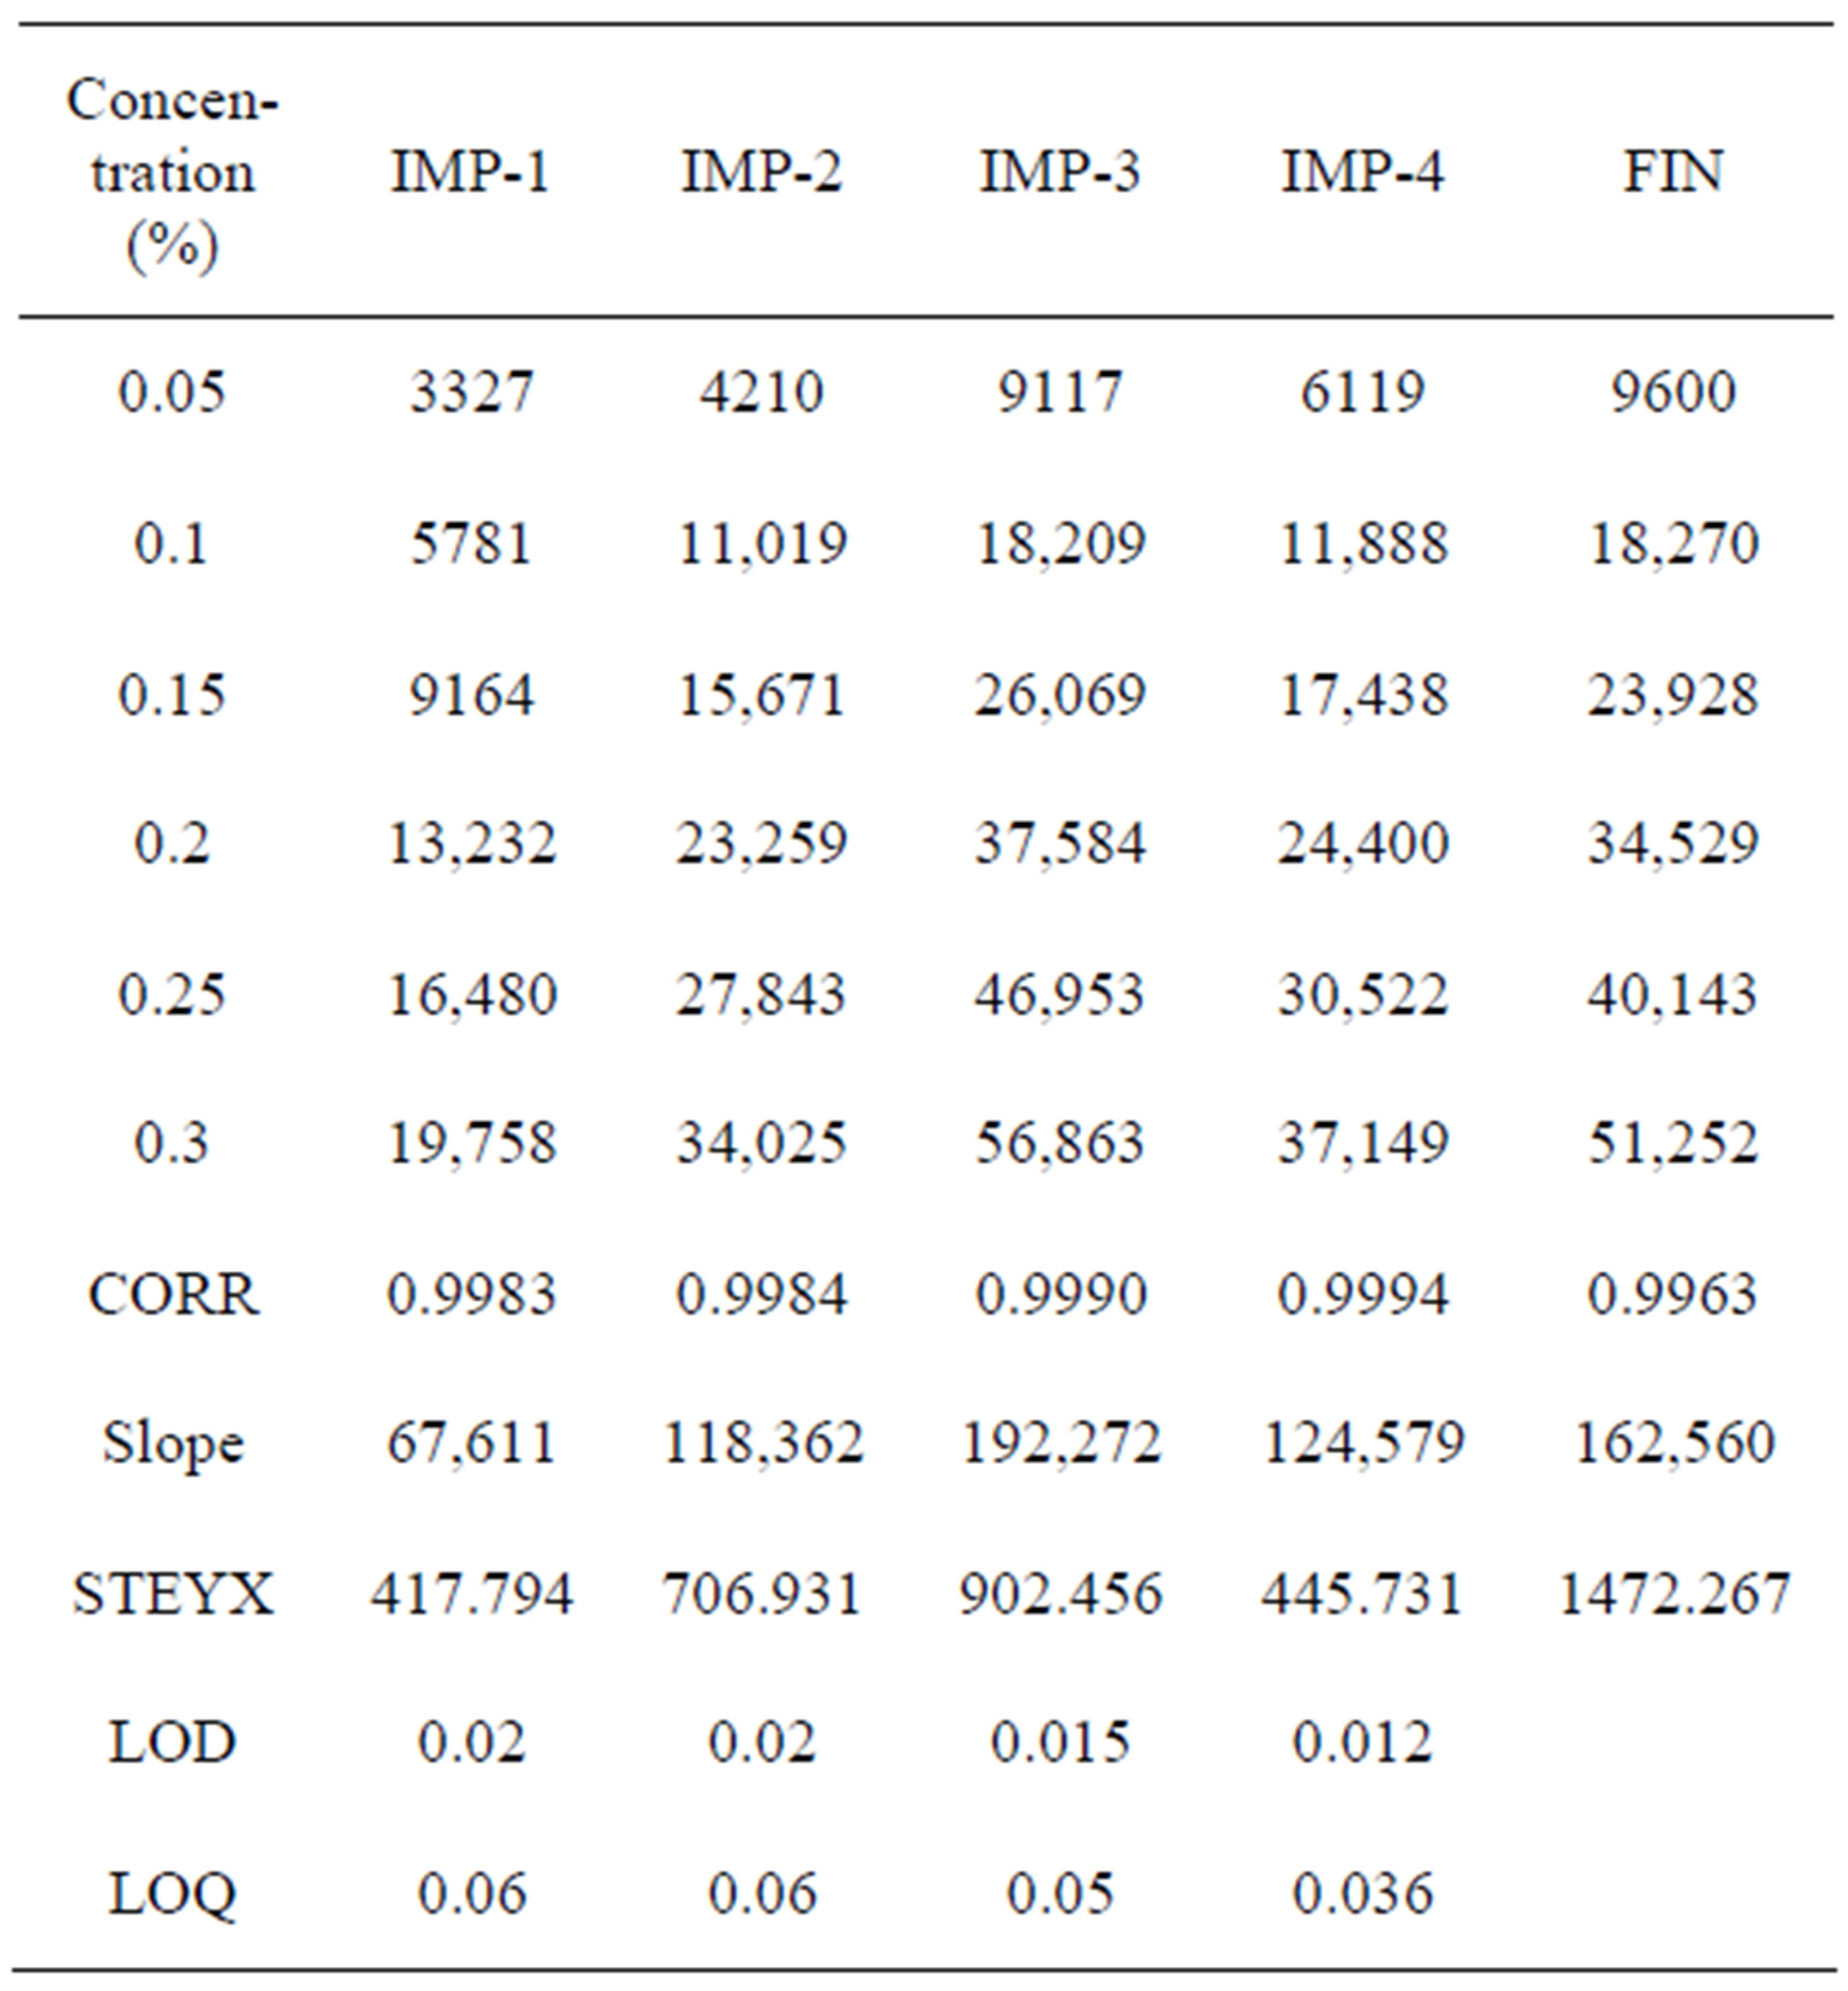
Table 3. LOD and LOQ experimental data.
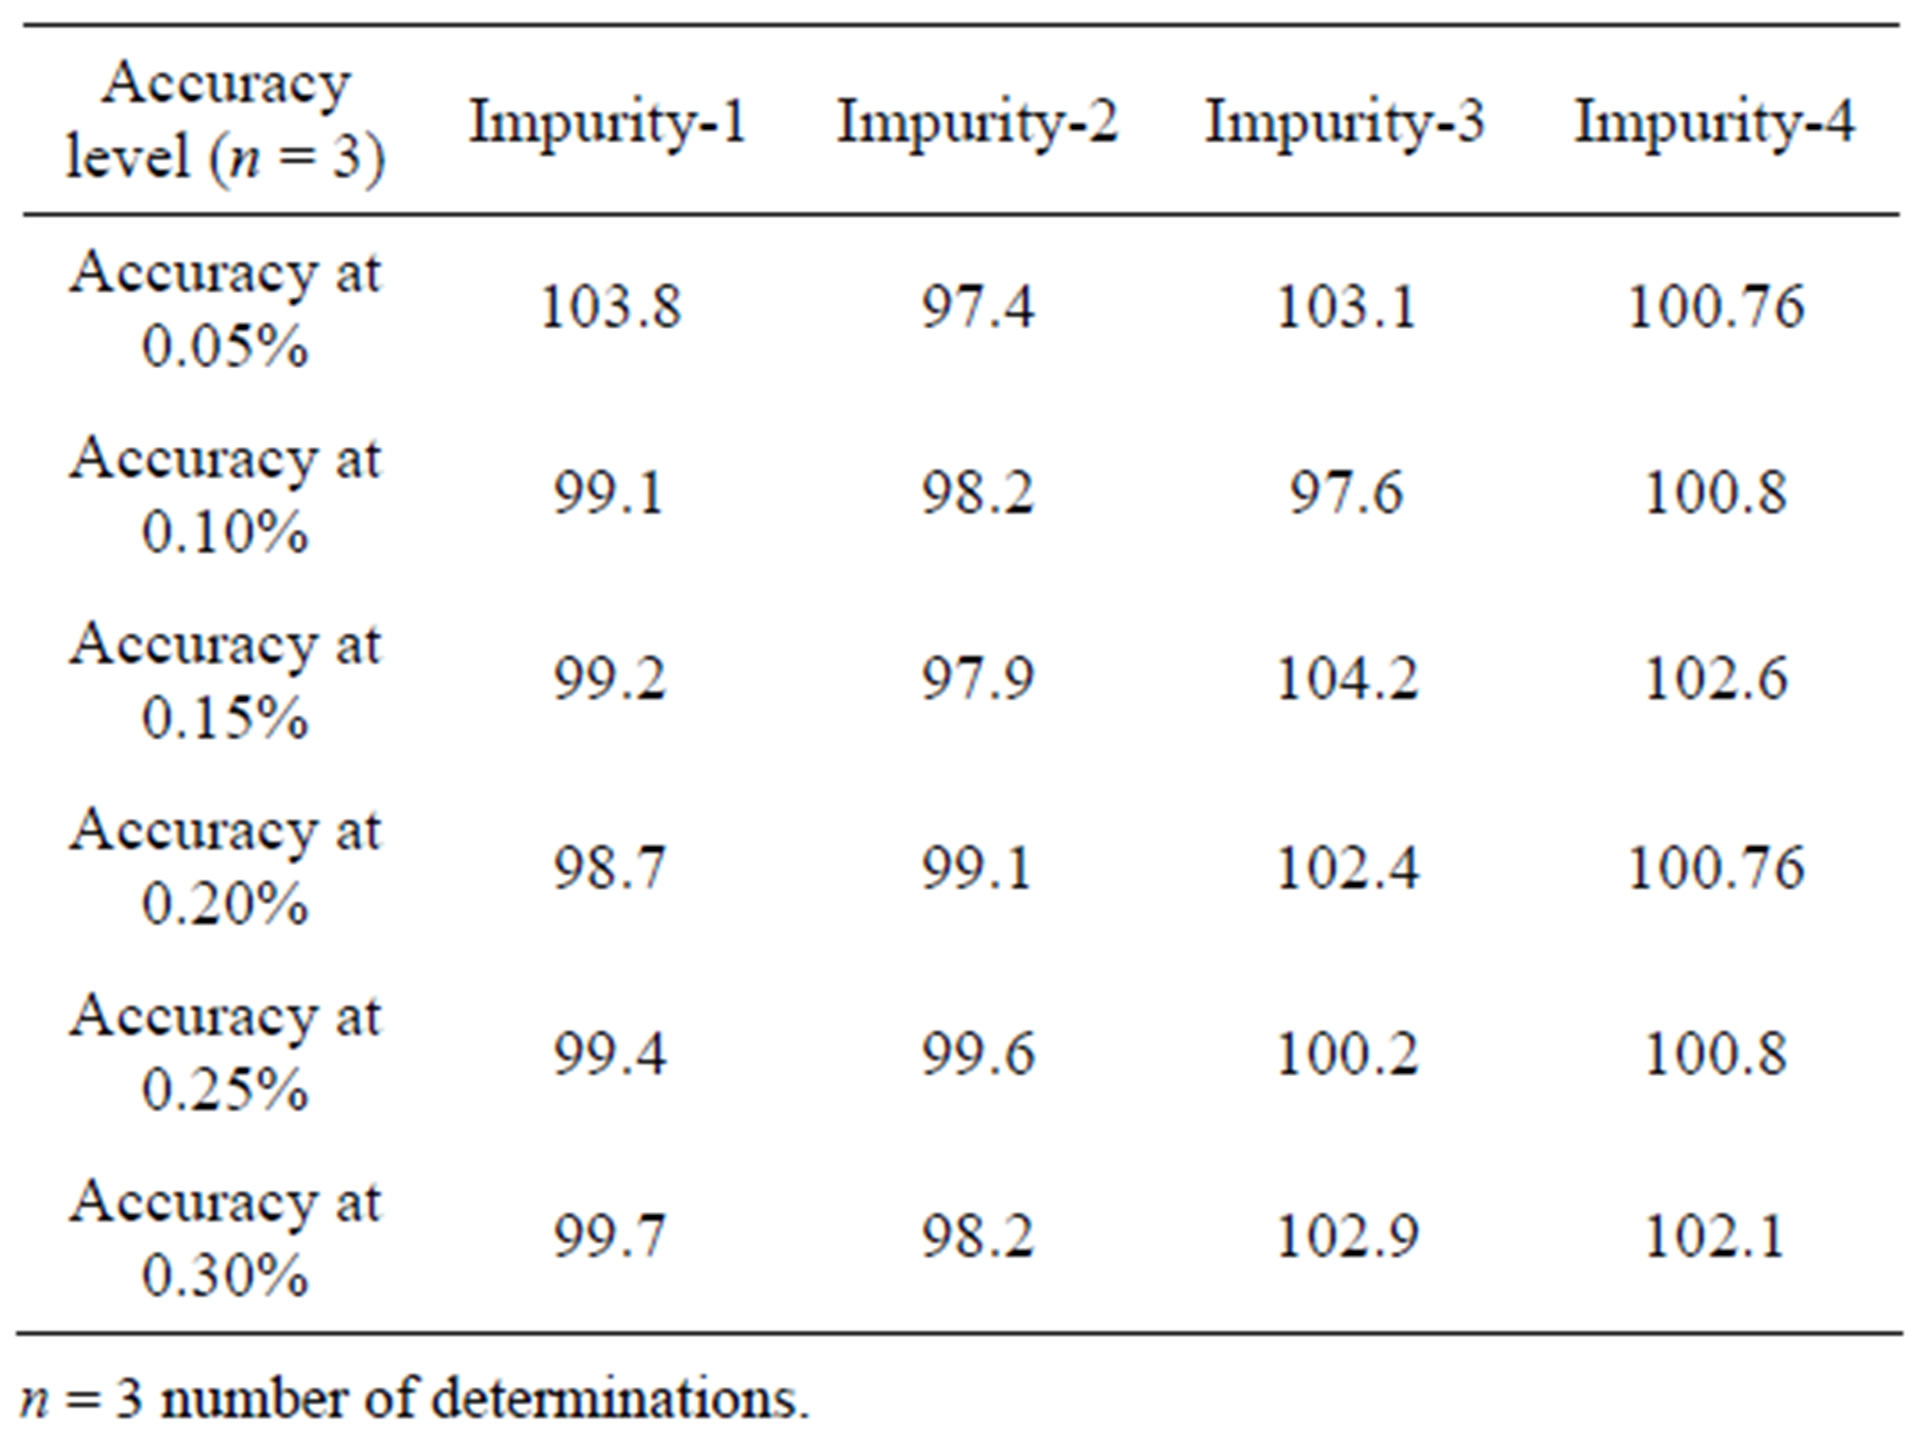
Table 4. Precision and accuracy data.
within 1.0. The solution stability and mobile phase stability experiments data confirms that sample solutions and mobile phase used during assay and related impurities determination were stable up to the study period of 48 h.
3.3.7. Assay Analysis
Analysis was performed for different batches of FIN in both bulk drug samples (n = 3) ranged from 99.95% - 99.96% and dosage forms (n = 3) ranged from 100.9% - 103.1%.
4. Conclusion
The RP-UPLC method developed for both assay and related impurities was linear, precise, accurate and specific. The method was completely validated showing satisfactory data for all the method validation parameters tested for both assay and related impurities as per ICH guidelines. The developed method is stability indicating and can be used for the routine analysis of production samples and also to check the stability of FIN samples same procedures on a different day (interday precision). To the best of our knowledge the specified method presented in the article successfully measures FIN and its related impurities by UPLC.
5. Acknowledgements
The authors wish to thank the management of Sri krishna chaityana college of Pharmacy, Madanapally, India for supporting this work.
REFERENCES
- D. S. Coffey and P. C. Walsh, “Clinical and Experimental Studies of Benign Prostatic Hyperplasia,” The Clinics of North America, Vol. 17, No. 3, 1990, pp. 461-474.
- M. A. Khan and A. W. Partin, “Finasteride and Prostate Cancer,” Reviews in Urology, Vol. 6, No. 2, 2004, pp. 97- 98.
- I. M. Thompson, P. J. Goodman, C. M. Tangen, M. S. Luci, G. J. Miller, L. G. Ford, M. M. Lieber, R. D. Cespedes, J. N. Atkins, S. M. Lippman, S. M. Carlin, A. Ryan, C. M. Szczepanek, J. J. Crowley and C. A. Coltman, “The Influence of Finasteride on the Development of Prostate Cancer,” The New England Journal of Medicine, Vol. 349, No. 3, 2003, pp. 215-224. Hdoi:10.1056/NEJMoa030660
- C. J. Girman, “Benign Prostatic Hyperplasia: An Overview,” British Journal of Urology, Vol. 82, No. S1, 1998, pp. 34-43. Hdoi:10.1046/j.1464-410X.1998.0820s1034.x
- H. A. Guess, H. M. Arrighi, E. J. Metter and J. L. Fozard, “Cumulative Prevalence of Prostatism Matches the Autopsy Prevalence of Benign Prostatic Hyperplasia,” The Prostate, Vol. 17, No. 3, 1990, pp. 241-246. Hdoi:10.1002/pros.2990170308
- T. Takano and S. Hata, “High-Performance Liquid Chromatographic Determination of Finasteride in Human Plasma Using Direct Injection with Column Switching,” Journal of Chromatography B: Biomedical Sciences and Applications, Vol. 676, No. 1, 1996, pp. 141-146. Hdoi:10.1016/0378-4347(95)00399-1
- P. Ptácek, J. Macek and J. Klíma, “Determination of Finasteride in Human Plasma by Liquid-Liquid Extraction and High-Performance Liquid Chromatography,” Journal of Chromatography B: Biomedical Sciences and Applications, Vol. 738, No. 2, 2000, pp. 305-310 Hdoi:10.1016/S0378-4347(99)00543-5H
- G. Carlucci and P. Mazzeo, “Finasteride in Biological Fluids: Extraction and Separation by a Graphitized Carbon Black Cartridge and Quantification by High-Performance Liquid Chromatography,” Journal of Chromatography B: Biomedical Sciences and Applications, Vol. 693, No. 1, 1997, pp. 245-248. Hdoi:10.1016/S0378-4347(97)00045-5
- A. Guarna, G. Danza, G. Bartolucci, A. Marrucci, S. Dini and M. Serio, “Synthesis of 5,6,6-[2H3]Finasteride and Quantitative Determination of Finasteride in Human Plasma at Picogram Level by an Isotope-Dilution Mass Spectrometric Method,” Journal of Chromatography B: Biomedical Sciences and Applications, Vol. 674, No. 2, 1995, pp. 197-204. Hdoi:10.1016/0378-4347(95)00323-1H
- S. M. Amer, “Polarographic Behavior and Determination of Finasteride,” II Farmaco, Vol. 58, No. 2, 2003, pp. 159- 163. Hdoi:10.1016/S0014-827X(02)00015-0
- S. T. Ulu, “A New Spectrophotometric Method for the Determination of Finasteride in Tablets,” Spectrochimica Acta Part A: Molecular and Biomolecular Spectroscopy, Vol. 67, No. 3-4, 2007, pp. 778-783. Hdoi:10.1016/j.saa.2006.08.032
- X. Chen, E. R. Gardner, D. K. Price and W. D. Figg, “Development and Validation of an LC-MS Assay for Finasteride and Its Application to Prostate Cancer Prevention Trial Sample Analysis,” Journal of Chromatographic Science, Vol. 46, No. 4, 2008, pp. 356-361.
- B. K. Matuszewski, M. L. Constanzer and C. M. ChavezEng, “Matrix Effect in Quantitative LC/MS/MS Analyses of Biological Fluids: A Method for Determination of Finasteride in Human Plasma at Picogram Per Milliliter Concentrations,” Analytical Chemistry, Vol. 70, No. 5, 1998, pp. 882-889. Hdoi:10.1021/ac971078+
- A. Almeida, S. Almeida, A. Filipe, S. Gagnon, A. Mirapeix, B. Girard and M. Tanguay, “Bioequivalence Study of Two Different Coated Tablet Formulations of Finasteride in Healthy Volunteers,” Arzneimittel-Forschung, Vol. 55, No. 4, 2005, pp. 218-222. Hdoi:10.1055/s-0031-1296848H
- F. G. de Menezes, W. Ribeiro, D. R. Ifa, M. E. de Moraes, M. O. de Moraes and G. DeNucci, “Bioequivalence Study of Finasteride. Determination in Human Plasma by HighPressure Liquid Chromatography Coupled to Tandem Mass Spectrometry,” Arzneimittel-Forschung, Vol. 51, No. 2, 2001, pp. 145-150. Hdoi:10.1055/s-0031-1300016
- F. Q. Guo, L. F. Huang, K. P. Wong, Y. H. Dai, Y. W. Li, Y. Z. Liang, K. L. Huang, K. J. Zhong and M. J. Wu, “A Rapid, Simple, Specific Liquid Chromatographic-Electrospray Mass Spectrometry Method for the Determination of Finasteride in Human Plasma and Its Application to Pharmacokinetic Study,” Journal of Pharmacy and Biomedical Analysis, Vol. 43, No. 4, 2007, pp. 1507-1513. Hdoi:10.1016/j.jpba.2006.10.024H
- J. Macek, “Separation of Finasteride and Analogues,” Journal of Chromatogrphy B: Biomedical Sciences and Applications, Vol. 764, No. 1-2, 2001, pp. 207-215. Hdoi:10.1016/S0378-4347(01)00317-6
- M. L. Constanzer, C. M. Chavez and B. K. Matuszewski, “Picogram Determination of Finasteride in Human Plasma and Semen by High-Performance Liquid Chromatography with Atmospheric-Pressure Chemical-Ionization Tandem Mass Spectrometry,” Journal of Chromatography B: Biomedical Applications, Vol. 658, No. 2, 1994, pp. 281- 287. Hdoi:10.1016/0378-4347(94)00250-9
- P. B. Phapale, H. W. Lee, M. S. Lim, E. H. Kim, S. D. Kim, J. Park, M. Lee, S. K. Hwang and Y. R. Yoon, “Rapid Determination of Finasteride in Human Plasma by UPLC-MS/MS and Its Application to Clinical Pharmacokinetic Study,” Journal of Chromatography B: Analytical Technologies and Biomed Life Sciences, Vol. 878, No. 20, 2010, pp. 1718-1723. Hdoi:10.1016/j.jchromb.2010.04.029H,
- S. Pedraglio, M. G. Rozio, P. Misiano, V. Reali, G. Dondio and C. Bigogno, “New Perspectives in Bio-Analytical Techniques for Preclinical Characterization of a Drug Candidate: UPLC-MS/MS in Vitro Metabolism and Pharmacokinetic Studies,” Journal of Pharmaceutical and Biomedical Analysis, Vol. 44, No. 3, 2007, pp. 665-673. Hdoi:10.1016/j.jpba.2006.12.012
- S. Fekete, J. Fekete and K. Ganzler, “Validated UPLC Method for the Fast and Sensitive Determination of Steroidresidues in Support of Cleaning Validation in Formulation Area,” Journal of Pharmaceutical and Biomedical Analysis, Vol. 49, No. 3, 2009, pp. 833-838. Hdoi:10.1016/j.jpba.2008.12.027
- P. R. Tiller, S. Yu, K. P. Bateman, J. Castro-Perez, I. S. McIntosh, Y. Kuo and T. A. Baillie, “Fractional Mass Filtering as a Means to Assess Circulating Metabolites in Early Human Clinical Studies,” Rapid Communications in Mass Spectrometry, Vol. 22, No. 22, 2008, pp. 3510- 3516. Hdoi:10.1002/rcm.3758H
- X. Sun, L. Niu, X. Li, X. Lu and F. Li, “Characterization of Metabolic Profile of Mosapride Citrate in Rat and Identification of Two New Metabolites: Mosapride N-Oxide and Morpholine Ring-Opened Mosapride by UPLC-ESIMS/MS,” Journal of Pharmaceutical and Biomedical Analysis, Vol. 50, No. 1, 2009, pp. 27-34. Hdoi:10.1016/j.jpba.2009.03.011
- ICH, “Stability Testing of New Drug Substances and Products (Q1AR),” International Conference on Harmonization, IFPMA, Geneva, 2000.
- “ICH Draft Guidelines on Validation of Analytical Procedures: Definitions and Terminology,” Federal Register, Vol. 60, No. 40, 1995, p. 11260.
NOTES
*Corresponding author.