American Journal of Analytical Chemistry
Vol.3 No.10(2012), Article ID:23623,6 pages DOI:10.4236/ajac.2012.310092
CD and DSC Investigation of Individual and Complex Influence of Meso-Tetra(4-Oxiethylpyridil) Porphyrin (TOEPyP4) and Its Zn-Complex on DNA
1E. Andronikashvili Institute of Physics, Tbilisi State University, Tbilisi, Georgia
2Department of Radiophysics, Erevan State University, Erevan, Armenia
Email: *j.monaselidze@aiphysics.ge, *marhakob@ysu.am
Received August 23, 2012; revised September 24, 2012; accepted September 30, 2012
Keywords: CD; Absorption; Microcalorimetry; Porphyrin
ABSTRACT
CD spectra of (DNA-TOEPyP4) + ZnTOEPyP4, (DNA-ZnTOEPyP4) + TOEPyP4, and DNA + (TOEPyP4-ZnTOEPyP4) complexes have been studied. It is shown that CD spectra of these triple complexes significantly differ from the DNA-TOEPyP4 and DNA-ZnTOEPyP4 double complex spectra, and they are not sum of these double complexes. Especially some strong differences in CD spectra of the triple and double complexes were observed when both porphyrins were added simultaneously into the DNA solution. In this case, ZnTOEPyP4 revealed a dominant influence on CD spectrum form. Zn-porphyrin also caused a strong intensity of positive band at 416 nm and a negative band at 437 nm when it was added into solution containing the DNA-TOEPyP4 complex. On the basis of obtained data, it was supposed that the observed significant changes in CD spectra of triple complexes were connected to an altered DNA conformation initiated by intercalation of porphyrin TOEPyP4 into GC-rich sites. The melting process analysis of the double complexes was carried out. The mechanisms of individual and joint influence of the porphyrins on DNA, and influence of binding modes on stability of these complexes are also discussed.
1. Introduction
Among ligands, a special attention is paid to the water soluble cation meso-tetra(4-N-oxyethylpyridil) porphyrins-TMPyP4 type porphyrins-because it is minimal toxic. It predominantly accumulates in tumor cells and binds to G-quadruplex of telomeric DNA [1,2], and defends it from high telomerase activity detaining growth of transformed cells in case of many leukemic diseases [3,4]. Its metal complexes can induce DNA strand cleavage at deoxyribose residues and initiate apoptosis of cancer cells [5]. In the classic works [6-9], the absorption mechanisms of the TMPyP4 porphyrins into DNA, AT and GT oligomers, and polynucleotide were investigated with the help of different physical technologies. The following have been demonstrated: intercalation, outside self-stacking and outside random binding of porphyrins to DNA. It was shown [7] that porphyrin plane molecules TMPyP intercalate between the base pairs of DNA double helix and they bind only to 5’CG3’ areas, and not to other sequences. Outside binding modes were studied in works [6-11]. It was also shown that these binding modes were formed mainly by porphyrins having axial ligands, which were absorbed on AT rich areas located in minor and major grooves, as well as double helix surface of DNA [12]. The outside random binding of TMPyP to DNA happens due to interaction of the positive charge of porphyrin pyrydil ring with the negative charge of phosphate groups. The self-stacking was studied in series of works [9,13]. It was shown that just this binding mode was the main reason for DNA aggregation. This is also connected to the electrostatic interaction between porphyrin and phosphate groups, but the strong intraplane interaction between porphyrins and DNA have the main contribution in formation of this mode.
The obtained results gave us a possibility to deeper understanding of TMPyP binding mechanism, including TMPyP binding to DNA in vitro and in situ, which is very important for understanding influence on chromatin DNA in live cells. In the given work we tried to characterize the joint influence of two different conformational conditions of TOEPyP4-plane porphyrin and its nonplane Zn-complex. TOEPyP4 is an analogue of TMPyP, according to its physical and chemical properties [14,15].
These investigations are important from medical point of view, because in case of many diseases, DNA in vivo may be attacked simultaneously not only by endogenes and exogenes porphyrins free from metals, but also by metal-containing porphyrins, some small proteins, as well as transition metal ions that can change the binding mode of porphyrins to DNA [3,16,17]. This can change the therapeutic effect of the drug, especially in case of photodynamic therapy. Therefore, we think that it is very important to know the mechanisms of combined influence of intercalating and non-intercalating (outside binding) porphyrins on DNA.
2. Materials and Methods
The water-soluble meso-tetra(4-N-oxyethylpyridil) porpyrin (TOEPyP4) and its Zn-containing analogue was synthesized in ESU according to the method described in work [18], and it was kindly granted by professor S. Haroutiunian. Calf thymus DNA was purchased from Sigma. Porphyrin concentration was determined spectrophotometrically by following coefficients of TOEPyP4: Mw = 940 Da, ε422 = 2.1 × 10⁵ M–1·cm–1; and ZnTOEPyP4: Mw = 1003 Da, ε440 = 1.3 × 10⁵ M–1·cm–1, where Mw is molecular weight, and ε422 and ε440 are Sore absorption bands initiated by binding of porphyrin to DNA. All studies were carried out in buffer solution 10 mM NaCl, 1 mM Na-phosphate, and Ph 7.02. DNA concentration was determined spectrophotometrically using the molar extinction coefficient ε258 = 6700 cm–1·M–1. The mixed ratio-r-was defined as molar ratio of porphyrin to DNA base pair. Absorption spectra were recorded on spectrophotometer UNICAM SP 1800 (UK) using 1.0 cm quartz cells. CD spectra were recorded on spectropolarimeter JASCO 500A at 20˚C using 1.0 cm quartz cells (CD is shown in millidegree of ellipticity). DNA concentration was 0.30 µM in all CD experiments. The doublehelix DNA-porphyrin complex heat properties were measured on DSC. The sensitivity was 0.1 µW, cell volume was 0.2 cm3, scanning rate was 0.75˚C/min, measuring interval was 20˚C - 140˚C [19,20].
3. Results
3.1. Absorption Spectra
Figure 1 presents an absorption spectra of TOEPyP4 and DNA-TOEPyP4 complex at r = 0.052. DNA concentration was 50.1 µM. As it is seen from the figure, addition of porphyrin leads to a significant batochrome shift, which is connected with intercalation of TOEPyP4 into GC rich DNA sites [6,21].
3.2. CD Study
The visual CD spectra of TOEPyP4 and ZnTOEPyP4
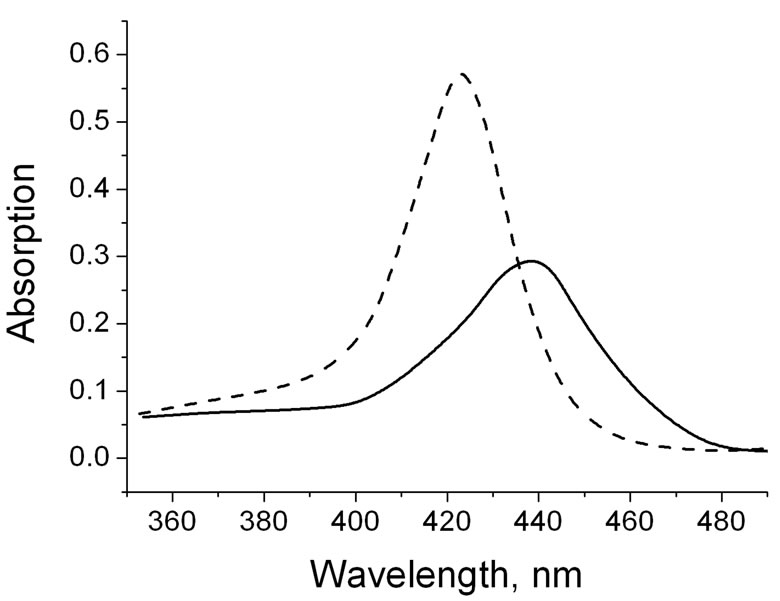
Figure 1. Absorption spectra: dashed line—TOEPyP4 alone, peak at 421 nm; and solid line—DNA-TOEPyP4 complex, r = 0.052, peak at 440 nm.
complex with calf thymus DNA are shown in Figures 2(a) and (b) at different r. CD spectra presented in Figure 2(a) are characterized with a negative band around 440 nm (r < 0.034) and a positive band around 416 nm (r < 0.034). At increase of r, the intensity of these bands increase and their maxima shift to the longer wavelength region. CD spectra in case of ZnTOEPyP4-DNA complex (Figure 2(b)) shows two positive bands—at 416 nm and at 435 nm at low value of r. At increase of r, the band intensity at 416 nm is more increased than intensity at 435 nm, and they become commensurable at r = 0.095. In spite of this, the maximum around 416 nm does not shift to any wavelengths region, and a band at 435 nm shifts by 8 nm to the longer wavelength region. The obtained data are in full agreement with early obtained CD results [6,11, 12,15].
Figure 3(a) shows that addition of ZnTOEPyP4 into solution containing DNA-TOEPyP4 complex did not change the form and intensity of CD negative band in the r region from 0.012 to 0.022 (see curves 1, 2, 3 and the insert). However, at increase of molar concentration of ZnTOEPyP4, the band around 440 nm did not become positive as it had been supposed (see Figure 2(b)), but on the contrary, its intensity increased. The tendency of intensity increase was observed up to r = 0.06, and the further increase of r weakly changed the intensity. The intensity of the 416 nm band significantly increases in the range 0.02 < r < 0.06, and the further increase of r weakly changes the intensity.
In case of addition of TOEPyP4 into solution containing r = 0.048 fixed concentration of DNA-ZnTOEPyP4 complex (see Figure 3(b), curve 1), the positive band at 440 nm that is characteristic for ZnTOEPyP4 complex (see Figure 2(b)) changes to negative; and when ZnTOEPyP4 molar concentration increases, the intensity of this band increases as well. Not less striking changes of CD spectrum were observed when mixture of equal molar concentrations of TOEPyP4 and Zn TOEPyP4
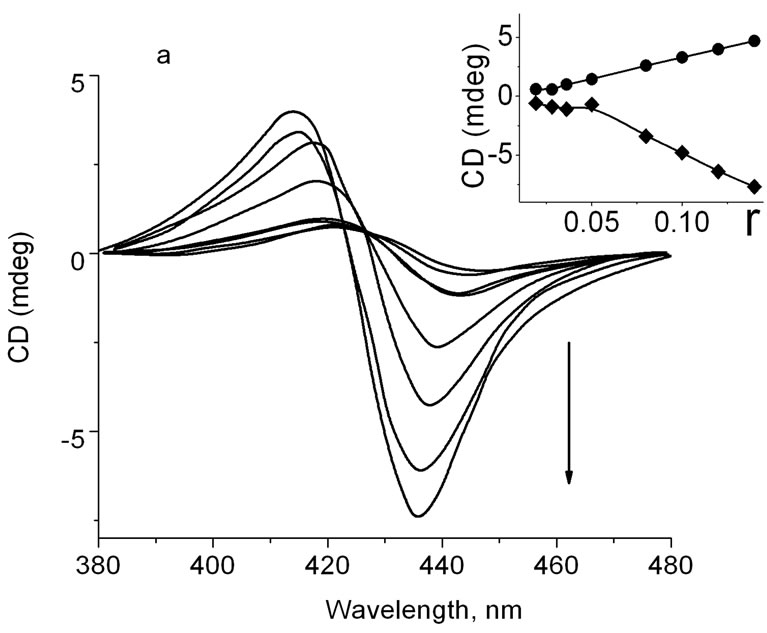
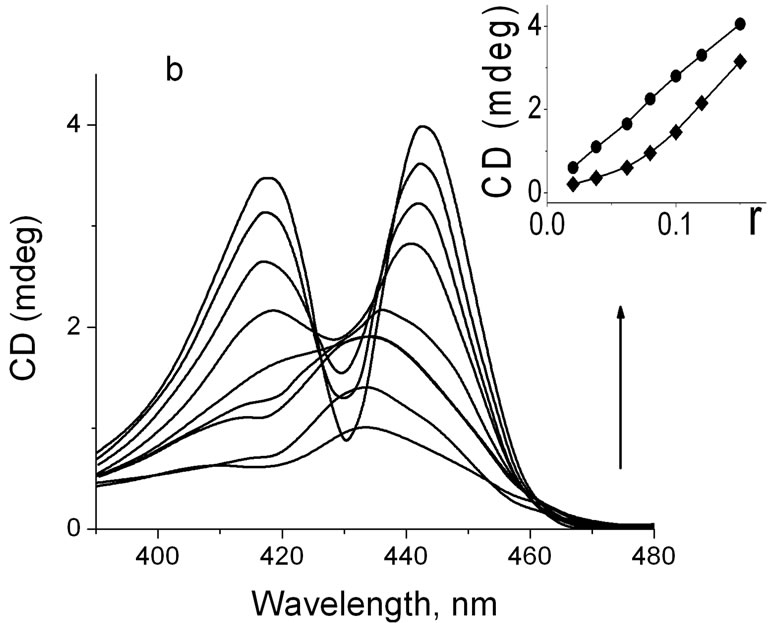
Figure 2. (a) CD spectra of DNA-TOEP4 complex at different r. To the direction of arrow, r = 0.019, 0.028, 0.34, 0.04, 0.05, 0.11, 0.12, and 0.14; Insert: dependence of CD spectra intensity of short wavelength maxima band (·), and long wavelength maxima band (¨) on r; (b) CD spectra of DNA-ZnTOEP4 complex at different r. To the direction of arrow, r = 0.02, 0.38, 0.056, 0.076, 0.096, 0.116, 0.134, 0.150; Insert: dependence of CD spectra intensity of short wavelength maxima band (·) and long wavelength maxima band (¨) on r.
were added into the DNA solution (Figure 4). It is seen that in range of R from 0.016 to 0.048 (R is summary porphyrin concentration), the CD spectrum has only two positive bands at 416 nm and 437 nm, but the intensities of both bands increases considerably in comparison with the same bands of DNA-ZnTOEPyP4 complex in the same region of r.
3.3. DSC Study
One of the important parameters characterizing the behavior of biological macromolecules and their complexes with ligands in solutions is their thermodynamic stability. In this respect, Differential Scanning Calorimetry (DSC) is a leader method because it gives a possibility to directly obtain such important parameters as melting enthalpy (DHm) and melting temperature (Tm) of transparent and turbid biopolymer solutions in a wide range of temperatures 2˚C - 140˚C. Figure 5 presents melting curves of
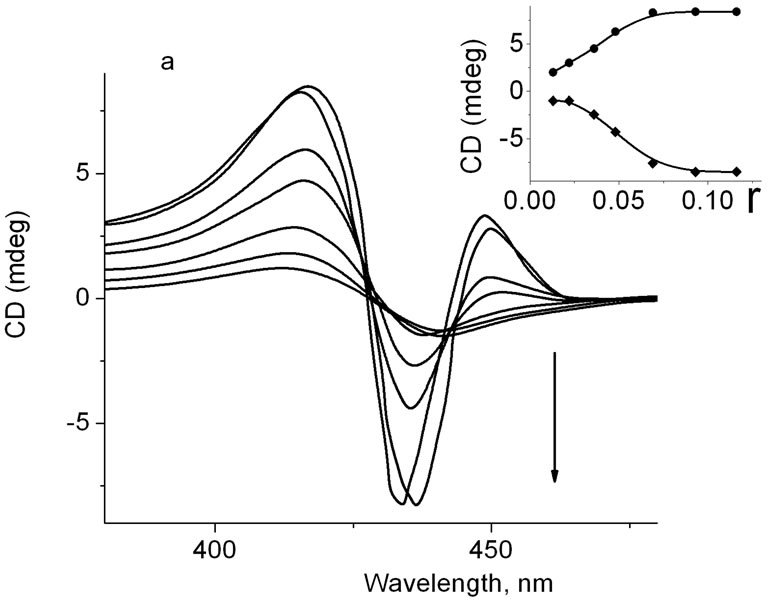
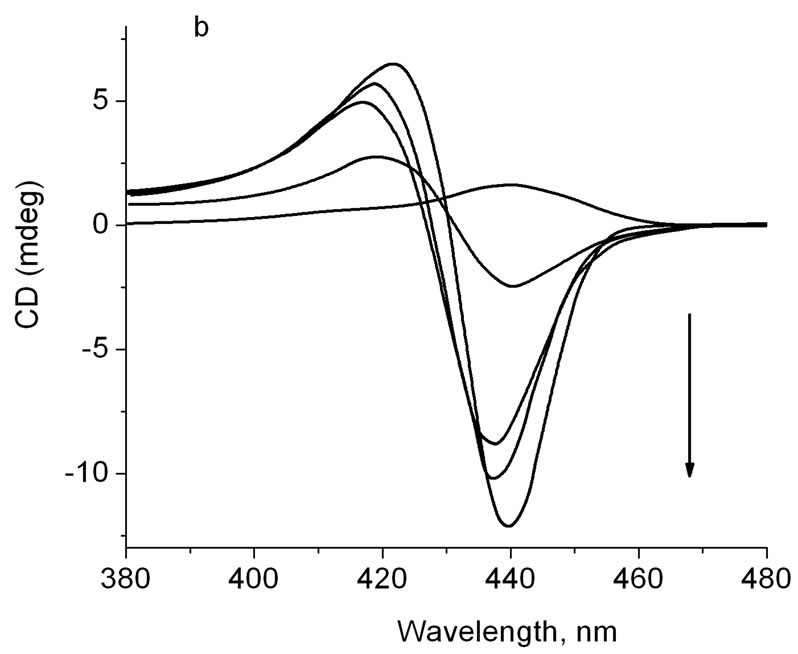
Figure 3. (a) CD of DNA-TOEPyP4 complex (r = 0.013) plus ZnTOEPyP4, at different r ZnTOEPyP/DNA. To the direction of arrow, r = 0.012, 0.022, 0.034, 0.046, 0.069, 0.093, 0.116. Insert: dependence of CD spectrum band intensity at 416 nm (·) and 435 nm (¨) on r; (b) CD of DNAZnTOEPyP4 complex (r = 0.045) plus TOEPyP4 at different TOEPyP4/DNA b.p. To the direction of arrow, r = 0.048, 0.024, 0.048, 0.072, 0.098.
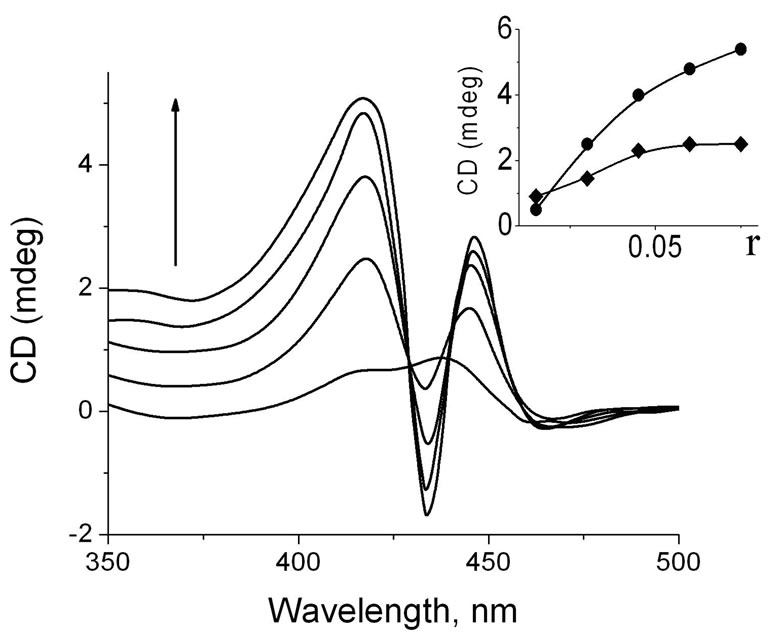
Figure 4. CD spectra of triple complex at addition of different concentrations of TOEPyP4 and ZnTOEPyP4 mixture to DNA solution. To the direction of arrow, r = 0.016, 0.032, 0.048, 0.064, 0.08, where r is ratio of summary concentration of 1:1 porphyrins TOEPyP4 + ZnTOEPyP4 per DNA nucleobasis. Insert: Dependence of CD band intensity of DNA-ТОЕPyP4-ZnТОЕPyP4 triple complex on r at 414 nm (Ñ) and 437 (·).
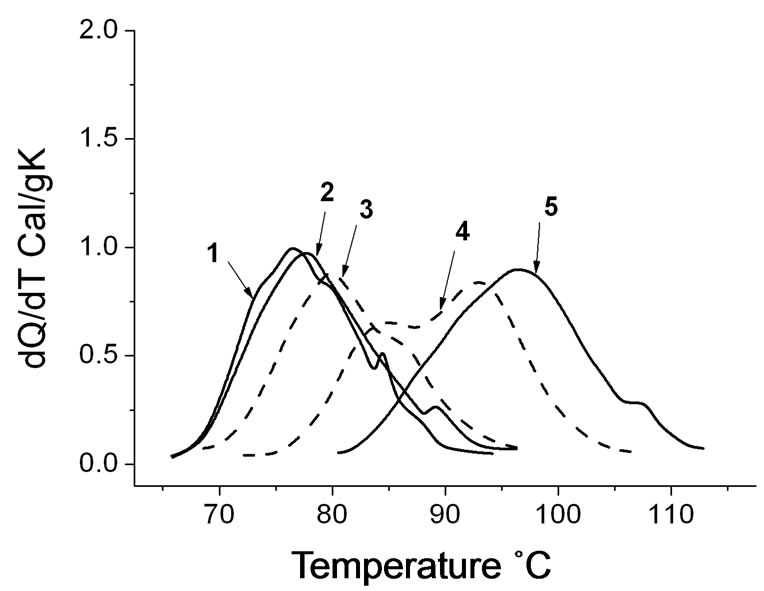
Figure 5. Microcalorimetric melting curves of DNA-TOEPyP4 and DNA-ZnTOEPyP4 solutions calculated per gram of dry mass (20 µM phosphate buffer, pH 7.02, CDNA = 0.16%). (1) DNA without porphyrin, Tmax at 76.9˚C and 84.8˚C; (2) r = 0.026, Tmax at 77.7˚C and 89.2˚C; (3) r = 0.026, Tmax at 79.8˚C; (4) r = 0.16, Tmax at 85˚C and 93.5˚C; (5) r = 0.16, Tmax at 98.0˚C and 108.0˚C. Solid line—native DNA, dotted lines—DNA-TOEPyP4, dashed lines—DNAZnTOEPy P4.
of calf thymus DNA, DNA-TOEPyP4, and DNAZnTOEPyP4 complexes at various molar ratio (r) values. According to data [20,22], at physiological conditions, the main melting stage of calf thymus DNA rich with AT pairs is at temperature 76˚C, and the satellite fraction rich with CG pairs melts at 85˚C . From the presented data, it is seen that both porphyrins considerably increase the melting temperature of DNA. TOEPyP4 is an intercalator, and it increases the satellite fraction melting temperature by 23˚C (see curve 5). ZnTOEPyP4 binds to the surface of the AT rich sequences and it increases the main stage melting temperature by 18˚C (see curve 6). These results at various r values are presented in Figure 6" target="_self"> Figure 6. As it is seen from the dependence T = f(r), in the range 0.01 < r < 0.025, Tm of DNA-TOEPyP4 complex increases by 0.8˚C, and Tm of DNA-ZnTOEPyP4 complex increases by 3.5˚C; in the range 0.05 < r < 0.08, Tm values of both complexes increase weakly and remain equal for them; and at r > 0.08, Tm values of both complexes increase sharply and they do not change at r = 0.2, where Tm of both complexes is 96˚C.
As the melting curve profile of calf thymus DNA is complex, the melting temperature Tm is the temperature at which the melting enthalpy equals half of summary melting enthalpy DHm, taking into consideration that a half of DNA molecules is in the helix state, and the other half is in the coil state.
4. Discussion
According to data of well studied TMPyP, it was determined that at low mixed ratios of TMPyP4/DNA and moderate ion strength of solutions, the negative CD signal is the main indicator of intercalative binding of
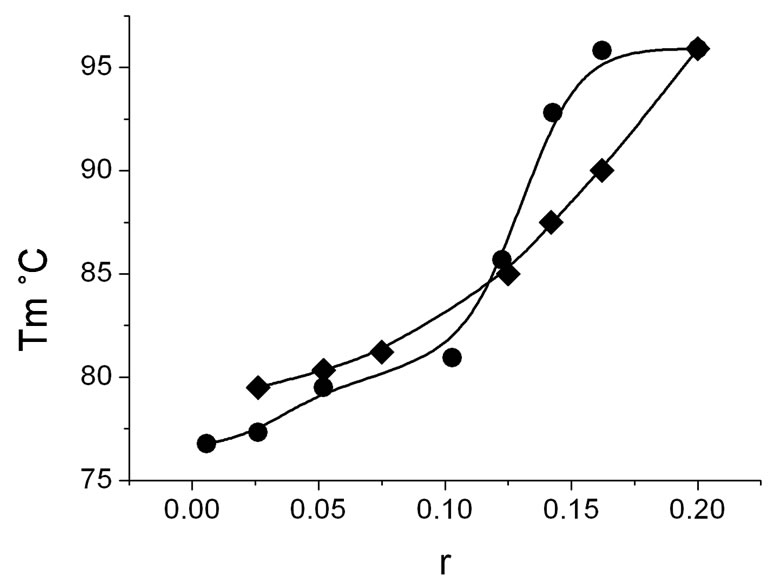
Figure 6. Dependence of melting temperature of DNATOEPyP4 (·) and DNA-ZnTOEPyP4 (¨) complexes at different r, where r is molar ratio of porphyrin to DNA. Tm is the temperature at which the melting enthalpy equals half of summary melting enthalpy DHm.
porphyrins to GC rich DNA sites, in particular to “5CG3” sites, and the positive CD signal serves as an evidence of outside binding modes [6,9,22]. At low values of ion strength and 1.0 mM NaCI, and at high r values in case of AT oligomers, besides two positive bands around 416 nm and 435 nm, a negative band appears on CD spectra, which is a sign of TMPyP incorporation into the large groove of double-helix olygomers with formation of selfstacking, according to some published data [11,12].
The CD spectra presented in Figures 2(a) and (b) coincide with the above mentioned data [6,9,11,12,21,23]. The linear dependence of the negative band intensity at r < 0.05 and the linear dependence of positive band intensity on r in the range from 0.02 to 0.16 in case of TOEPyP4-DNA complex indicate the homogeneous binding modes, in particular intercalation between the GC base pairs and a moderate surface binding on DNA minor groove. But at higher r, the extensive TOEPyP4 selfstacking in major groove takes place.
ZnTOEPyP4 has one axial ligand. It cannot intercalate between the basis pairs of DNA double helix because of its steric sizes; and when binding to DNA, it forms regular piles on the external surface of the double helix initiating two positive CD bands (Figure 2(a), see Insert). The linear dependence of both positive bands in the range r from 0 to 0.91 serves as an evidence of the fact that these two binding modes are homogeneous and they are independent from each other. Different pictures were observed when various concentrations of Zn-TOEPyP4 were added to the solution containing TOEPyP4-DNA complex (r = 0.012) (Figure 3(a)). At addition of Znporphyrin to the studied complex within the range 0.01 < r < 0.22, and at linear increase of positive band at 416 nm within the range 0.012 < r < 0.06, the invariability of the negative CD band intensity demonstrates that TOEPyP4- DNA-ZnTOEPyP4 forms only one mode of groove binding in the newly formed triple complex. The sharp intensity increase of positive and negative bands and their linear character in the range 0.022 < r < 0.06, which were not observed for double complexes DNATOEPyP4 and DNA-Zn-porphyrin, needs explanation.
On the basis of some experimental data [6,11-14,23], we propose the following explanation. TOEPyP4 that intercalates into the GC rich sites induces not only local damages, but also causes distortion of the standard B-form of DNA [6,23]. As a result, the intercalation or selfstacking becomes possible into the AT sites, which were impossible for Zn-porphyrin in absence of TOEPy P4. This mechanism of DNA conformation changes that is caused by intercalation of TOEPyP4 also gives us a possibility to explain those strong CD changes, which are observed in case of binding of Zn-porphyrin to DNATOEPyP4 complex (Figure 3(a)) and formation of triple complex at addition of both porphyrins into the DNA mixture (Figure 4). In case of addition of TOEPyP4 into the solution containing the DNA-Zn-porphyrin complex, the added porphyrin preferably intercalates into the GC rich sites, because the binding constant of TOEPyP4 is more than binding constant of ZnTOEPyP4 [24-26]. This addition causes changes in DNA conformation, which leads to release of Zn-porphyrin from the binding sites. The positive band disappears at 437 nm and a negative band appears at 437 nm with intensity of the band equal to intensity of DNA-POEPyP4 complex band (Figure 3, curve 2). The intensity of both bands increase at increase of added Zn-porphyrin. At simultaneous influence of both porphyrins on DNA, first TOEPyP4 intercalates into the GC rich sites and changes DNA conformation, and only then ZnPOEPyP4 and TOEPyP4 bind onto the doublehelix surface in the range 0.016 < r < 0.048 (Figure 4, see Inset).
DSC investigations give additional information about binding mechanism of TOEPyP4 and its Zn-complexes. Both porphyrins cause a serious stabilization of DNA, in 0.012 < r < 0.22. In case of low concentrations, when one porphyrin molecule is per 40 DNA b.p., mainly two binding modes proceed: 1) TOEPyP4 intercalation between GC pairs, and 2) surface monomer binding-outside random binding of Zn-porphyrin. In the second case, the DNA-ZnTOEPyP4 complex melting temperature increases by 3.5˚C, and the melting temperature of porphyrin without Zn ion increases only by 0.8˚C. In the range 0.05 < r < 0.08, when both porphyrins bind to the DNA surface, the melting temperatures of the complexes are equal, and they are about 80˚C. Further increase of r leads to a sharp increase of the melting temperature of both complexes by 16˚C.
5. Acknowledgements
This work is supported by the IPP/ISTC A-1951 Project.
REFERENCES
- T. I. Gaynutdinov, R. D. Neuman and I. G. Panyutin, “Structural Polymorphism of Intramolecular Quadruplex of Human Telomeric DNA: Effect of Cations, Quadruplex-Binding Drugs and Flanking Sequences,” Nucleic Acid Research, Vol. 36, No. 12, 2008, pp. 4079-4087. doi:10.1093/nar/gkn351
- E. Izbicka, R. T. Wheelhouse, E. Raymond, K. K. Davison, R.A. Lawrence, D. Sun, B. E. Windle, L. H. Hurley and D. D. Von Hoff, “Effects of Cationic Porphyrins as G-Quadruplex Interactive Agents in Human Tumor Cells,” Cancer Research, Vol. 59, No. 3, 1999, pp. 639-644.
- C. L. Grand, H. Han, R. M. Munoz, S. Weitman, D. D. Von Hoff, L. H. Hurley and D. J. Bearss, “The Cationic Porphyrin TMPyP4 Down-Regulates C-MYC and Human Telomerase Reverse Transcriptase Expression and Inhibits Tumor Growth in Vivo,” Molecular Cancer Therapeutics, Vol. 1, No. 8, 2002, pp. 565-573.
- M. A. Shammas, R. J. Shmookler, M. Akiyama, H. Koley, D. Chauhan, T. Hideshima, R. K. Goyal, L. H. Hurley, K. C. Anderson and N. C. Munshi, “Telomerase Inhibition and Cell Growth Arrest Following Porphyrin Treatment of Multiple Myeloma Cells,” Molecular Cancer Therapeutics, Vol. 2, No. 9, 2003, pp. 825-833.
- M. Benett, A. Krah, F. Wien, F. Carman, R. Mekenna, M. Sanderson and S. Neidle, “A DNA-Porphyrin MinorGroove Complex at Atomic Resolution: The structural Consequences of Porphyrin Ruffing,” Proceedings of the National Academy of Sciences, Vol. 97, No. 17, 2000, pp. 9476-9481. doi:10.1073/pnas.160271897
- R. J. Fiel, “Porphyrin-Nucleic Acid Interactions: A Review,” Journal of Biomolecular Structure and Dynamics, Vol. 6, No. 6, 1989, pp. 1259-1274. doi:10.1080/07391102.1989.10506549
- L. G. Marzilli, L. D. Banville, G. Zon and W. D. Wilson, “Pronounced H-1 and P-31 NMR Spectral Changes on Meso-Tetrakis (N-methylpyridinium-4-yl) Porphyrin Binding to Poly [d(G-C)]·poly[d(G-C)] and to 3-Tetradecaoligodeoxyribonucleotides: Evidence for Symmetric, Selective Binding to 5’CG3’ Sequences,” Journal of the American Chemical Society, Vol. 108, 1986, pp. 4188-4192.
- E. J. Gibbs, I. Tinoco Jr., M. F. Maestre, P. A. Ellinas and R. F. Pasternack, “Self-Assembly of Porphyrins on Nucleic Acid Templates,” Biochemical and Biophysical Research Communications, Vol. 157, No. 1, 1988, pp. 350- 358. doi:10.1016/S0006-291X(88)80054-8
- R. F. Pasternack, S. Ewen, A. Rao, A. S. Meyer, M. A. Freedman, P. J. Collings, S. L. Frey, M. C. Ranen and J. C. De Paula. “Interaction of Copper (II) Porphyrins with DNA,” Inorganica Chimica Acta, Vol. 317, No. 1-2, 2001, pp. 59-71. doi:10.1016/S0020-1693(01)00340-1
- M. A. Ismail, P. M. Rodger and A. Rodger, “Drug SelfAssembly on DNA: Sequence Effects with Trans-Bis (4-N-Methylpyridiniumyl) Diphenyl Porphyrin and Hoechst 33258,” Journal of Biomolecular Structure and Dynamics, Vol. 11, No. 1, 2000, pp. 335-348. doi:10.1080/07391102.2000.10506639
- J. Kim, Y. A. Lee, B. H. Yun, S. W. Han, S. T. Kwag and S. K. Kim, “Binding of Meso-Tetrakis (N-methylpyridinium- 4-yl) Porphyrin to AT Oligomers: Effect of Chain Length and the Location of the Porphyrin Stacking,” Biophysical Journal, Vol. 86, No. 2, 2004, pp. 1012-1017. doi:10.1016/S0006-3495(04)74176-4
- S. Lee, Y. A. Lee, H. M. Lee, J. Y. Lee, D. H. Kim and S. K. Kim, “Rotation of Periphery Methylpyridine of MesoTetrakis (n-N-methylpyridiniumyl) Porphyrin (n = 2, 3, 4) and Its Selective Bindingto Native and Synthetic DNAs,” Biophysical Journal, Vol. 83, No. 1, 2002, pp. 371-381. doi:10.1016/S0006-3495(02)75176-X
- D. L. Banville, L. G. Marzilli, J. A. Strickland and W. D. Wilson, “Comparison of the Effects of Cationic Porphyrins on DNA Properties: Influence of GC Content of Native and Synthetic Polymers,” Biopolymers, Vol. 25, No. 10, 1986, pp. 1837-1858. doi:10.1002/bip.360251003
- Y. Dalyan, S. Haroutiunian, G. Ananyan, V. Vardanyan, V. Madakyan, R. Kazaryan, L. Saakyan, L. Messory, P. Orioli and A. Benight, “Interaction of Meso-Tetra-(4-NOxyethylpyridyl) Porphyrin, Its 3-N Analog and Their Metallo-Complexes with Duplex DNA,” Journal of Biomolecular Structure and Dynamics, Vol. 18, No. 5, 2001, pp. 677-687. doi:10.1080/07391102.2001.10506698
- A. A. Ghazaryan, Y. B. Dalyan, S. G. Haroutiunian, V. I. Vardanyan, R. K. Ghazaryan and T. V. Chalikian, “Thermodynamics of Interactions of TAlPyP4 and AgTAlPyP4 Porphyrins with Poly(rA)poly(rU) and Poly(rI)poly(rC) Duplexes,” Journal of Biomolecular Structure and Dynamics, Vol. 24, No. 1, 2006, pp. 67-74. doi:10.1080/07391102.2006.10507100
- N. Nagesh and A. G. Kumar, “Interaction of TMPyP4, TMPyP3 and TMPyP2 with Intramolecular G-Quadruplex Formed by Promoter Region of BCl2 and KRAS NHPPE,” ISRN Biophysics, Vol. 2012, No. 2012, 2012, 12 p.
- V. N. Madakyan, R. K. Kazaryan, M. A. Khachatryan, A. S. Stepanyan, T. S. Kurtikyan and M. B. Ordyan, “New Derivatives of Meso-Tetra(4-Pyridil) Porphyrins and Some of Their Transformations,” Chemia of Geterotsiklicheskikh Soedinenii (Russian), Vol. 2, 1986, pp. 212-216.
- B. I. Kankia, G. Barany and K. Musier-Forsyth, “Unfolding of DNA Quadruplexes Induced by HIV-1 Nucleocapsid Protein,” Nucleic Acids Research, Vol. 33, No. 14, 2005, pp. 4395-4403. doi:10.1093/nar/gki741
- J. Monaselidze, M. Abuladze, N. Asatiani, E. Kiziria, S. Barbakadze, G. Majagaladze, M. Iobadze, L. Tabatadze, H. Y. Holman and N. Sapojnikova, “Characterization of Chromium-Induced Apoptosis in Cultured Mammalian Cells: A Different Scanning Calolorimetry Study,” Thermochemia Acta, Vol. 441, 2006, pp. 8-15.
- J. R. Monaselidze, M. T. Kiladze, M. Z. Gorgoshidze, D. G. Khachidze, V. G. Bregadze, E. M. Lomidze and T. A. Lezhava, “Microcalorimetric Study of DNA-Cu(II)- TOEPyP(4) Porphyrin Complex,” Journal of Thermal Analysis and Calorimetry, Vol. 108, No. 1, 2012, pp. 127-131. doi:10.1007/s10973-011-1669-4
- D. L. Banville, L. G. Marezilli, J. A. Strickland and W. D. Wilson, “Comparison of the Effects of Cationic Porphyrins on DNA Properties: Influence of GC Content of Native and Synthetic Polymers,” Biopolymers, Vol. 25, No. 10, 1986, pp. 1837-1858.
- A. D. Voskoboinik, J. R. Monaselidze, G. N. Mgeladze, Z. I. Chanchalashvili, Y. S. Lazurkin and M. D. FrankKamenetski, “Investigation of DNA Melting in the Inversion of Relatively Stable Sites with AT and GC Pairs,” Molecular Biology, Vol. 9, 1975, pp. 783-789. doi:10.1002/bip.360251003
- M. J. Carvin, E. Mark, R. Fiel and J. C. Howard, “Intercalative and Non-Intercalative Binding of Large Cationic Porphyrin Ligands to Polynucleotides,” Nucleic Acid Research, Vol. 11, No. 17, 1983, pp. 6141-6154. doi:10.1093/nar/11.17.6141
- R. J. Fiel, J. C. Howard, E. H. Mark and N. Datta-Gupta, “Interaction of DNA with a Porphyrin Ligand: Evidence for Intercalation,” Nucleic Acid Research, Vol. 6, No. 9, 1979, pp. 3093-3118. doi:10.1093/nar/6.9.3093
- R. F. Pasternack, D. Sidney, P. A. Hunt, E. A. Snowden and E. J. Gibbs, “Interactions of Water Soluble Porphyrins with Z-Poly(dG-dC),” Nucleic Acid Research, Vol. 14, No. 9, 1986, pp. 3927-3943. doi:10.1093/nar/14.9.3927
- M. A. Sari, J. P. Battioni, D. Dupré, D. Mansuy and J. B. Le Pecq, “Interaction of Cationic Porphyrins with DNA: Importance of the Number and Position of the Charges and Minimum Structural Requirements for Intercalation,” Biochemistry, Vol. 29, No. 17, 1990, pp. 4205-4215. doi:10.1021/bi00469a025
NOTES
*Corresponding authors.