American Journal of Industrial and Business Management
Vol.05 No.07(2015), Article ID:58472,10 pages
10.4236/ajibm.2015.57050
Demand Forecasting of Agricultural Products Logistics in Community
Guangshu Xu, Shangjun Piao, Zilong Song
Beijing Wuzi University, Beijing, China
Email: guangshuxu@126.com, shangjunok@126.com, 337653076@qq.com
Copyright © 2015 by authors and Scientific Research Publishing Inc.
This work is licensed under the Creative Commons Attribution International License (CC BY).
http://creativecommons.org/licenses/by/4.0/


Received 8 July 2015; accepted 27 July 2015; published 30 July 2015
ABSTRACT
This paper discusses the characteristics of the community agricultural products logistics and the difficulty of the demand forecasting of agricultural products logistics in community. Obtaining the data over the years relates to agricultural products logistics in community through question- naires. Then using Grey prediction model conduct the demand forecasting of agricultural products logistics in community. The study of this paper can provide reference data for the agricultural outlets near the community in Beijing, solve the problem of matching supply and demand of community shops, satisfy consumer’s demand and maximize the benefits of operators. The study of this paper can provide reference data for the agricultural outlets near the community in Beijing, solving the matching supply and demand problems of community shops, satisfying consumer’s demand and maximizing the benefits of operators. Besides, it can also provide some references meaning for e-commerce companies of Beijing, such as the location of community convenient store in O2O e-commerce model, the solution of “The last mile” and so on.
Keywords:
Demand Forecasting of Logistics, Agricultural Products in Community, Grey Prediction Model

1. Introduction
In recent years, there have been some new marketing models of agricultural products under the funding and policy support of Chinese government. Originally, only wholesale markets for agricultural products and farmers markets preserve their dominant position in China’s circulation pattern. Then the “farm to market”, “farm to community”, community store for agricultural products and other circulation patterns are emerging. Also with the development of mobile Internet, competition based on between e-commerce business enterprises B2C, O2O peer mode is getting fierce. These types of new agricultural products marketing models are more or less inseparable from the demand forecasting of agricultural products logistics in community. The accuracy of the demand forecasting of agricultural products logistics in community is beneficial for companies to take advantage of the customer’s actual demand. Also, it can effectively match supply and demand for agricultural products, forecast for the customer demand for start-up companies or growing companies to reduce the uncertainty of demand and improve the speed of supply chain responsiveness in advance.
The author searched for related articles by China National Knowledge Infrastructure (CNKI), and found that there are few studies about the demand forecasting of agricultural products logistics in community so far. Such as, Cheng Guanxiong [1] discussed the development problems about the current situation of agricultural products logistics and demand forecasting of the agricultural products logistics. Fan Ronghua [2] rendered some coping strategies, according to the demand forecasting of agricultural products logistics of the center of Nanyang city, but the historical data, agricultural products consumption and traffic etc. were estimated in the literature, and was short of substantive basis. In recent years Hui Chunmei, Li Yanfeng [3] and others combined with the data of import and export trade of special agricultural products in Yunnan city, discussed the forecasting of their agricultural products exports over the next few years. He Liu [4] indirect forecasted the logistics demand of Huishan Agricultural products Logistics Industrial Park by around four provinces. Wang Xinli [5] studied the demand of agricultural products logistics, and predicted the total amount of logistics by some relevant indexes of the agricultural products in recent years in China. Liqing Fang [6] analyzed the factors of affecting the demand of agricultural products logistics by multiple linear regression and principal component analysis. Then it summed up the key factors of affecting the lump sum of demand of agricultural products logistics. But these papers just predicted quantity demand of agricultural products logistics or total cost of agricultural products logistics. But these researches are too macroscopic, and they considered more from the perspective of the government rather than the company. Consequently, these are not conducive to study the demand forecasting of agricultural products logistics in community which belong to urban distribution.
Scholars have not yet really explored the demand forecasting of the agricultural products logistics in community. This paper chose some community as the research objective In order to predict the demand of agricultural products logistics in community, some survey of community residents are conducted to better understand the purchasing habits of agricultural products of community residents. And also field research is conducted in supermarket, fruit and vegetable shop near the community. Finally, integrating the data of nearly years by using grey model predicts the demand of agricultural products logistics of community for the next several years. This study can provide some reference data for the agricultural products community outlets, solve the problem of matching supply and demand of community store to meet consumers' demand, enable operators to maximize the benefits. Also it can be conducive to choose site for community stores in O2O e-commerce and to solve the problem of end of the distribution in logistics and other issues with reference significance.
2. Definition of the Demand of Agricultural Products Logistics
2.1. Notion of the Demand of Agricultural Products Logistics
Many experts and scholars described the notion of the demand of agricultural products logistics from the aspects of modern logistics, economics and so on. But they still could not come to a satisfactory conclusion for personage of all circles [4] . Wang Xinli thought the demand of agricultural products logistics could be defined as follows: the demand of agricultural products logistics is the space, time and costs requirements in a certain period of time, caused by social and economic activities, and produced by agricultural configuration in areas of produce, circulation and consumption.
In fact, the demand of logistics is the demand of logistics service. So it can be separated on the basis of service content. The demand of agricultural products logistics should include transportation, warehousing, packaging, handling, distribution processing, distribution, information service and so on.
2.2. Demand of Agricultural Products Logistics in Community
As a result of dramatic development of China economy and the accelerating process of urbanization, city’s community phenomenon has become increasingly prominent [7] .
With the various strong demands of agricultural products in community, the needs of agricultural products logistics of community residents are increasing. In order to differentiate between agricultural products logistics in community and agricultural products logistics in its broad sense, this paper researched the demand of Agricultural products in community from the perspective of urban logistics. Because urban distribution belongs to the end of the logistics activities, from the perspective of urban logistics, there is no clear distinction between the demand of urban logistics and urban distribution [8] . Agricultural products logistics in community belongs to the urban logistics. Similarly, the demand of agricultural logistics in community is also the demand of distribution of the end of logistics. Therefore, from the perspective of quantity demand of distribution of agricultural products logistics in community, the quantity demand of agricultural products of community residents is chosen as the research object to be explored in this paper.
2.3. Characteristics of the Demand of Agricultural Products Logistics in Community
The demand of agricultural products logistics in community not only have the demand of agricultural products logistics, but also have the characteristics of the demand of distribution of the end of urban logistics. In addition, the demand of agricultural products logistics in community also has different characteristics.
(1) Equilibrium of the demand of agricultural products logistics in community. Since there is not much change of the population of each community and the consumer demand for agricultural commodities and logistics in a short time, we can see that the agricultural logistics needs of the community substantially keep balance in the community in the same area.
(2) The demand of agricultural products logistics in community is both complex and simple. Because there is a wide range of agricultural product logistics, and a wide variety of agricultural products. So the demand of agricultural products logistics is very complicated. However, because of the equilibrium of the demand of agricultural products logistics in community and the main demand in the same fixed community, the demand of agricultural products logistics in community to become relatively simple.
3. Obstacle of Demand Forecasting of Agricultural Products Logistics in Community
The difficulty of the demand of agricultural products logistics in community lies in the accuracy of the prediction and investigation. This paper bases on the historical demand of agricultural products, use the grey prediction model to predict the agricultural demand of community in the coming years. Consequently, the community’s historical demand quantity of agricultural products has become the key to research.
The historical data of the demand quantity of agricultural products has not yet been provided by official statistics, and it is needed to investigate by researchers. And then the valid data is available to be obtained with consumers and businesses providing the relevant information. But the quantities of purchasing agricultural products, the channels to purchase agricultural products vary from each other, and the sales of agricultural products of business included the quantities of purchasing agricultural products of non-designated community residents, which leads to some statistical problems of historical data of demand for agricultural products. Two problems ininvestigation summarized by authors as follows.
3.1. Obstacles of Investigable Consumers
The majority of residents are unaware of their historical consumption data of agricultural products in the last few years, so researchers can’t just obtain the demand data of agricultural community residents by consumers. It requires comprehensive investigation by researchers in the markets, fruit and vegetable stores, supermarkets and other businesses near the community in order to obtain the most real agricultural community demand, and the most accurate information. Because the ages, professional nature, individual purchase habits and personal income and other factors are different, so there is a big difference of purchasing quantities and purchasing places of community residents agricultural products. So it will be needed to do the survey in the community to get purchasing places of residents of agricultural products, then by the investigation of the agricultural products sales proportion in each specified agricultural community store, the purchasing quantities of community residents can be obtained.
3.2. Obstacles of Investigable Business
After obtaining the purchasing places of community resident agricultural products, we find that there are some obstacles to get data from businesses. When most sellers of selling agricultural products are self-employed, because many self-employed sales branches are scattered and not stable, most self-employed are less educated, and they have little concept of statistical data, this may make it difficult for the researchers to get accurate sales date from the self-employed. If you want to get more efficient, true and accurate information, you can investigate the supermarkets nearby community. Supermarkets usually have a certain amount of historical sales data of agricultural products. However, in this process, whether businesses are willing to provide real data or not will become an obstacle for accurate prediction. So the effective communication of supermarket manager or supermarket produce suppliers will become a key problem. The larger the number of supermarkets, fruit and vegetable shop nearby communities, the more difficult it will becomes to do some investigation, and the accuracy is lower.
4. Construction and Testing of Grey Prediction Model GM(1.1)
The grey system theory was proposed by Deng in 1980s. The investigated object of the grey system theory is a uncertain system with small sample and poor information of partial known information and partial unknown information [9] . This grey system just can be applied to demand forecasting of agricultural products that have “poor information”. This paper use GM(1.1) model to forecast the demand of agricultural products.
When grey forecasting model is established, there are three basic operations: accumulated generating operator (AGO), inverse accumulated generating operator (IAGO) and grey model (GM). GM(1,1), i.e. the first order GM with one variable. Hereinto, AGO is a notable feature of the grey theory, and its main aim is to decrease data randomness. Assume that  is the original non-negative data series taken in consecutive order and at equal time interval [10] .
4.1. Construction GM(1.1) [9]
The procedure of GM(1,1) model is shown as follows:
A new data series X(1) is generated by AGO. where:
 , (1)
, (1)
 is called (1-AGO) (2)
 is 1-AGO series of
 ,
,  is neighbor mean generating sequence of
 (3)
(3)
 (4)
(4)
 (5) is called basic form of GM(1.1). If
  is parameter list. And
 (5)
(5)
When parameter list satisfy
 (6)
(6)
Then  is called albino equation of GM(1.1), also known as shadow equation. The time re-
sponse sequence of GM(1.1) is
 (7)
(7)
Do regressive reduction value  is the model simulation value. Hereinto,
 (8)
(8)
4.2. GM(1.1) Model Testing
GM(1.1) model commonly used residual test. Assume that  is the prediction model simulate sequence of
 .
.
Residual series. where:

The relative error sequence. where:

For , The relative error is
 ,
,  is the mean relative error (MRE). Given a
 ,
,
 is a relative error. The value shown in Table 4 If
 , and
, and , the model is called residual qualified model.
4.3. The Scope of the GM(1.1) Predictions [9]
The Parameter “−α” is a development quotient (DQ) in GM(1.1). That react development trend of  and
and . In modeling, take different data to establish GM(1.1) model, the value of the parameter is not the same, with its different values, the scope and effectiveness of prediction is different.
(1) When , GM(1.1) can be used for mid-long term load forecasting.
(2) When , GM(1.1) can be used for short-term forecasting , long term prediction with caution.
(3) When , GM(1.1) can be used for short-term forecasting, but should be very cautious.
(4) When , It should use residual correct GM(1.1).
(5) When , It is not suitable for GM(1.1).
5. Data Source and Model Application
5.1. Sample Selection
Because of too many varieties of agricultural products, in order to facilitate to do data statics and research, in this paper, we selected vegetables and fruits as a sample. In order to obtain the annual data of the demand quantity of agricultural products in community, the author conducted field research through a community estates office, a community residents, supermarkets near the a community, fruit and vegetable shops and food markets near the a community in Beijing. A community has period one, two, three, the specific household and population are shown in Table 1.
From the questionnaire surveys of community residents, 24% of vegetables and 15% of fruits from the nearby supermarket chain located at the intersection of three communities, shown in Figure 1 and Figure 2.
Through investigation, we found that part of the population having the option habits to purchase agricultural product, and the historical data of chain supermarket is relative easily accessible than the fruit and vegetable stores. So this paper bases on historical fruit and vegetable sales data of chain supermarket, obtaining the consumption of fruits and vegetables in the community. Table 2 shows historical data of vegetables and fruits of supermarket sales.
In Table 2, Supermarket sales of fruits and vegetables contain a purchasing quantities amount of the unspecified community residents. So, in order to obtain more accurate data, this paper examines the proportion of

Table 1. Household and population of a community.
Source: community estates office.
Table 2. Chain supermarket’s sales of fruit and vegetable over the years.
Source: fruit and vegetable supplier of supermarket.

Figure 1. The proportion of buy the vegetables in the chain supermarket.

Figure 2. The proportion of buy the fruits in the chain supermarket.
community residents to buy agricultural products in the supermarket sales (as can be seen in Figure 3 and Figure 4)
According to the above survey data, we obtain that approximately 82% of the vegetables of chain supermarket is accounted for 24% of community vegetable consumption and approximately 74% of the fruits of chain supermarket is accounted for 15% of community fruit consumption. Community consumption data of fruits and vegetables over the years finally was obtained as shown in Table 3.
5.2. Demand Forecasting of Agricultural Products Logistics
5.2.1. Demand Forecasting of Vegetables
The original sequence . After calculation that,
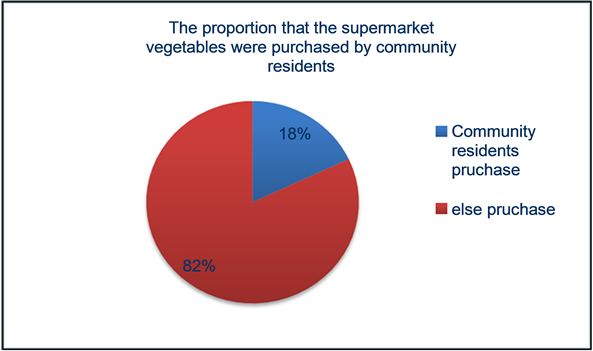
Figure 3. The proportion that the supermarket vegetables were purchased by community residents.

Figure 4. The proportion that the supermarket fruits were purchased by community residents.
Table 3. 2011-2014 community residents’ sales of fruits and vegetables.


 ,
,

Model’s DQ , GM(1.1) can be used for GM(1.1) model is mid-long term load forecasting. The corresponding


Residual series

The relative error sequence

 and;
and;
According to Table 4, the precision of model is level 1, fitting accuracy of model is relatively high. It can be used simulate and forecast. Then the predicted value is that:
2015 year: t = 4, 
2016 year: t = 5, 
2017 year: t = 6, 
2018 year: t = 7, 
5.2.2. Demand Forecasting of Fruits
The original sequence
 .
.
After calculation that,
 ,
,
Table 4. Accuracy test grade reference table.
 ,.
,.
Model’s DQ , GM(1.1) can be used for mid-long term load forecasting. The corresponding GM(1.1)
model is .
.

Residual series 
The relative error sequence 
 and
and . According to Table 4, the precision of model is level 1, fitting accuracy of model is relatively high. It can be used simulate and forecast. Then the predicted value is that:
2015 year: t = 4, 
2016 year: t = 5, 
2017 year: t = 6, 
2018 year: t = 7, 
By GM(1.1) Grey model, we can calculate predicted value of community demand for fruits and vegetables from 2015 to 2018, then we get the Integer and round to organize. As can be seen in Table 5 and Table 6.
Table 5. Prediction of demand for vegetables based on GM(1.1).
Table 6. Prediction of demand for fruits based on GM(1.1).
As the variation trend of demand for agricultural products in community from 2011 to 2018 shown in Figure 5.
In Figure 5, the changing trend of the demand for agricultural products, with the green column and orange column diagram to express the demand for vegetables and fruits. As shown in the figure, 2011-2014 demand for vegetables and fruits is the actual result of investigate A community. 2015-2018 demand for vegetables and fruits is the result of prediction based on GM(1.1).
In Figure 5, green and orange line graph shows the year-on-year growth rates of the vegetables and fruits demand. The results indicate that the year-on-year growth rates of the vegetables and fruits demand from 2012 to 2014 year are each 4.37153%, 3.14136%, 4.06102% and 5.47921%, 6.98075 % 7.43540% and are each 3.45637%, 3.61069%, 3.61060%, 3.61063% and 7.09860%, 7.21542%, 7.21529%, 7.21530% from 2012 to 2014 year. From the changing trend of demand and forecast results, a community residents in Beijing demand for fruits and vegetables increase every year. The main reason is that with China’s economic development, and social progress, people’s living standards continue to improve; people’s consumption of fruits and vegetables is also getting bigger and bigger. The reason why demand quantity has been increased in recent years is probably that more and more influx of foreign population increased community population. Through the same proportion growth rate of the vegetables and fruits demand, it can be seen that the growth rate of demand for fruits is significantly higher than the growth rate of demand for vegetables. The reasons that the growth rate of demand for fruits is greater than the growth rate of demand for vegetables is not only because people in growing numbers like to eat more fruit, but also because more and more people eat out of home resulting in eating fewer vegetables at home relatively.
6. Conclusions
Based on “less data modeling” grey system features and grey systems theory, according to the data of agricultural products logistics in community of previous years, we establish the grey system GM(1.1) model. Through residual test, we prove that the feasibility of grey system model can effectively combine with agricultural products logistics prediction in community. From the known data and predictions, we can see that the demand for fruits and vegetables of communities increases every year, but the growth has not been significantly fluctuated. It can be derived from the increased tendency of vegetables and fruits, and the growth rate of demand for fruit is significantly higher than the growth rate of demand for vegetables. This study cannot only provide the valuable reference for traditional store and new business enterprise to sell agricultural products, but also can effectively make contributions to solve community problems of matching supply and demand, reduce logistics costs, avoid unnecessary losses, and optimize transportation, environmental protection and other fields as well as macro-logistics system.

Figure 5. Variation trend of community agricultural products.
However, in this paper, the main method is quantitative analysis, and the qualitative analysis is less about the demand forecasting of agricultural products logistics in community. In order to improve the accuracy of prediction, a combination of qualitative methods and quantitative methods is needed. And it is the problem that will be further studied in this paper.
Cite this paper
GuangshuXu,ShangjunPiao,ZilongSong, (2015) Demand Forecasting of Agricultural Products Logistics in Community. American Journal of Industrial and Business Management,05,507-517. doi: 10.4236/ajibm.2015.57050
References
- 1. Cheng, G.X., Zhu, Y. and Yu, X.L. (2014) Study on Forecasting of Agricultural Produce Logistics Demand of Xinjiang Construction Corps. Logistics Technology, 23, 229-233. (In Chinese)
- 2. Fan, R.H. (2011) Discussion on Agricultural Product Logistics Dem and in Nanyang City Center Town. Journal of Anhui Agricultural Sciences, 39, 1224-1225. (In Chinese)
- 3. Hui, C.M., Li, Y.F., Cao, J., Cai, Y.Y. and Zhu, D.P. (2011) Forecasting and Analysis of Yunnan Specialty Farm Produce Logistics Demand. Logistics Technology, 3, 79-81. (In Chinese)
- 4. He, L. (2007) The Research on Prediction Method of Huishan Agricultural Products Logistics Park Demands Based on Grey Forecast GM(1.1). Northeastern University.
- 5. Wang, X.L. and Zhao, K. (2010) Research on the Demand of Agricultural Products Logistics Based on Neural Network. Journal of Agricultural Economics, 2, 62-68. (In Chinese)
- 6. Li, Q.F. (2011) Study on the Influence Factors of the Demand of Agricultural Products Logistics. China Business & Trade, 20, 116-117. (In Chinese)
- 7. Huang, F.J.H. (2013) Brief Analysis on the Distribution Problems of Community Agricultural Products under the Background of Urbanization. Journal of Shanxi Agricultural Sciences, 41, 1010-1012. (In Chinese)
- 8. Wang, X.X. (2011) Urban Logistics Distribution Management. Tsinghua University Press, Beijing.
- 9. Yan, G.L., Zhang, N. and Liu, Y.H. (2012) Systems Engineering. China Machine Press, Beijing.
- 10. Wang, Q.P., Wang, T.P. and Zhang, K. (2012) Image Edge Detection Based on the Grey Prediction Model and Discrete Wavelet Transform. Kybernetes, 41, 643-654.
http://dx.doi.org/10.1108/03684921211243301