International Journal of Clinical Medicine
Vol.4 No.1(2013), Article ID:26873,9 pages DOI:10.4236/ijcm.2013.41004
Effect of Iron-Mediated Oxidative Stress on Insulin Resistance through the Forkhead Box-Containing Protein O Subfamily-1 (FOXO-1) Pathway in Chronic Hepatitis C*
![]()
1Center for Physical and Mental Health, Mie University Graduate School of Medicine, Tsu, Japan; 2Department of Gastroenterology and Hepatology, Mie University Graduate school of Medicine, Tsu, Japan.
Email: #yoshinao@hac.mie-u.ac.jp
Received November 6th, 2012; revised December 12th, 2012; accepted January 25th, 2013
Keywords: Chronic Hepatitis C; Gluconeogenesis; Insulin Resistance; Iron Metabolism; Oxidative Stress
ABSTRACT
Aims: Chronic hepatitis C virus (HCV) infection is often associated with glucose metabolic disorders and iron overload. It has recently been shown that reactive oxygen species (ROS) increase gluconeogenesis in hepatocytes through the forkhead box-containing protein O subfamily-1 (FOXO1)-dependent pathway. The aim of this study is proving a causeand-effect relationship between iron-mediated ROS production and insulin resistance (IR) in chronic hepatitis C (CH-C) patients. Methods: The study included 42 patients with CH-C (22 males and 20 females, median age 53 years). Homeostasis model assessment of insulin resistance (HOMA-IR) value was assessed for each patient at entry. Gene expression levels in the biopsied liver tissues were determined by quantitative reverse transcription-polymerase chain reaction (RTPCR). In addition, the effect of ROS on gluconeogenesis was assessed using HepG2 cells treated with a well-known ROS generator, diethylmaleate (DEM). Results: The serum ferritin levels were significantly correlated with the serum aspartate aminotransferase level, alanine aminotransferase level, HOMA-IR value, grade of fatty accumulation, total hepatic iron score, and 8-OH-deoxy-2’-guanosine (8-OHdG)-positive cell count. FOXO1 expression was correlated with 8-OHdG-positive cell count, phosphoenolpyruvate carboxykinase (PEPCK) expression, and HOMA-IR. In HepG2 cells, the gene transcription of FOXO1 and PEPCK was increased by DEM treatment, which was associated with an increase in non-phosphorylated FOXO1 protein in the nuclear fraction. Conclusions: Iron-mediated ROS production enhances gluconeogenesis through the FOXO1-mediated pathway and is an affecting factor to IR in patients with CH-C.
1. Introduction
More than 170 million people suffer from chronic heaptitis C virus (HCV) infection worldwide [1]. Chronic HCV infection may eventually lead to the development of cirrhosis and hepatocellular carcinoma [2]. Insulin resistance (IR) and diabetes are common complications of patients with chronic hepatitis C (CH-C) [3]. HCVrelated glucose dysmetabolism significantly affects the clinical course and prognosis in CH-C patients and is associated with accelerated fibrogenesis [4], increased incidence of hepatocellular carcinoma [5]. Sustained viral response to anti-viral therapy results in the amelioration of IR and decreased incidence of T2DM after the end of therapy [6,7], indicating that an association exists between HCV infection and glucose metabolic disorders.
The mechanisms of HCV-related diabetes have been well documented. Kasai et al. reported that HCV replication suppresses cellular glucose uptake through downregulation of glucose transporter 2 (GLUT2) on the hepatocyte cell surface [8]. In addition, this group recently reported that non-structural protein 5A (NS5A) of HCV enhances cellular glucose production in hepatocytes through the forkhead box-containing protein O subfamily-1 (FOXO1)-dependent pathway [9]. It is well known that increased hepatic glucose production through gluconeogenesis is a major feature of IR [10]. Transcriptional regulation of phosphoenolpyruvate carboxykinase (PEPCK) and glucose 6-phosphatase (G6Pase) genes plays a key role in gluconeogenesis.
Hepatic iron overload is another common manifestation in CH-C patients [11]. The reduced form of iron (Fe2+) enhances the formation of highly toxic hydroxyl radicals by the Fenton reaction. In turn, iron-mediated reactive oxygen species (ROS) formation can leads to progressive liver fibrosis [12] and increase the risk of developing hepatocellular carcinoma [13]. ROS oxidize numerous cellular components such as nucleic acids, proteins and lipids. 8-hydroxy-2’-deoxyguanosine (8-OHdG) is a representative indicator of oxidative DNA damage [14], and it has been was shown to correlate with iron overload in CH-C patients [15].
In the present study, we hypothesized that iron-mediated ROS, as well as HCV proteins, can affect gluconeogenesis in the liver of CH-C patients. According to this hypothesis, a cause-and-effect relationship between iron overload and IR in CH-C patients was investigated.
2. Materials and Methods
2.1. Patients with Chronic Hepatitis C
The present study comprised 42 patients with CH-C (22 males and 20 females, with a median age of 53 years) who admitted to Mie University Hospital (Mie, Japan) between April 2007 and December 2010 (Table 1). All patients were seropositive for both anti-HCV antibody and HCV-RNA (Real Time-HCV assay; Roche Molecular Diagnostics, Tokyo, Japan), and were seronegative for HB surface antigen/antibody and anti-human immunodeficiency virus antibody. Patients with other liver diseases (drug-induced, autoimmune, metabolic) were excluded by serological tests and anamnesis. All patients had no HFE mutations C282Y or H63D. None of the patients received any antiviral or immunomodulatory treatment within 6 months prior to the study.
Patients with liver cirrhosis (fibrosis stage 4) were excluded from this study. Patients with chronic alcohol consumption in excess of 40 g/week for men and 20 g/week for women for at last 5 years were excluded. In addition, patients received any drugs for controlling their blood sugar levels and/or underwent insulin therapy were excluded.
Table 1. Baseline characteristics of chronic hepatitis C patients.
ALT, alanine aminotransferase; AST, aspartate aminotransferase γ-GTP, gamma glutamyltranspeptidase; HCV, hepatitis C virus; HOMA-IR, homeostasis model assessment of insulin resistance; WBC, white blood cell.
Hematological, serum biochemical, and iron-related markers in blood were analyzed for each patient at entry. The homeostasis model assessment of insulin resistance (HOMA-IR) was calculated as (fasting glucose in mg/dl × fasting insulin in μU/ml)/405. We choose a cut-off value of 2.0 for HOMA-IR. This value has been used in CH-C to predict poor response to anti-viral therapy [16, 17]. Serum transferrin saturation was calculated as (serum iron/total iron binding capacity) × 100 and expressed as a percentage. Body mass index (BMI) over 25.0 was categorized as obesity in accordance with the guidelines proposed by the Examination Committee of Japan Society for the Study of Obesity [18], which is adjusted to adult Asian population.
Liver tissue was obtained by percutaneous needle biopsy in all patients for diagnostic purposes. One portion was fixed in buffered formalin and embedded in paraffin, and the other part was immediately frozen and stored in −80˚C for RNA analysis.
Informed consent was obtained from each patient and the study was approved by the Ethical Committee of Mie University. The study was carried out according to the ethical guidelines of the 1975 Declaration of Helsinki.
2.2. Histological Evaluation
Tissue slides embedded in paraffin were stained with hematoxylin-eosin, Masson’s trichrome, and Perl’s Prussian blue. The degree of necro-inflammatory activity and the stage of fibrosis were evaluated based on the criteria of Desmet et al. [19]. The degree of fatty accumulation was graded according to into 4 categories (grade 1; 0%, grade 2; 1% - 9%, grade 3; 10% - 29% and grade 4; ≥ 30%). The histological assessment of hepatic iron was performed using the total iron score (TIS) as reported by Deugnier et al. [20]. This score has been shown to highly correlate with hepatic iron concentration as measured by atomic absorption spectrophotometry in patients with chronic liver diseases [21]. The assessment of liver histology was done by 2 independent pathologists without knowledge of the patients’ backgrounds and clinical conditions. Hepatic immunohistochemical staining of 8-OHdG was performed and the 8-OHdG-positive hepatocyte was quantified as previously reported [13].
2.3. Determination of Messenger RNA (mRNA) Levels in Liver Biopsy Samples
Total RNA was isolated from liver tissues using Sepazol® RNA II Super (Nacalai Tesque, Tokyo, Japan) according to the manufacturer’s protocol and subjected to DNase I digestion (Takara Bio, Otsu, Japan) to eliminate contaminating genomic DNA. First-strand cDNA was synthesized from 5 µg-adjusted total RNA with SuperScript VILO Master Mix (Life Technologies, formerly Applied Biosystems, Foster City, CA). Quantitative TaqMan® PCR was performed with universal TaqMan® Gene Expression Master Mix and commercial inventoried primers (TaqMan® Gene Expression Assay, Life Technologies) for the genes PEPCK (Hs00159918_m1), G6Pase (Hs00609178_m1), FOXO1 (Hs01054576_m1), JNK (Hs- 00177083_m1), and glyceraldehydes 3-phosphate dehydrogenases (GAPDH) (FAM-MGB 4352934-1010033). Each TaqMan® reaction contained 4 µl of cDNA, derived from 100 ng of total RNA, in a total volume of 20 µl. The quantitative PCR was performed in duplicate using a 7300 Real Time PCR System (Applied Biosystems-Life Technologies). The results were normalized for GAPDH.
2.4. Cell Cultures
HepG2 cells were cultured at 37˚C in a 5% CO2 atmosphere in RPMI1640 medium (Gibco-Life Technologies) supplemented with 10% fetal calf serum (Gibco), penicillin (50 IU/ml), and streptomycin (50 μg/ml). Diethylmaleate (DEM), a well-known ROS inducer, was then added to the medium to generate oxidative stress, as described previously [19]. After being cultured for 2 hours, total cellular RNA was isolated and subcellular protein samples from the cytoplasmic, membrane, and nuclear fractions were extracted separately using a ProteoExtract Subcellular Proteome Extraction Kit (EMD Chemical Inc., Darmstadt, Germany) according to the manufacturer’s instructions. Protein concentration was determined using the Bio-Rad Protein assay (Bio-Rad Laboratories, Inc., Hercules, CA, USA) and a BioSpec-mini analyzer (Shimadzu, Kyoto, Japan).
2.5. Western Blotting
Protein samples (10 - 20 µg) were separated by 7.5% or 10.0% sodium dodecyl sulfate-polyacrylamide gel electrophoresis (SDS-PAGE). The proteins were then transferred to a polyvinylidene difluoride (PVDF) membrane and blocked with 5% dry non-fat milk or 1% bovine serum albumin (BSA) in TBST buffer (Tris-buffered saline containing 0.1% Tween 20, pH 7.4) at room temperature for 1 hour. The membrane was then incubated overnight at 4˚C with primary antibody in TBST, followed by incubation with an alkaline phosphatase-conjugated secondary antibody. The primary antibodies used were antiFOXO-1 (dilution 1:1000; Cell Signaling Technology Inc., Danvers, MA, USA), anti-phospho JNK (dilution 1:800; R&D Systems Inc., Minneapolis, MN, USA). Thereafter, chemiluminescence was performed using an Immune-Star chemiluminescent protein detection system (Bio-Rad Laboratories), and immunoreactive bands were detected and the signal intensities quantified using a Lumino-image analyzer (LAS-4000 mini EPUV, Fuji Film, Tokyo, Japan).
2.6. Statistical Analysis
Clinical parameters were expressed as median with ranges. The expression level of gene or protein in cultured cells was expressed as mean ± standard deviation (SD). Comparisons between groups were made using the MannWhitney U test, paired or unpaired t test, or oneway ANOVA. Correlation coefficients between numerical variables were calculated using Spearman’s rho corrected for ties or Pearson’s test. All tests were 2-tailed, and p values less than 0.05 were considered statistically significant. Statistical analysis was performed using commercially available software (Multivariable Analysis Ver. 2.0 for Mac, Esumi Co. Ltd., Tokyo, Japan).
3. Results
3.1. Clinical and Histological Characteristics of Patients with CH-C
The baseline characteristics of the study group are shown in Table 1. Among the 42 cases, only 11 patients (26.2%) had body mass index (BMI) more than 25.0 Kg/m2, while 23 patients (54.8%) had elevated HOMA-IR values (> 2.0). Patients with elevated HOMA-IR values had significantly higher BMI (p < 0.05) and tended to have higher serum ferritin levels (p = 0.06). Patients with HOMA-IR values equal or more than 2.0 showed significantly lower SVR rate (56.5%) as compared with those with HOMA-IR less than 2.0 (68.4%; p < 0.05), which was consistent with the previous report [21]. Serum iron overload status was found in many CH-C patients: 13 patients (31.0%) had elevated serum iron values (>170 μg/dl for males and >120 μg/dl for females), 11 (26.2%) had elevated transferrin saturation (>45%), and 17 (40.5%) had elevated serum ferritin values (>220 ng/ml for males and >100 ng/ml for females). Fatty accumulation was found in the liver of 30 patients (71.4%). Moderate (10% - 30%) and severe (>30%) fatty accumulation was found in 10 (23.8%) patients and 1 (2.4%) patient, respectively.
HOMA-IR values were significantly correlated with BMI (r = 0.401, p < 0.05), HbA1c (r = 0.454, p < 0.05) and fasting plasma glucose (r = 0.495, p = 0.01).
3.2. Correlations of Serum Ferritin Level with Clinical Characteristics, Liver Histology, and Hepatic Gene Expression Levels
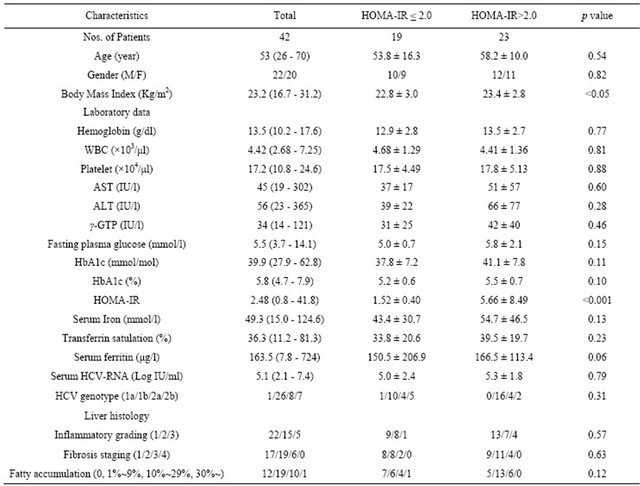
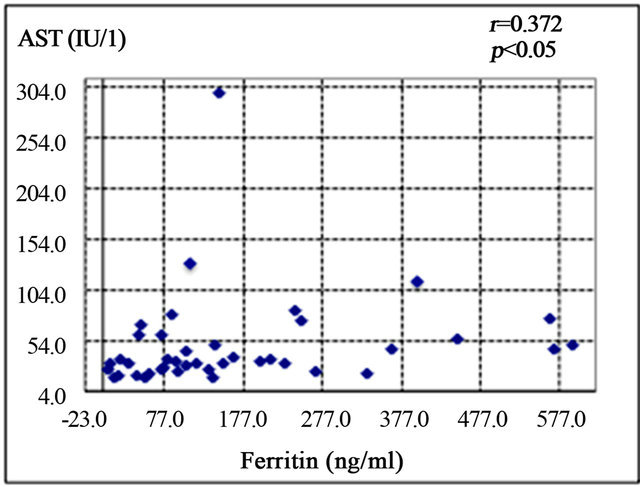
Serum ferritin was significantly correlated with serum aspartate aminotransferase level (AST; r = 0.372, p < 0.05) (Figure 1(a)), alanine aminotransferase (ALT; r = 0.439, p < 0.01) (Figure 1(b)), and HOMA-IR (r = 0.464, p < 0.05) (Figure 1(c)). Histological assessment of the biopsied liver tissues showed that serum ferritin levels were correlated with total hepatic iron scores (r = 0.646, p = 0.001) (Figure 1(d)) and 8-OHdG-positive cell counts (r = 0.560, p = 0.001) (Figure 1(e)), which is consistent with our previous study [15]. Interestingly, the serum ferritin levels were significantly correlated with the grade of fatty accumulation (p < 0.05) (Figure 1(f)).
3.3. Correlation of FOXO1 Gene Expression with Hepatic Oxidative Stress, Gluconeogenesis Gene Expression Level, and Insulin Resistance
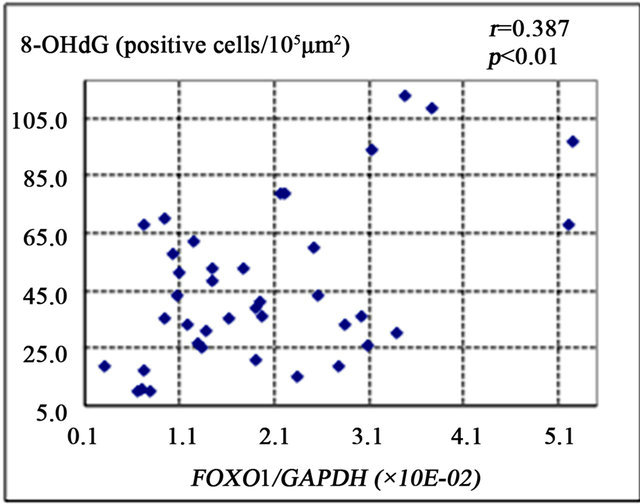
FOXO1 is known to enhance gluconeogenesis through transcriptional activation of various genes including PEPCK and G6Pase [9]. The present study showed that FOXO1 gene expression was significantly correlated with the number of 8-OHdG-positive cells (r = 0.387, p < 0.01) (Figure 2(a)), PEPCK gene expression (r = 0.421, p < 0.01) (Figure 2(b)), and HOMA-IR (r = 0.327, p = 0.01) (Figure 2(d)). There was a non-significant correlational trend between G6Pase and FOXO1 expression (r = 0.277, p = 0.08) (Figure 2(c)).
3.4. Effect of ROS on Gluconeogenesis Production in HepG2 Cells
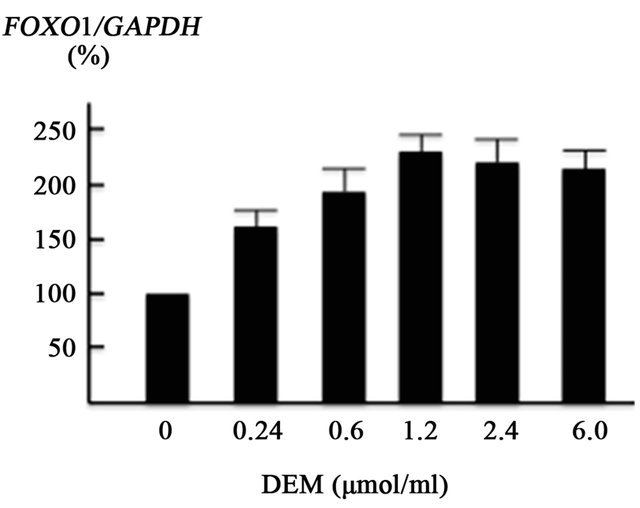
FOXO1 is regulated by the stress-sensitive serine/threonine kinase JNK at multiple levels [9,22]. We assessed the effect of ROS production on JNK, FOXO1 and PEPCK using cultured HepG2 cells. ROS were generated using DEM, well-known ROS inducer [23]. The present in vitro experiment showed that DEM (0.24 - 1.2 mM), a well-known ROS inducer, enhanced FOXO1 gene expression in a dose-dependent manner (Figure 3(a)). JNK gene expression was also increased by DEM treatment, but to a lesser extent than the induction of FOXO1 gene expression (Figure 3(b)).
In the presence of 1.2 mM DEM, PEPCK gene transcription was markedly increased by up to 738% of the baseline level (Figure 3(c)).
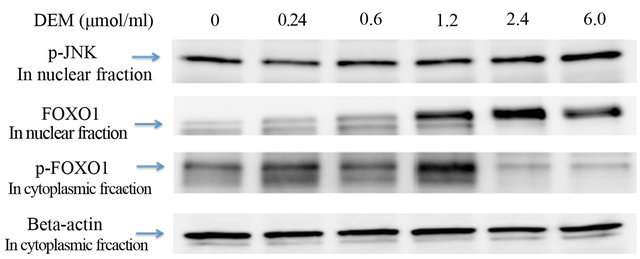
Western blotting revealed that the expression of phosphorylated JNK protein in the nuclear fraction was dosedependently increased (Figures 4(a), 4(b)) and that of non-phosphorylated FOXO1 protein in the nuclear fraction was strongly increased by DEM treatment (Figures 4(a), 4(c)). Conversely, expression of phosphorylated FOXO1 (p-FOXO1) in the cytoplasmic fraction was decreased when treated with DEM at high doses (2.4 to 6.0 mM) (Figure 4(a)).
 (a)
(a) (b)
(b)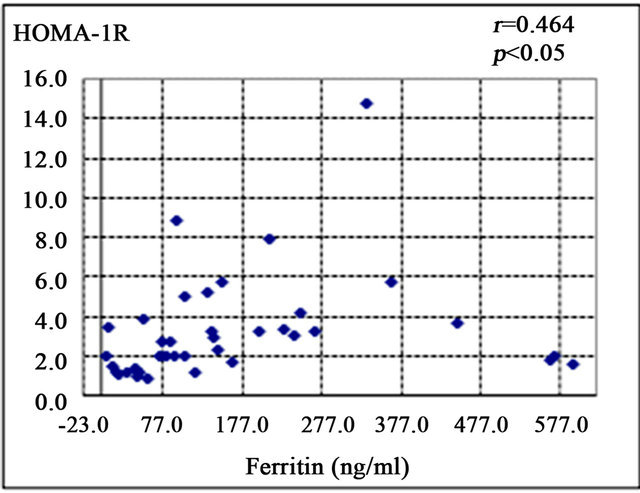 (c)
(c)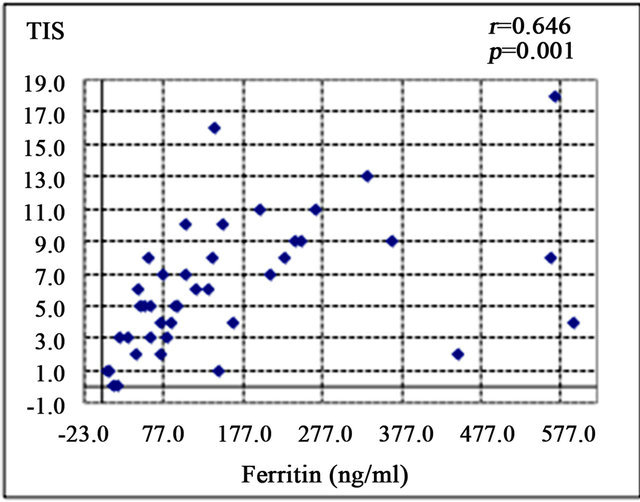 (d)
(d)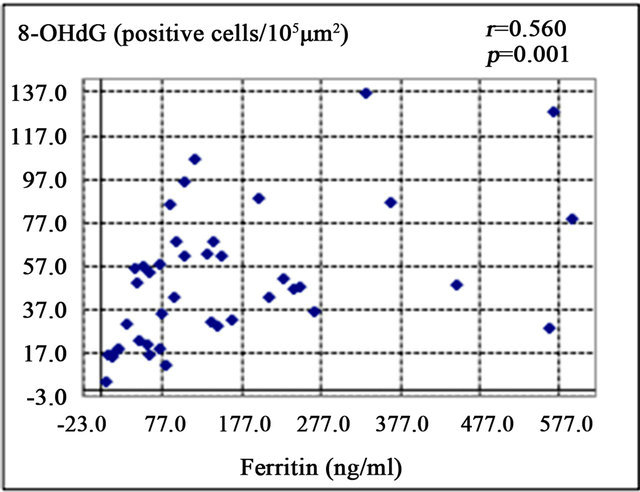 (e)
(e)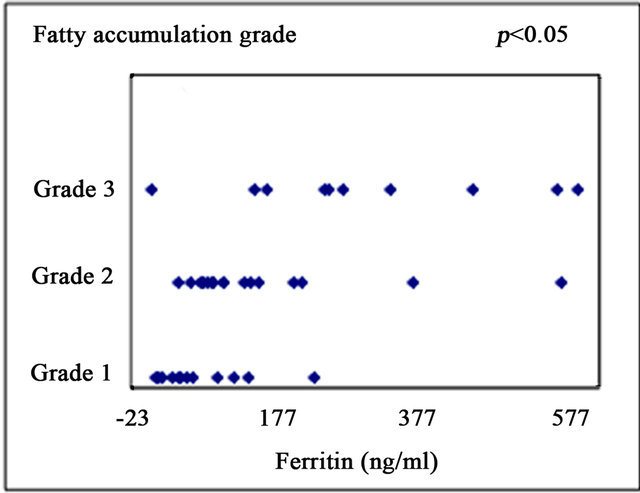 (f)
(f)
Figure 1. Correlation of serum ferritin level (ng/ml) with clinical characteristics and histological parameters of liver tissue. (a) Correlation between ferritin and aspartate aminotransferase (AST) level. (b) Ferritin and alanine aminotransferase (ALT) level. (c) Ferritin and homeostasis model assessment of insulin resistance (HOMA-IR). (d) Ferritin and Total iron score (TIS). (e) Ferritin and 8-hydroxy-2’-deoxyguanosine (8-OHdG) count. (f) Ferritin and fatty accumulation grade (analyzed using one-way ANOVA).
4. Discussion
The characteristics and complications of HCV are well documented, but the molecular mechanisms of HCVinduced IR are not yet fully understood. HOMA-IR is the most commonly used model for assessing IR in the HCV setting. Typically, a HOMA-IR value greater than 2 is used to signify significant IR [16]. The HOMA model has proved to be valuable in large epidemiological studies to assess IR in CH-C patients [24]. The prevalence of IR in HCV-infected patients has been reported to range from 30% to 70% [25,26]. The prevalence in the present study was 54.8% (23 of 42 cases), which is consistent with previous reports.
HCV core protein is known to play a key role in promoting IR. HCV core induces expression of tumor necrosis factor-α (TNF-α), which activates suppressor of cytokine signaling (SOCS), leading to subsequent
 (a)
(a)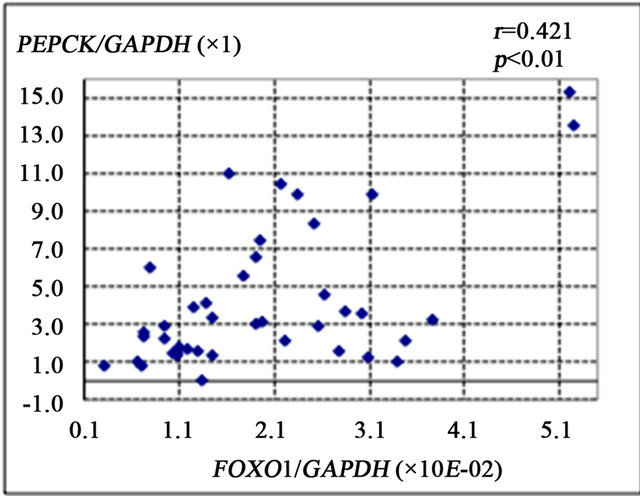 (b)
(b)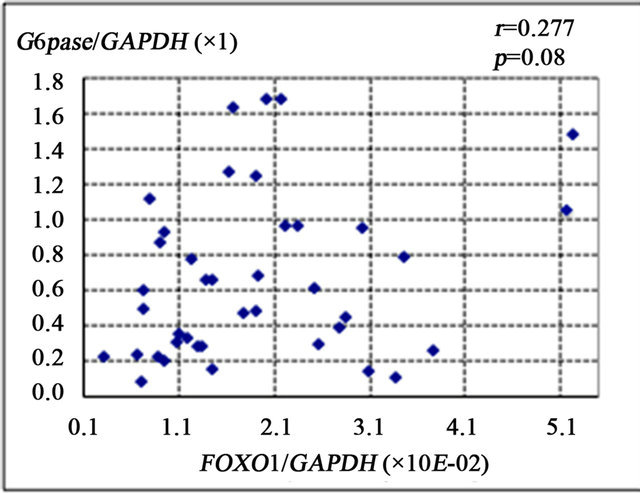 (c)
(c)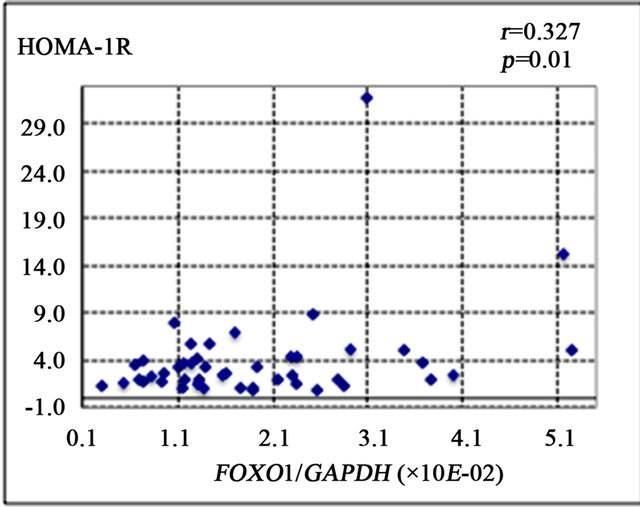 (d)
(d)
Figure 2. Correlation of gene expression levels of forkhead box-containing protein O subfamily-1 (FOXO1) with other parameters in the liver of 42 patients with chronic hepatitis C. (a) Correlation between FOXO1 and 8-hydroxy-2’-deoxyguanosine (8-OHdG) count. (b) FOXO1 and phosphoenolpyruvate carboxykinase (PEPCK). (c) FOXO1 and glucose 6-phosphatase (G-6-Pase). (d) FOXO1 and homeostasis model assessment of insulin resistance (HOMA-IR).
 (a)
(a)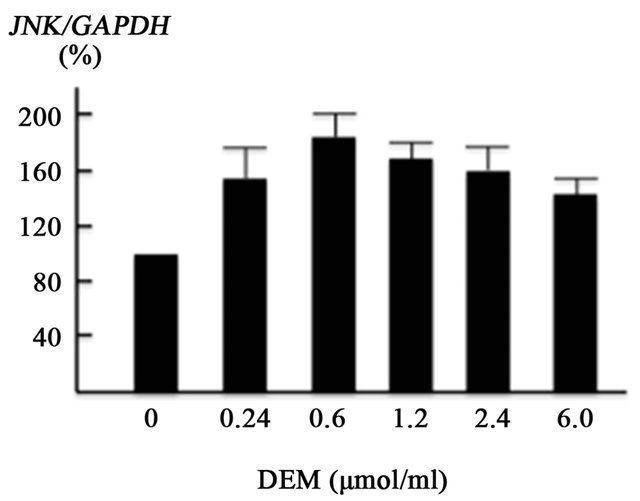 (b)
(b)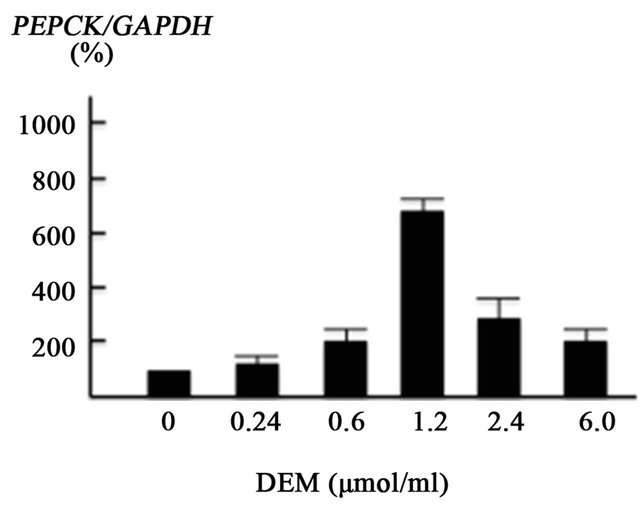 (c)
(c)
Figure 3. Effect of diethylmaleate (DEM) treatment on gene transcription in HepG2 cells. HepG2 cells were treated with 0, 0.24, 0.6, 1.2, 2.4, and 6.0 μmol/ml DEM for 2 hours. (a) The expression level of forkhead box-containing protein O subfamily-1 (FOXO1) gene in response to DEM stimulation. (b) The expression level of JNK gene. (c) The expression level of phosphoenolpyruvate carboxykinase (PEPCK) gene.
proteasomal degradation of insulin receptor substrates (IRS1 and IRS2), resulting in the development of IR. Furthermore, SOCS inactivates phosphatidyl-inositol-3- kinase (PI3K), which inhibits translocation of glucose transporter 4 (GLUT-4) to the cell membrane, resulting in blockade of glucose uptake [27]. As well as GLUT4, GLUT2 is down-regulated in HCV-replicating hepatocytes [8]. In addition, HCV-core protein enhances the serine phosphorylation of IRS-1, which leads to IRS-1 inactivation [28].
Hepatic iron overload in chronic HCV infection has
 (a)
(a)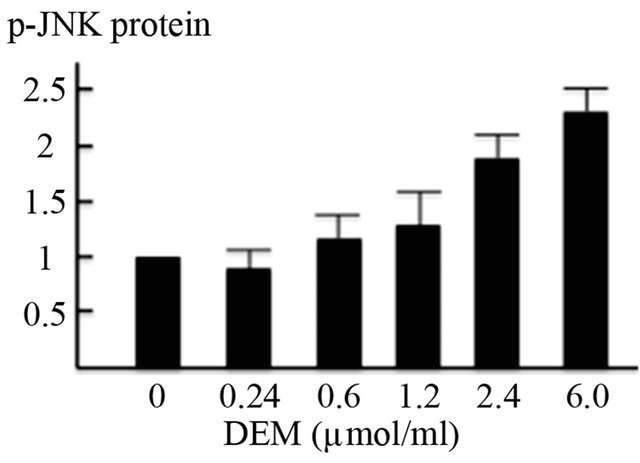 (b)
(b)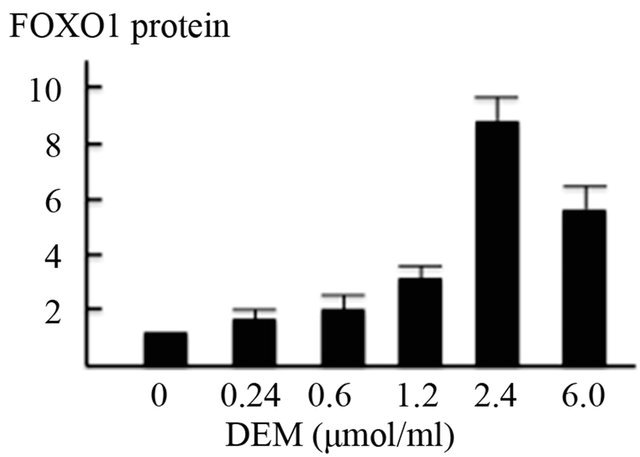 (c)
(c)
Figure 4. Activation of forkhead box-containing protein O subfamily-1 (FOXO1)—dependent proteins by diethylmaleate (DEM) treatment. HepG2 cells were treated with 0, 0.24, 0.6, 1.2, 2.4, and 6.0 μmol/ml DEM for 2 hours. (a) Western blotting of phosphorylated JNK (p-JNK) protein in the nuclear fraction, FOXO1 protein in the nuclear fraction, and phosphorylated FOXO1 (p-FOXO1) in the cytoplasmic fraction. (b) The expression level of p-JNK protein in the nuclear fraction. (c) The expression level of FOXO1 protein in the nuclear fraction.
been frequently reported. Several studies have demonstrated that an association exists between IR and iron overload [29]. However, the mechanisms through by which iron causes IR are not clear. In the present study, we hypothesized that iron accumulation in CH-C patients would be an important factor for ROS production. The study showed that the level of ferritin in serum was strongly correlated with the degree of hepatic iron accumulation and the number of cells positive for 8-OHdG. Chronic inflammation can contribute to elevate serum ferritin levels in setting of HCV infection. However, those results show that serum ferritin level is a reliable marker for quantifying ROS production even in CH-C. Moreover, the serum ferritin level was significantly correlated with HOMA-IR. This evidence supports the no tion that hepatic iron-mediated ROS production is associated with IR in CH-C.
Recently, an interesting molecular mechanism underlying HCV-induced glucose metabolic disorders was reported; namely, HCV NS5A protein was shown to enhance gluconeogenesis through activation of the transcription factor FOXO1 [9]. The present data showed that FOXO1 gene expression and the degree of hepatic iron overload were correlated with the number of 8- OHdG-positive cells. In addition, FOXO1 expression was significantly correlated with PEPCK expression and HOMA-IR. These data suggest that iron-mediated ROS production can enhance gluconeogenesis through activation of the FOXO1-mediated pathway, which can result in IR.
Interestingly, serum ferritin levels were correlated with the degrees of fatty accumulation in the liver tissues. The mechanism in HCV infection includes increased lipogenesis, decreased degradation and impaired lipoprotein secretion [30]. Mitochondrial damage by iron-mediated ROS production may affect the lipid metabolism [31].
In the present in vitro study, we used a cultured cell line, HepG2, treated with DEM. It is ideal to use HCVRNA replicon cells [32] treated with iron to investigate the effect of iron-mediated ROS production on the FOXO1-mediated pathway. We attempted to use HCVreplicon cells treated with Tf-bound iron (holo-Tf) in preliminary experiments; however, significant ROS induction was not observed (data not shown). These replicon cells were derived from the Huh7 cell line. Huh7 cells carry an HFE mutation (Y231 del), which is associated with human hemochromatosis [33]. As a conesquence of the significant problems associated with using HCV replicon to investigate iron-mediated processes, HepG2 cells treated with DEM were used as the model system in our study.
FOXO1 protein is known to distribute in both the nuclear and cytoplasmic fractions. Non-phosphorylated FOXO1 protein in the nucleus activates transcription of various gluconeogenesis genes [34]. Upon being phosphorylated, FOXO1 protein is exported from the nucleus to the cytosol, resulting in the loss of its transcriptional activity. The present in vitro model demonstrated that oxidative stress enhanced FOXO1 protein production and repressed phosphorylation of FOXO1, which was followed by enhanced gene transcription of PEPCK. The present in vivo and in vitro data led us to speculate that HCV-mediated iron overload enhances ROS production, which leads to an increase in gluconeogenesis through the FOXO1-mediated pathway and, ultimately, IR.
It should be noted that there are so many factors besides iron-mediated ROS production that affect IR. In HCV-infected hepatocytes, HCV core, NS3 and NS5A protein induce oxidative stress [13]. HCV leads to the over expression of the protein phosphatase 2A (PP2A) by induced endoplasmic reticulum (ER) stress [35]. PP2A inhibits insulin signaling through dephosphorylation of AKT [36]. Moreover, many other factors such as reduced glucose uptake via GLUT2 and GLUT4, inhibition of glycolytic pathways and reduction of insulin secretion from the pancreas, can affect IR. Therefore, oxidative stress by iron overload is one of the additional factors affecting IR in CH-C. Consequently, removal of hepatic iron will improve IR in CH-C, resulting in suppression of liver fibrosis and a reduced incidence of hepatocellular carcinoma development.
In summary, iron-mediated ROS production enhances gluconeogenesis through the FOXO1-mediate pathway and is a factor affecting IR in patients with CH-C.
6. Acknowledgements
We thank Ms. Mina Tenpaku and Ms. Rie Matsuo (Department of Gastoloenterology and Hepatology, Mie University Graduate school of Medicine) for technical assistance.
REFERENCES
- T. Poynard, M. F. Yuen, V. Ratziu and C. L. Lai, “Viral Hepatitis C,” Lancet, Vol. 362, No. 9401, 2003, pp. 2095- 2100. doi:10.1016/S0140-6736(03)15109-4
- K. E. Sherman, “Advanced Liver Disease: What Every Hepatitis C Virus Treater Should Know,” Topics in Antiviral Medicine, Vol. 19, No. 3, 2011, pp. 121-125.
- A. Lonardo, L. E. Adinolfi, S. Petta, A. Craxì and P. Loria, “Hepatitis C and Diabetes: The Inevitable Coincidence?” Expert Review of Anti-Infective Therapy, Vol. 7. No. 3, 2009, pp. 293-308. doi:10.1586/eri.09.3
- J. M. Hui, A. Sud, G. C. Farrell, P. Bandara, K. Byth, J. G. Kench, G. W. McCaughan and J. George, “Insulin Resistance Is Associated with Chronic Hepatitis C Virus Infection and Fibrosis Progression,” Gastroenterology, Vol. 125, No. 6, 2003, pp. 1695-1704. doi:10.1053/j.gastro.2003.08.032
- C. H. Hung, J. H. Wang, T. H. Hu, C. H. Chen, K. C. Chang, Y. H. Yen, Y. H. Kuo, M. C. Tsai, S. N. Lu and C. M. Lee, “Insulin Resistance Is Associated with Hepatocellular Carcinoma in Chronic Hepatitis C Infection,” World Journal of Gastroenterology, Vol. 16, No. 18, 2010, pp. 2265-2271. doi:10.3748/wjg.v16.i18.2265
- T. Kawaguchi, T. Ide, E. Taniguchi, E. Hirano, M. Itou, S. Sumie, Y. Nagao, C. Yanagimoto, S. Hanada, H. Koga and M. Sata, “Clearance of HCV Improves Insulin Resistance, Beta-Cell Function, and Hepatic Expression of Insulin Receptor Substrate 1 and 2,” American Journal of Gastroenterology, Vol. 102, No. 3, 2007, pp. 570-576. doi:10.1111/j.1572-0241.2006.01038.x
- M. Romero-Gómez, C. M. Fernández-Rodríguez, R. J. Andrade, M. Diago, S. Alonso, R. Planas, R. Solá, J. A. Pons, J. Salmerón, R. Barcena, R. Perez, I. Carmona and S. Durán, “Effect of Sustained Virological Response to Treatment on the Incidence of Abnormal Glucose Values in Chronic Hepatitis C,” Journal of Hepatology, Vol. 48, No. 5, 2008, pp. 721-727. doi:10.1016/j.jhep.2007.11.022
- D. Kasai, T. Adachi, L. Deng, M. Nagano-Fujii, K. Sada, M. Ikeda, N. Kato, Y. H. Ide, I. Shoji and H. Hotta, “HCV Replication Suppresses Cellular Glucose Uptake Through Down-Regulation of Cell Surface Expression of Glucose Transporters,” Journal of Hepatology, Vol. 20, No. 5, 2009, pp. 883-894. doi:10.1016/j.jhep.2008.12.029
- L. Deng, I. Shoji, W. Ogawa, S. Kaneda, T. Soga, D. P. Jiang, Y. H. Ide and H. Hotta, “Hepatitis C Virus Infection Promotes Hepatic Gluconeogenesis through an NS5AMediated, FOXO1-Dependent Pathway,” Journal of Virology, Vol. 85, No. 17, 2011, pp. 8556-8568. doi:10.1128/JVI.00146-11
- J. N. Clore, J. Stillman and H. Sugerman, “Glucose-6- Phosphatase Flux in vitro Is Increased in Type 2 Diabetes,” Diabetes, Vol. 49, No. 6, 2000, pp. 69-74. doi:10.2337/diabetes.49.6.969
- H. L. Bonkovsky, B. F. Banner and A. L. Rothman, “Iron and Chronic Viral Hepatitis,” Hepatology, Vol. 25, No. 3, 1997, pp. 759-768. doi:10.1002/hep.510250345
- A. L. Martinelli, L. N. Ramalho and S. Zucoloto “Hepatic Stellate Cells in Hepatitis C Patients: Relationship with Liver Iron Deposits and Severity of Liver Disease,” Journal of Gastroenterology and Hepatology, Vol. 19, No. 1, 2004, pp. 91-98. doi:10.1111/j.1440-1746.2004.03255.x
- H. Tanaka, N. Fujita, R. Sugimoto, N. Urawa, S. Horiike, Y. Kobayashi, M. Iwasa, N. Ma, S. Kawanishi, S. Watanabe, M. Kaito and Y. Takei, “Hepatic Oxidative DNA Damage Is Associated with Increased Risk for Hepatocellular Carcinoma in Chronic Hepatitis C,” British Journal of Cancer, Vol. 98, No. 3, 2008, pp. 580-586. doi:10.1038/sj.bjc.6604204
- H. Kasai and S. Nishimura, “Hydroxylation of the C-8 Position of Deoxyguanosine by Reducing Agents in the Presence of Oxygen,” Nucleic Acids Symposium Series, Vol. 12, No. 4, 1983, pp. 165-167.
- N. Fujita, S. Horiike, R. Sugimoto, H. Tanaka, M. Iwasa, Y. Kobayashi, K. Hasegawa, N. Ma, S. Kawanishi, Y. Adachi and M. Kaito, “Hepatic Oxidative DNA Damage Correlates with Iron Overload in Chronic Hepatitis C Patients,” Free Radical Biology & Medicine, Vol. 4, No. 3, 2007, pp. 353-362. doi:10.1016/j.freeradbiomed.2006.11.001
- M. Romero-Gómez, M. Del Mar Viloria, R. J. Andrade, J. Salmerón, M. Diago, C. M. Fernández-Rodríguez, R. Corpas, M. Cruz, L. Grande, L. Vázquez, P. Muñoz-DeRueda, P. López-Serrano, A. Gila, M. L. Gutiérrez, C. Pérez, A. Ruiz-Extremera, E. Suárez and J. Castillo “Insulin Resistance Impairs Sustained Response Rate to Peginterferon Plus Ribavirin in Chronic Hepatitis C Patients,” Gastroenterology, Vol. 128, No. 3, 2005, pp. 636- 641. doi:10.1053/j.gastro.2004.12.049
- M. Eslam, R. Aparcero, T. Kawaguchi, J. A. Del Campo, M. Sata, M. A. Khattab and M. Romero-Gomez, “MetaAnalysis: Insulin Resistance and Sustained Virological Response in Hepatitis C,” Alimentary Pharmacology & Therapeutics, Vol. 34, No. 3, 2011, pp. 297-305. doi:10.1111/j.1365-2036.2011.04716.x
- Examination Committee of Criteria for “Obesity Disease” in Japan, Japan Society for the Study of Obesity, “New Criteria for ‘Obesity Disease’ in Japan,” Circulation Journal, Vol. 66, No. 11, 2002, pp. 987-992.
- V. J. Desmet, M. Gerber, J. H. Hoofnagle, M. Manns and P. J. Scheuer, “Classification of Chronic Hepatitis: Diagnosis, Grading and Staging,” Hepatology, Vol. 19, No. 6, 1994, pp. 1513-1520. doi:10.1002/hep.1840190629
- Y. M. Deugnier, O. Loréal, B. Turlin, D. Guyader, H. Jouanolle, R. Moirand, C. Jacquelinet and P. Brissot, “Liver Pathology in Genetic Hemochromatosis: A Review of 135 Homozygous Cases and Their Bioclinical Correlations,” Gastroenterology, Vol. 102, No. 6, 1992, pp. 2050-2059.
- Y. M. Deugnier, B. Turlin, L. W. Powell, K. M. Summers, R. Moirand, L. Fletcher, O. Loréal, P. Brissot and J. W. Halliday, “Differentiation between Heterozygotes and Homozygotes in Genetic Hemochromatosis by Means of a Histological Hepatic Iron Index: A Study of 192 Cases,” Hepatology, Vol. 17, No. 1, 1993, pp. 30-34. doi:10.1002/hep.1840170107
- A. van der Horst and B. M. Burgering, “Stressing the Role of FOXO Proteins in Lifespan and Disease,” Nature Reviews. Molecular Cell Biology, Vol. 8, No. 6, 2007, pp. 440-450. doi:10.1038/nrm2190
- R. Ammendola, F. Fiore, F. Esposito, G. Caserta, M. Mesuraca, T. Russo and F. Cimino, “Differentially Expressed mRNAs as a Consequence of Oxidative Stress in Intact Cells,” FEBS Letters, Vol. 371, No. 3, 1995, pp. 209-213. doi:10.1016/0014-5793(95)00871-6
- M. Eslam, T. Kawaguchi, J. A. Del Campo, M. Sata, M. A. Khattab and M. Romero-Gomez, “Use of HOMA-IR in Hepatitis C,” Journal of Viral Hepatitis, Vol. 18, No. 10, 2011, pp. 675-684. doi:10.1111/j.1365-2893.2011.01474.x
- M. Romero-Gómez, “Insulin Resistance and Hepatitis C,” World Journal of Gastroenterology, Vol. 12, No. 44, 2006, pp. 7075-7080.
- S. A. Harrison, “Insulin Resistance among Patients with Chronic Hepatitis C: Etiology and Impact on Treatment,” Clinical Gastroenterology and Hepatology, Vol. 6, No. 8, 2008, pp. 864-876. doi:10.1016/j.cgh.2008.03.024
- Y. Shintani, H. Fujie, H. Miyoshi, T. Tsutsumi, K. Tsukamoto, S. Kimura, K. Moriya and K. Koike, “Hepatitis C Virus Infection and Diabetes: Direct Involvement of the Virus in the Development of Insulin Resistance,” Gastroenterology, Vol. 126, No. 3, 2004, pp. 840-848. doi:10.1053/j.gastro.2003.11.056
- C. García-Monzón, O. Lo Iacono, R. Mayoral, A. González-Rodríguez, M. E. Miquilena-Colina, T. Lozano-Rodríguez, L. García-Pozo, J. Vargas-Castrillón, M. Casado, L. Boscá, A. M. Valverde and P. Martín-Sanz, “Hepatic Insulin Resistance Is Associated with Increased Apoptosis and Fibrogenesis in Nonalcoholic Steatohepatitis and Chronic Hepatitis C,” Journal of Hepatology, Vol. 54, No. 1, 2011, pp. 142-152. doi:10.1016/j.jhep.2010.06.021
- A. Lecube, C. Hernández and R. Simó, “Glucose Abnormalities in Non-Alcoholic Fatty Liver Disease and Chronic Hepatitis C Virus Infection: The Role of Iron Overload,” Diabetes/Metabolism Research and Reviews, Vol. 25, No. 3, 2009, pp. 403-410. doi:10.1002/dmrr.972
- F. Negro, “Abnormalities of Lipid Metabolism in Hepatitis C Virus Infection,” Gut, Vol. 59, No. 9, 2010, pp. 1279-1287. doi:10.1136/gut.2009.192732
- K. A. Lockman, J. P. Baren, C. J. Pemberton, H. Baghdadi, K. E. Burgess, N. Plevris-Papaioannou, P. Lee, F. Howie, G. Beckett, A. Pryde, A. J. Jaap, P. C. Hayes, C. Filippi and J. N. Plevris, “Oxidative Stress Rather than Triglyceride Accumulation Is a Determinant of Mitochondrial Dysfunction in in vitro Models of Hepatic Cellular Steatosis,” Liver International, Vol. 32, No. 7, 2012, pp. 1079-1092. doi:10.1111/j.1478-3231.2012.02775.x
- B. D. Lindenbach, M. J. Evans, A. J. Syder, B. Wölk, T. L. Tellinghuisen, C. C. Liu, T. Maruyama, R. O. Hynes, D. R. Burton, J. A. McKeating and C. M. Rice, “Complete Replication of Hepatitis C Virus in Cell Culture,” Science, Vol. 309, No. 5734, 2005, pp. 623-626. doi:10.1126/science.1114016
- C. Vecchi, G. Montosi and A. Pietrangelo, “Huh-7: A Human ‘Hemochromatotic’ Cell Line,” Hepatology, Vol. 51, No. 2, 2010, pp. 654-659. doi:10.1002/hep.23410
- I. Shoji, L. Deng and H. Hotta, “Molecular Mechanism of Hepatitis C Virus-Induced Glucose Metabolic Disorders,” Frontiers in Microbiology, Vol. 2, 2011, pp. 278. doi:10.3389/fmicb.2011.00278
- V. Christen, S. Treves, F. H. Duong and M. H. Heim, “Activation of Endoplasmic Reticulum Stress Response by Hepatitis Viruses Up-Regulates Protein Phosphatase 2A,” Hepatology, Vol. 46, No. 2, 2007, pp. 558-565. doi:10.1002/hep.21611
- C. Bernsmeier, F. H. Duong, V. Christen, P. Pugnale, F. Negro, L. Terracciano and M. H. Heim, “Virus-Induced Over-Expression of Protein Phosphatase 2A Inhibits Insulin Signalling in Chronic Hepatitis C,” Journal of Hepatology, Vo. 49, No. 3, 2008, pp. 429-440. doi:10.1016/j.jhep.2008.04.007
NOTES
*Conflict and Interest: Nothing to declare.
#Corresponding author.