Natural Resources
Vol. 3 No. 3 (2012) , Article ID: 23225 , 11 pages DOI:10.4236/nr.2012.33015
Interpretation of Trends in Land Transformations—A Case of Green Heart Region (The Netherlands)
![]()
1Department of Geography, Aligarh Muslim University, Aligarh, India; 2Faculty of Geosciences, Utrecht University, Utrecht, The Netherlands.
Email: *shahabfazal@rediffmail.com
Received June 3rd, 2012; revised July 13th, 2012; accepted July 22nd, 2012
Keywords: Green Heart; Land Use; Land Transformation; Spatial Planning
ABSTRACT
The sprawl-versus-containment debate relates to many different aspects of the broad concept of sustainability, and as such the answers found by research are rarely decisive, compact cities have advantages in some respects, but disadvantages in others. The present study focuses on the patterns of urbanization process in Netherlands as a whole and within the “Green Heart” in particular. The present study finds over the last decades, the Green Heart is under attack from suburbanization of larger and smaller settlements as several political concessions have been made to local development needs. The Green Heart is also affected by the construction of new roads and railway lines. This infrastructure is built for tangential transport of an increasing volume of commuters. The spatial policies for preserving green spaces suffer from a dilemma between two contradicting functions of green space in a regional context: to be a separator of urban and rural areas and to be an integrator towards the Regional City of “Green Metropolis”.
1. Introduction
Urbanization has showed an almost exponential growth since the end of the 19th century [1]. Initially, urbanization was considered as a diffusion process starting from the growing urban centers that affected the countryside in concentric spheres of differentiated influence [2,3]. The reality proved to be much more complex and many city models and models for urban land use structure have been made suggesting different elements for the dynamoics of its changing nature with time [4].
The relation between urban and rural becomes extremely complex and receives a growing attention in spatial and environmental planning [5]. Typical is the transition between an urban center or agglomeration and the countryside becoming unclear and diffuse. The urban fringe or suburban landscapes are characterized by a wide variety of land uses, which is expressed in a complex, diverse and highly fragmented morphology. Nowadays, urbanization is no longer typical for the growth of cities or towns only but it influences the processes in the rural countryside as well.
The speed of the changes, their frequency and magnitude increased unprecedented in the second half of the 20th century. Many new elements and structures are superimposed upon the traditional landscapes that become highly fragmented and lose their identity. New landscapes are created, which are characterized by a functional homogeneity.
Europe is a highly urbanized continent and analyzing the urban form here is crucial because four out of five European citizens live in urban areas. The urban form is referred here as a property of a city which is static for a given point in time, whereas urban growth is a dynamic process that alters urban form. The definitions of urban form vary to a great extent in the literature. While some authors solely rely on land use/land cover to measure urban form in terms of the physical structure of a city [6,7], others also include socio-economic aspects such as population number or density [8-10]. Urban form reveals the relationship between a single city and its rural hinterland [11] as well as the impact of human actions on the environment within and around a city [12,13]. An ongoing debate distinguishes between the “urban sprawl” often found in North American cities and in developing countries of Asia versus the idealized, European “compact city” as two opposite urban forms [14].
In Europe, there was strong advocacy for the “compact city” concept, essentially high density, mixed-use cities, with clear (non-sprawling) boundaries [15,16]. The compact city and many of the urban design and planning movements, such as “new urbanism”, “sustainable communities” and “smart growth”, aimed to promote more sustainable patterns of development [17,18]. However, claims of the contribution of compact urbanization to sustainable development have been contested in the literature ever since [19,20].
2. Discussion
2.1. Planning Initiatives to Restrict Urban Expansion: A Few Examples
Studies have suggested that European cities were more compact and less sprawled in the mid 1950s than they are today, and expansion of urban areas is a common phenomenon throughout Europe. Moreover, there is no apparent slowing in these trends. There have been a lot of planning initiatives to restrict the urban expansion of European cities in the form of protecting green regions. The study tries to assess the status of prominent green regions in Europe to check how these policies have performed in restricting the expansions. The discussion deals with green belt (UK), park region (Germany) and green heart (The Netherlands) with detailed investigation of policies for green heart region in Netherlands.
2.1.1. The Green Belt Act of UK
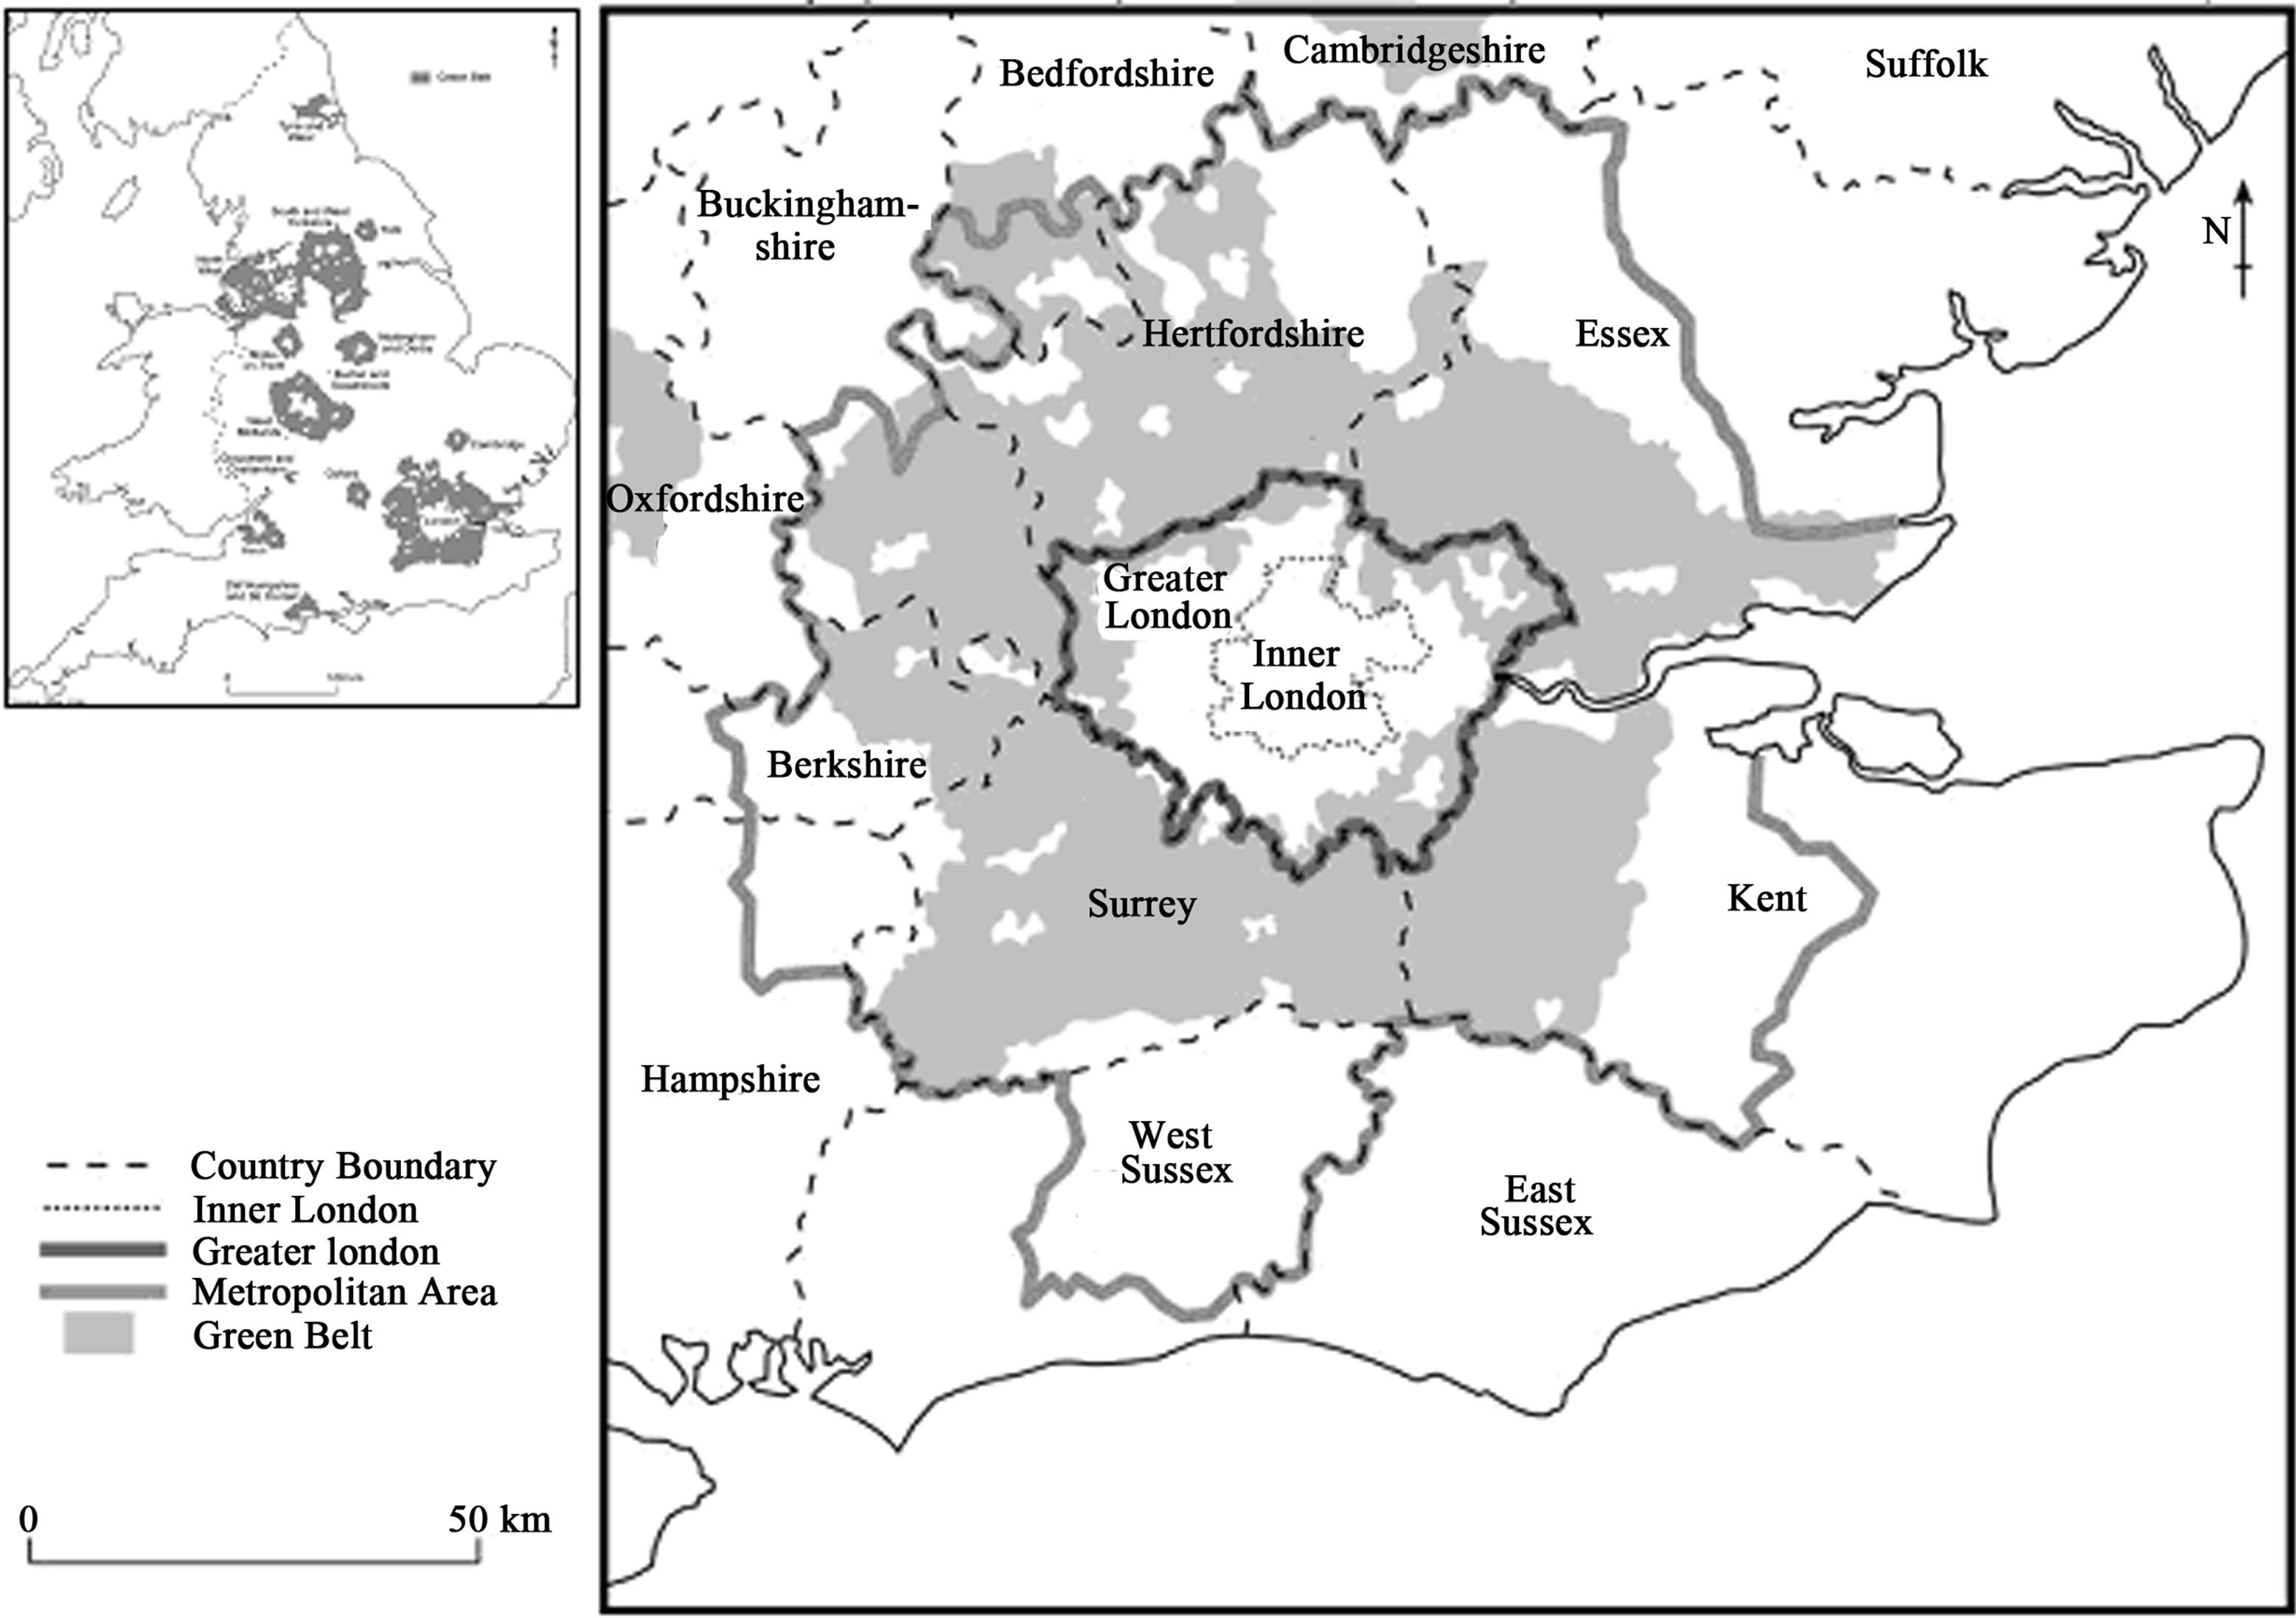
In England, the present London Green Belt Act and the statutory establishment of Green Belts around several major cities and conurbations formulated in the 1950s (Figure 1(a)). This incorporated an encircling Green Belt or green girdle around city as protection against unrestrained urban expansion. It was also to act as a source area for agriculture and recreation, providing rural contact to counterbalance the urban setting of the residents in the newly-created garden cities.
Studies suggest that the urban containment policies were found to be varied in spatial terms [21]. Even in areas where the appearance of the metropolitan fringe looks relatively unchanged, the pace of change was still rapid. This reflects the ongoing pressure on local authorities to convert some areas of farmland to housing, industry and recreational use. One result has been ongoing piecemeal erosion of controls and further losses of green areas to development [22].
Thus in general, the Green Belt Policy, which was conceived and still largely continues to operate as a mechanism “to preserve the integrity of the built-up areas on one side of it and the countryside on the other”. But the policy for preventing urban sprawl was pressed hard by the urban forces and resulted in development of “edgelands” with increasing demands in the urban fringe [21]. The government policies and plans also contributed to giving mixed signals about Green Belt protection which confused local planning authorities and encouraged speculators to purchase land in the hope of future development.
2.1.2. The Regional Parks Plan of Germany
The German spatial planning is focused on strategies of regional-park development which are project-oriented tools for improving the urban landscape. They seek to remedy the deficiencies of formal planning tools in response to persistent losses of open green space and the growing task of organizing fragmented landscapes in expanding urban regions. The regional park concept of Germany was an attempt to transfer the “park” concept to an urban region. Parks are generally seen as green spaces contrasting with open landscape and building development [23]. Since it is not practicable to develop open spaces in a densely built-up urban region so, regional parks set focal points of landscape design with the nondesigned landscape being conceptually integrated. Here the traditional park concept and the nature conservation, encompassing the entire cultural landscape were combined in regional parks.
In 1998, the Berlin/Brandenburg planning authorities declared eight landscape areas in the environs of Berlin exploratory areas for regional-park development as a measure to curb the feared “commuter belt” or “Speckgürtel” and thus safeguard open green space and preserve the urban edge characteristic of the Berlin periphery (Figure 1(b)) [24].
The studies suggest that German policy of preserving green space also faced with strong demand for land in and around metropolitan regions eroding mainly the open green space. This again resulted in the quantitative loss of open green space, concurrent with structural change, namely fragmentation, and with detrimental qualitative changes in the open green space remaining in the urban region owing to reduced functionality and aesthetics.
2.1.3. The Green Heart Policy in the Netherlands
Space is at a premium in the Netherlands, this means that there is not enough space available for all activities. In addition, many uses of the available space exclude other uses to some extent. Competition between two or more potential uses is therefore a common problem in the Netherlands. The national spatial planning policies in the Netherlands were aimed at implementing compact urbanization in various forms. Most efforts were directed mainly to the Randstad, a distinctive poly-nucleated pattern of urban centres in the western part of the Netherlands (including the major cities of Amsterdam, Rotterdam, The Hague and Utrecht and a substantial number of smaller cities). Within this ring of settlements a core of green landscape named as green heart is put forward to check the urban sprawl as planning initiatives.
The Netherlands is a rather small sized country with the area of 4,152,628 square km and with today’s population of little over 16 million. However, it is one of the most urbanized countries and the average population density of about 470. The most urbanized area, Randstad has the population density of 2000 inhabitants/sq. km. Out of the total area of the Netherlands 60% area is under agriculture, 15% under open space and only 12% is designated as build-up area. Besides, 40% of the total country is under sea level and water. Such a scarcity of area was the main reason why they specialized in spatial planning to manage the land. The important features of the Netherlands LU/LC are as follows:
 (a)
(a) (b)
(b)
Figure 1. (a) The green belt around London metropolitan area; (b) The green belt of regional parks around Berlin.
Sustained expansion built-up area: The Netherlands is still an agricultural country, if land use is taken into account. More than half of the Netherlands is occupied by farmland, but the area covered by farmland is gradually being reduced as built-up areas are expanding.
Agriculture and horticulture claim the largest area: Altogether, 55 percent of the Netherlands is under agricultural and horticultural purposes, followed by woodland and natural terrain with 12 percent. Although builtup areas are prominent but it covers only 8 percent of the total land area of the Netherlands.
Expansion built-up area reduces farmland: The proportion of built-up area is increasing gradually (8.3 percent). New residential areas (2300 hectares) and new industrial sites (3 thousand hectares) together equal an area about the size of Maastricht. The total built-up area has shown sustained growth throughout the years at the expense of farmland. New built-up areas also include infrastructural works. The area used for infrastructural facilities has increased by more than 1100 hectares (Figure 2).
Most substantial increase in South Holland: The largest expansion of built-up area was in the province of South Holland with large municipalities like Rotterdam (increase of about 300 hectares) and The Hague (increase of about 80 hectares). The largest area of new housing estates was also realized in South Holland, but large housing estates were also built on the outskirts of big cities like Utrecht (Leidsche Rijn) and alongside motorways, e.g. Ypenburg in The Hague. New industrial sites were also predominantly built in South Holland, for example on the Maasvlakte (more than 200 hectares).
The expansion of built-up areas, infrastructure and forest in the last twenty years has been at the expense of natural areas and agricultural land. In addition to the reduction in the space for nature and landscape, other spatial mechanisms also play a role in the threat to these areas (Figure 2). Housing, work, recreation and traffic and transport are taking up an ever-larger proportion of the available area, especially in the Randstad urban agglomeration and in Brabant. With this background, the present study focuses on the patterns of urbanization process in Netherlands as a whole and within the “Green Heart” in particular.
2.2. Green Heart in the Randstad: Form and Functions
The Randstad concept was first introduced in the 1930s by the founder of Royal Dutch Airlines (KLM) and the Airport Schiphol, who argued with the central location of the airport in the ring of cities. The concept was forced in the 1950s by a political committee of national, regional and local representatives, intending to denote the rapid growing cities. During the 1950s, the term Randstad was only used to describe the urban ring without the interstitial The Netherlands—LU/LC (2006)
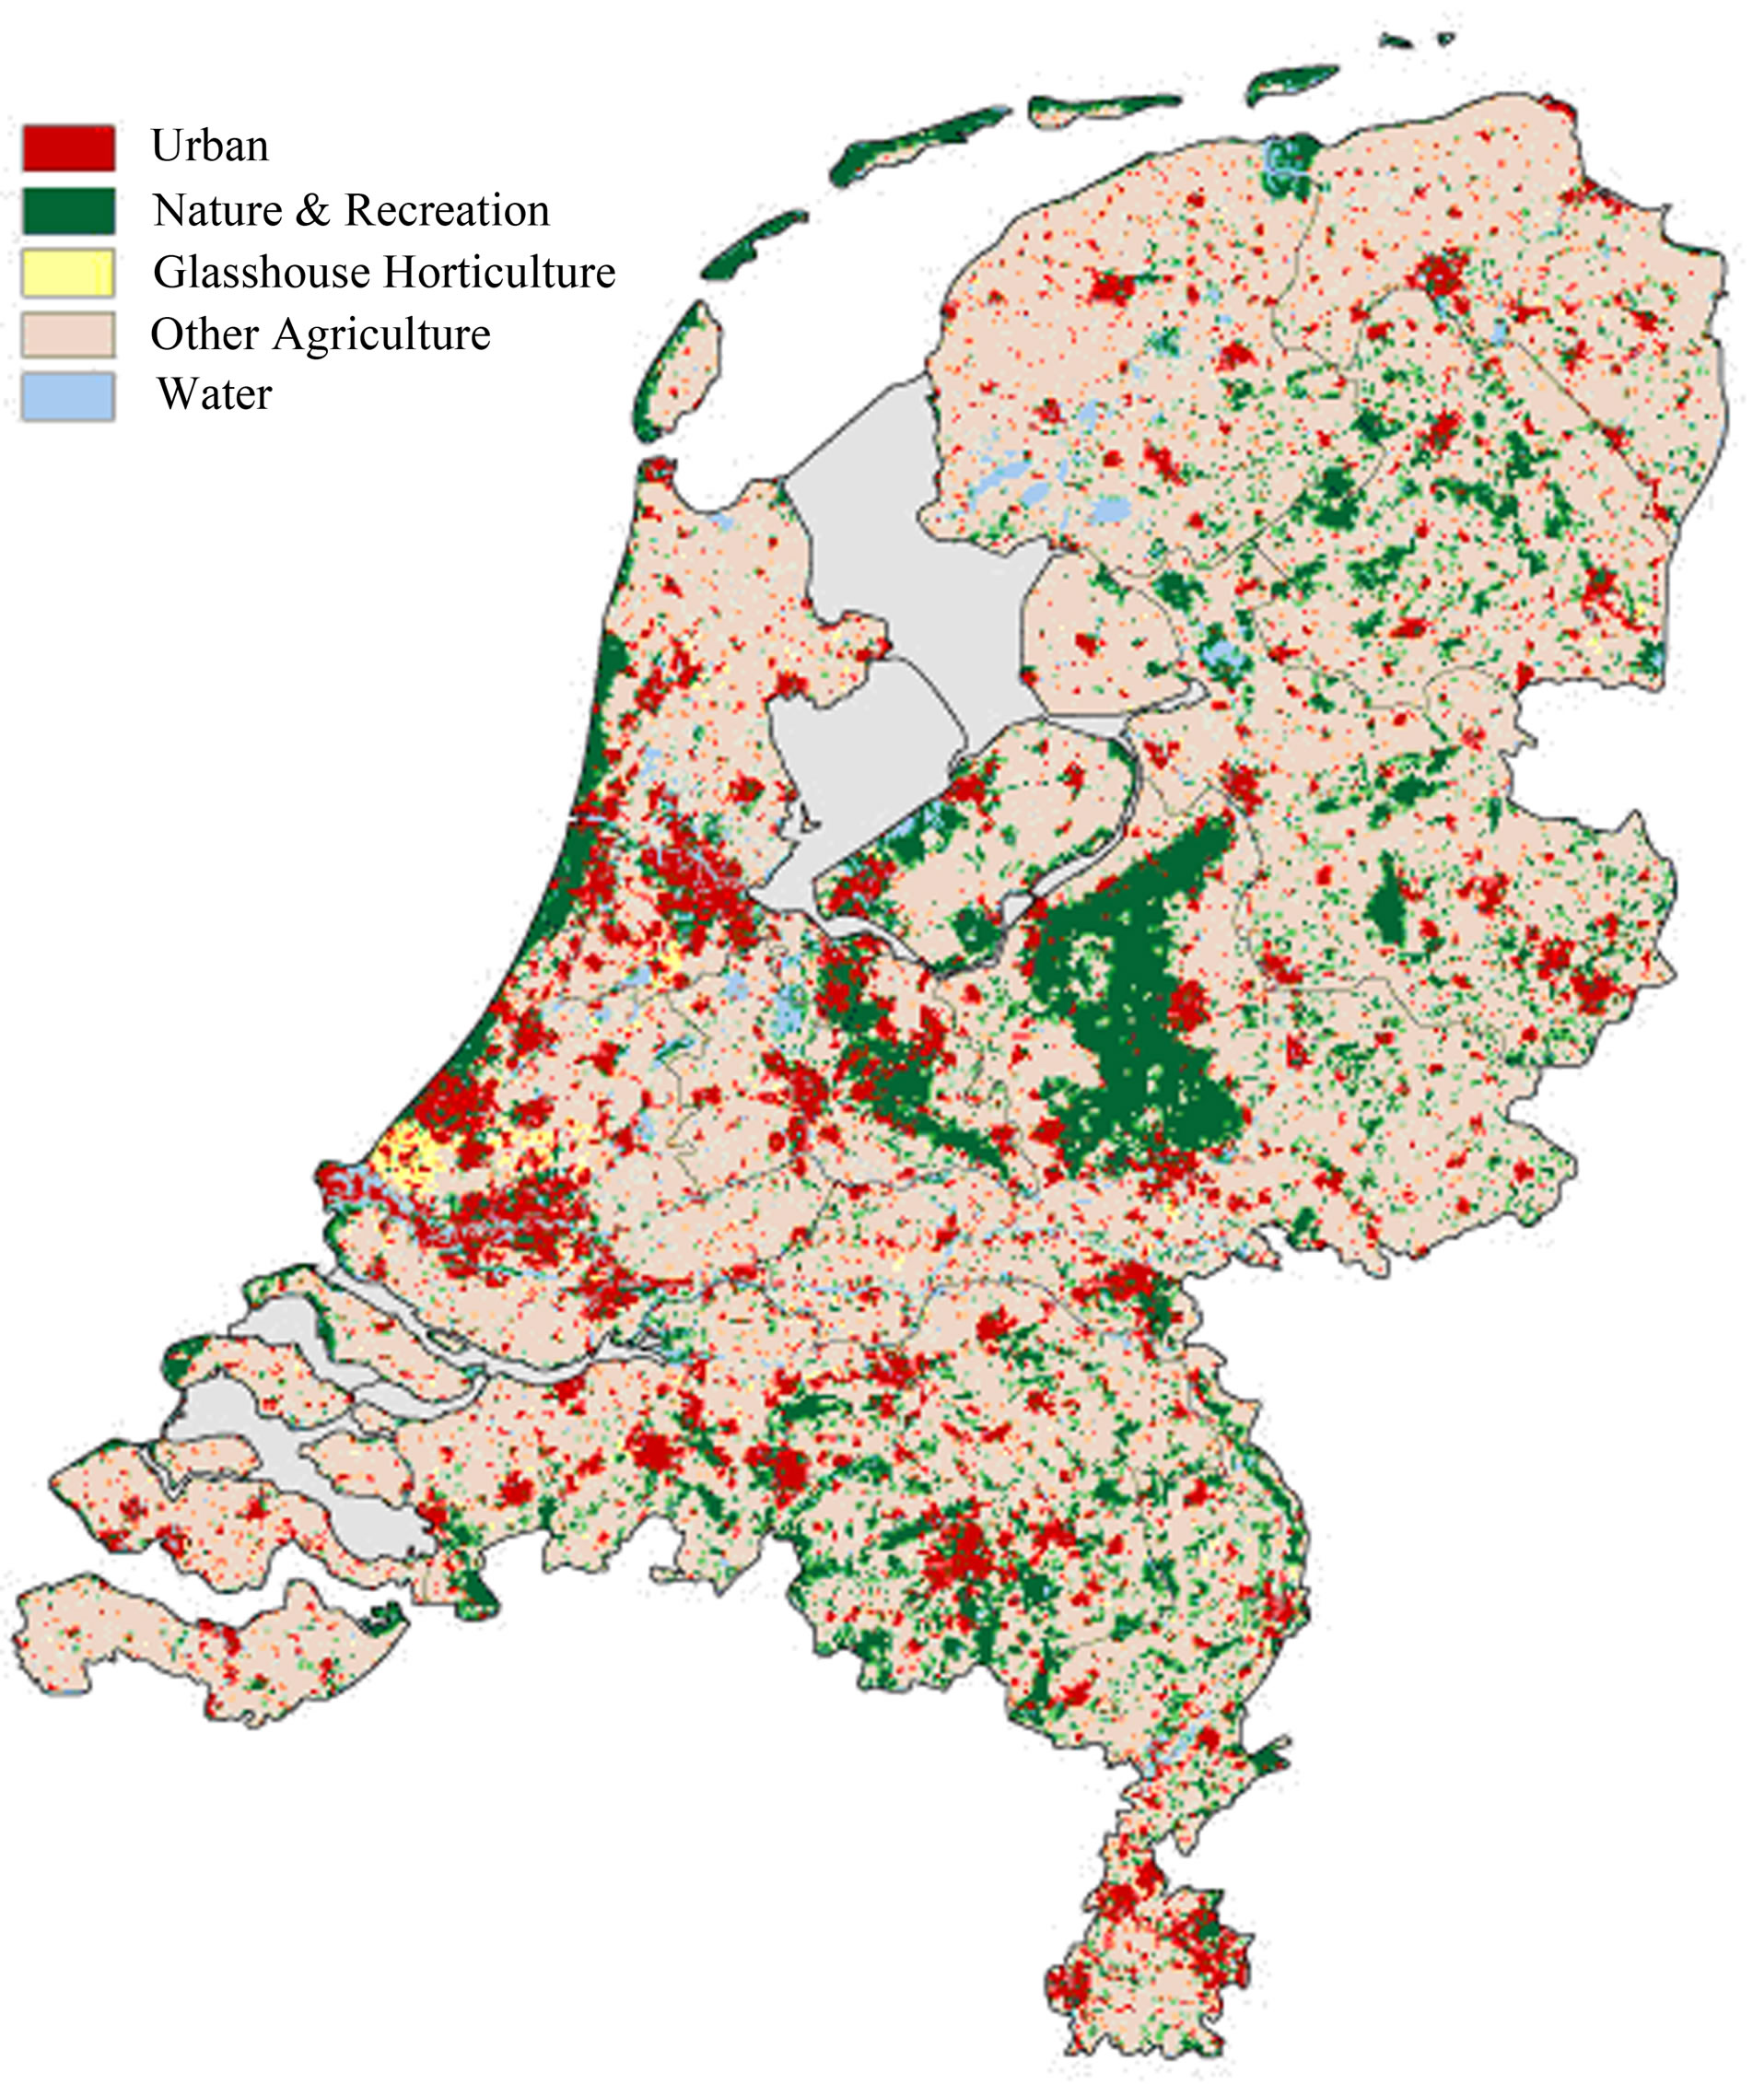
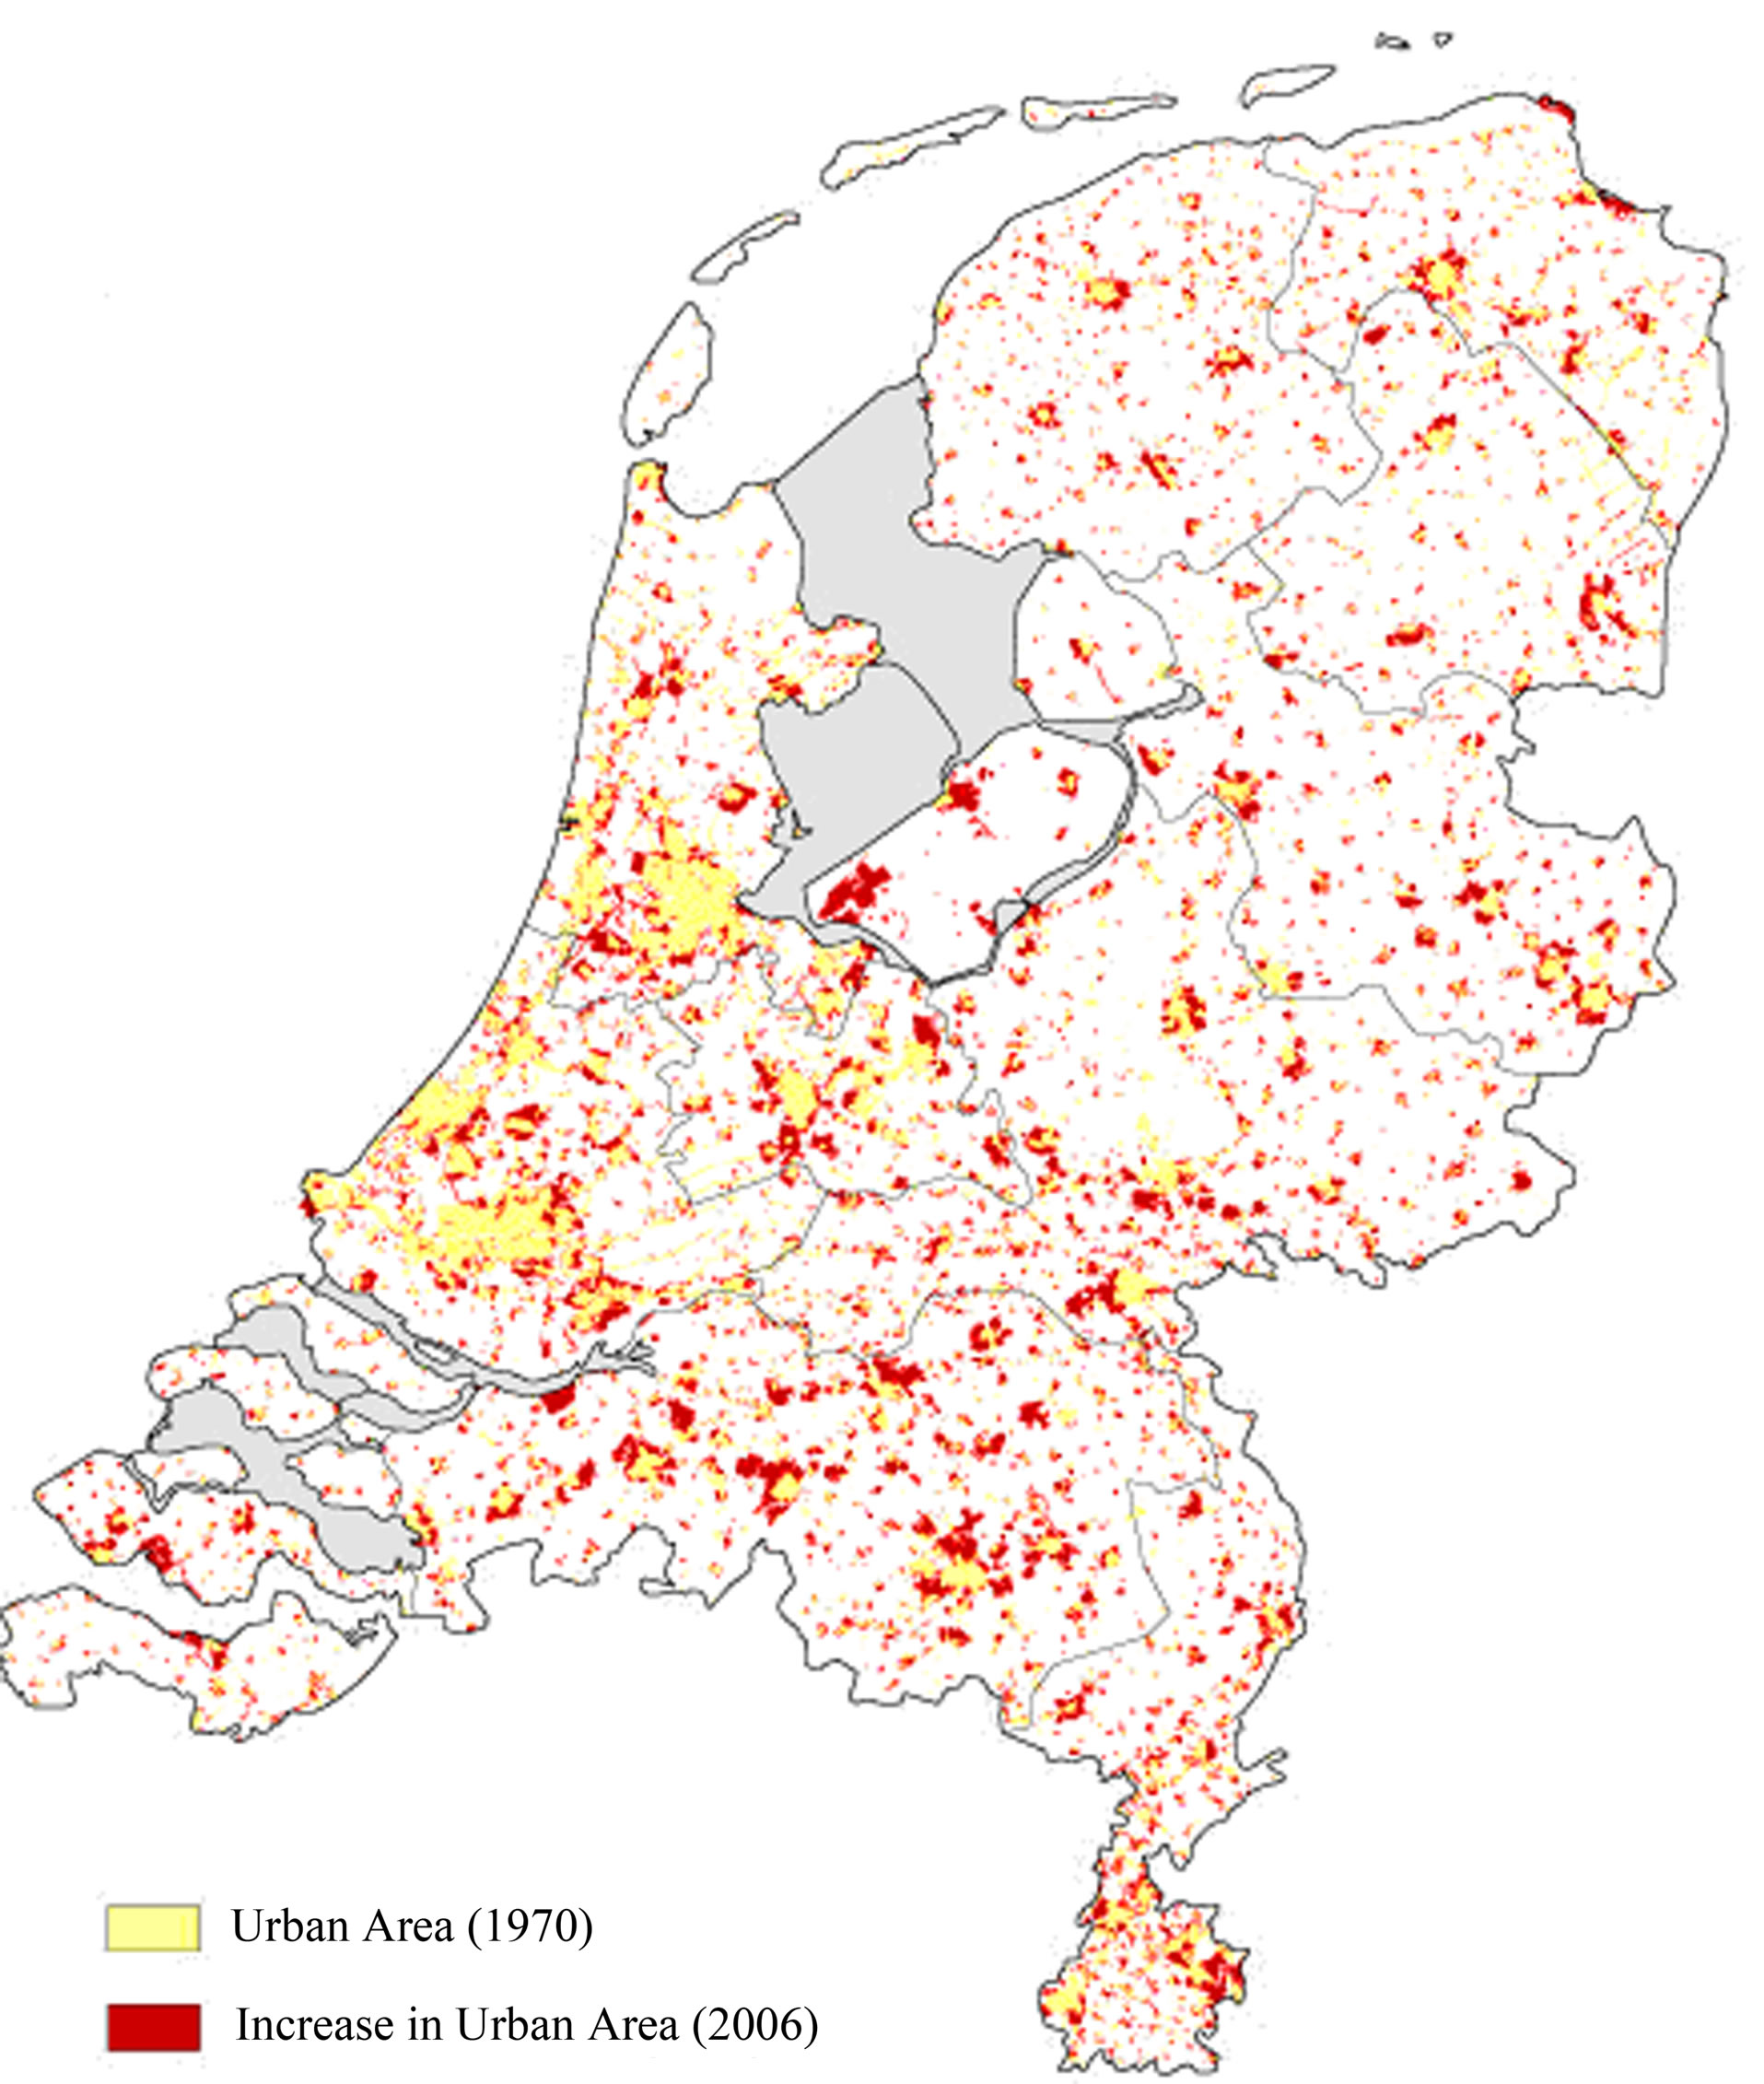
Figure 2. LU/LC map of the Netherlands and the increases in urban areas.
open space. In the 1960s, the term “Greenheart Metropolis” [25] appeared to define the polycentric conurbation of Randstad over a central open space. Thus Randstad is a metropolitan region in the western part of The Netherlands, connecting the major cities of Amsterdam and Rotterdam, The Hague and Utrecht. The Randstad consists of a horseshoe-shaped urbanized ring around a central open space, first in 1956 called “Green Heart”. In the Randstad, the rim cities form a belt and landscape the core (Figure 3).
Presently, the conurbation of the Randstad covers a surface of approximately 6000 km2 with nearly 6 Million inhabitants. Four Million of them live in the settlement ring, which is often subdivided into a Southern and a Northern wing. The Green Heart covers an area of about 1600 km2 in the middle of the conurbation, defined to prevent the individual cities from converging to a single urbanized area. Within the Green Heart, there are 70 local municipalities, of which 43 fall completely within its boundaries. The Green Heart landscape consists to a large extent of agricultural land, which is mainly used as pasture. Dairy farms within the Green Heart have followed the general trend of intensification and increase of scale. Parts of Nature areas and wetlands within the Green Heart are very low, but some of the lakes are used as recreation areas.
3. The Data and Methodology
The study is based on secondary sources of data. The data for Green Heart Region was generated from the digital topographical base file of the Dutch Topographical Service (Topografische Dienst Nederland), the base geometry adopted from TOP10 Vector. This makes possible a proper exchange of geographical information about land use (the Bestand Bodemgebruik (BBG)) with other sources of geographical information based on the TOP10 Vector. To establish a link with the results of previous sets of land statistics were also used. The GIS analysis was done using Arc GIS.
3.1. Land Use/Land Cover in the Green Belt Region
The present study is spread over 167,338 hectares of land. Agriculture is by far the largest land-use category, occupying 75% of the available space. The built-up area (including infrastructure) and water each occupies about 10%. So, only 5% is left for forest, nature and recreational

Figure 3. The green heart region.
areas. From the perusal of Table 1 and Figure 4, it is evident that Green Heart Region has witnessed changes in land use/cover. The statistics shows that the region has witnessed land use changes among classes such as build-up area, which has increased from 8406 hectares to 9499 hectares (an increase of 30 per cent), transport an increase of 502 hectares (10.7 per cent increase), area under other class, an increase of 477 hectares (15.5 per cent increase), open spaces, an increase of 729 hectares (83.3 per cent increase), recreation, an increase of 545 hectares (15 per cent increase), nature, an increase of 234 hectares (4.8 per cent increase) and water bodies, an increase of 70 hectares (increased marginally by 0.5 per cent). These changes were at the cost of the agricultural land within the Green Belt Region. The agricultural land has lost 3650 hectares (a decrease of 28.9 per cent) to the land transformation in the region.
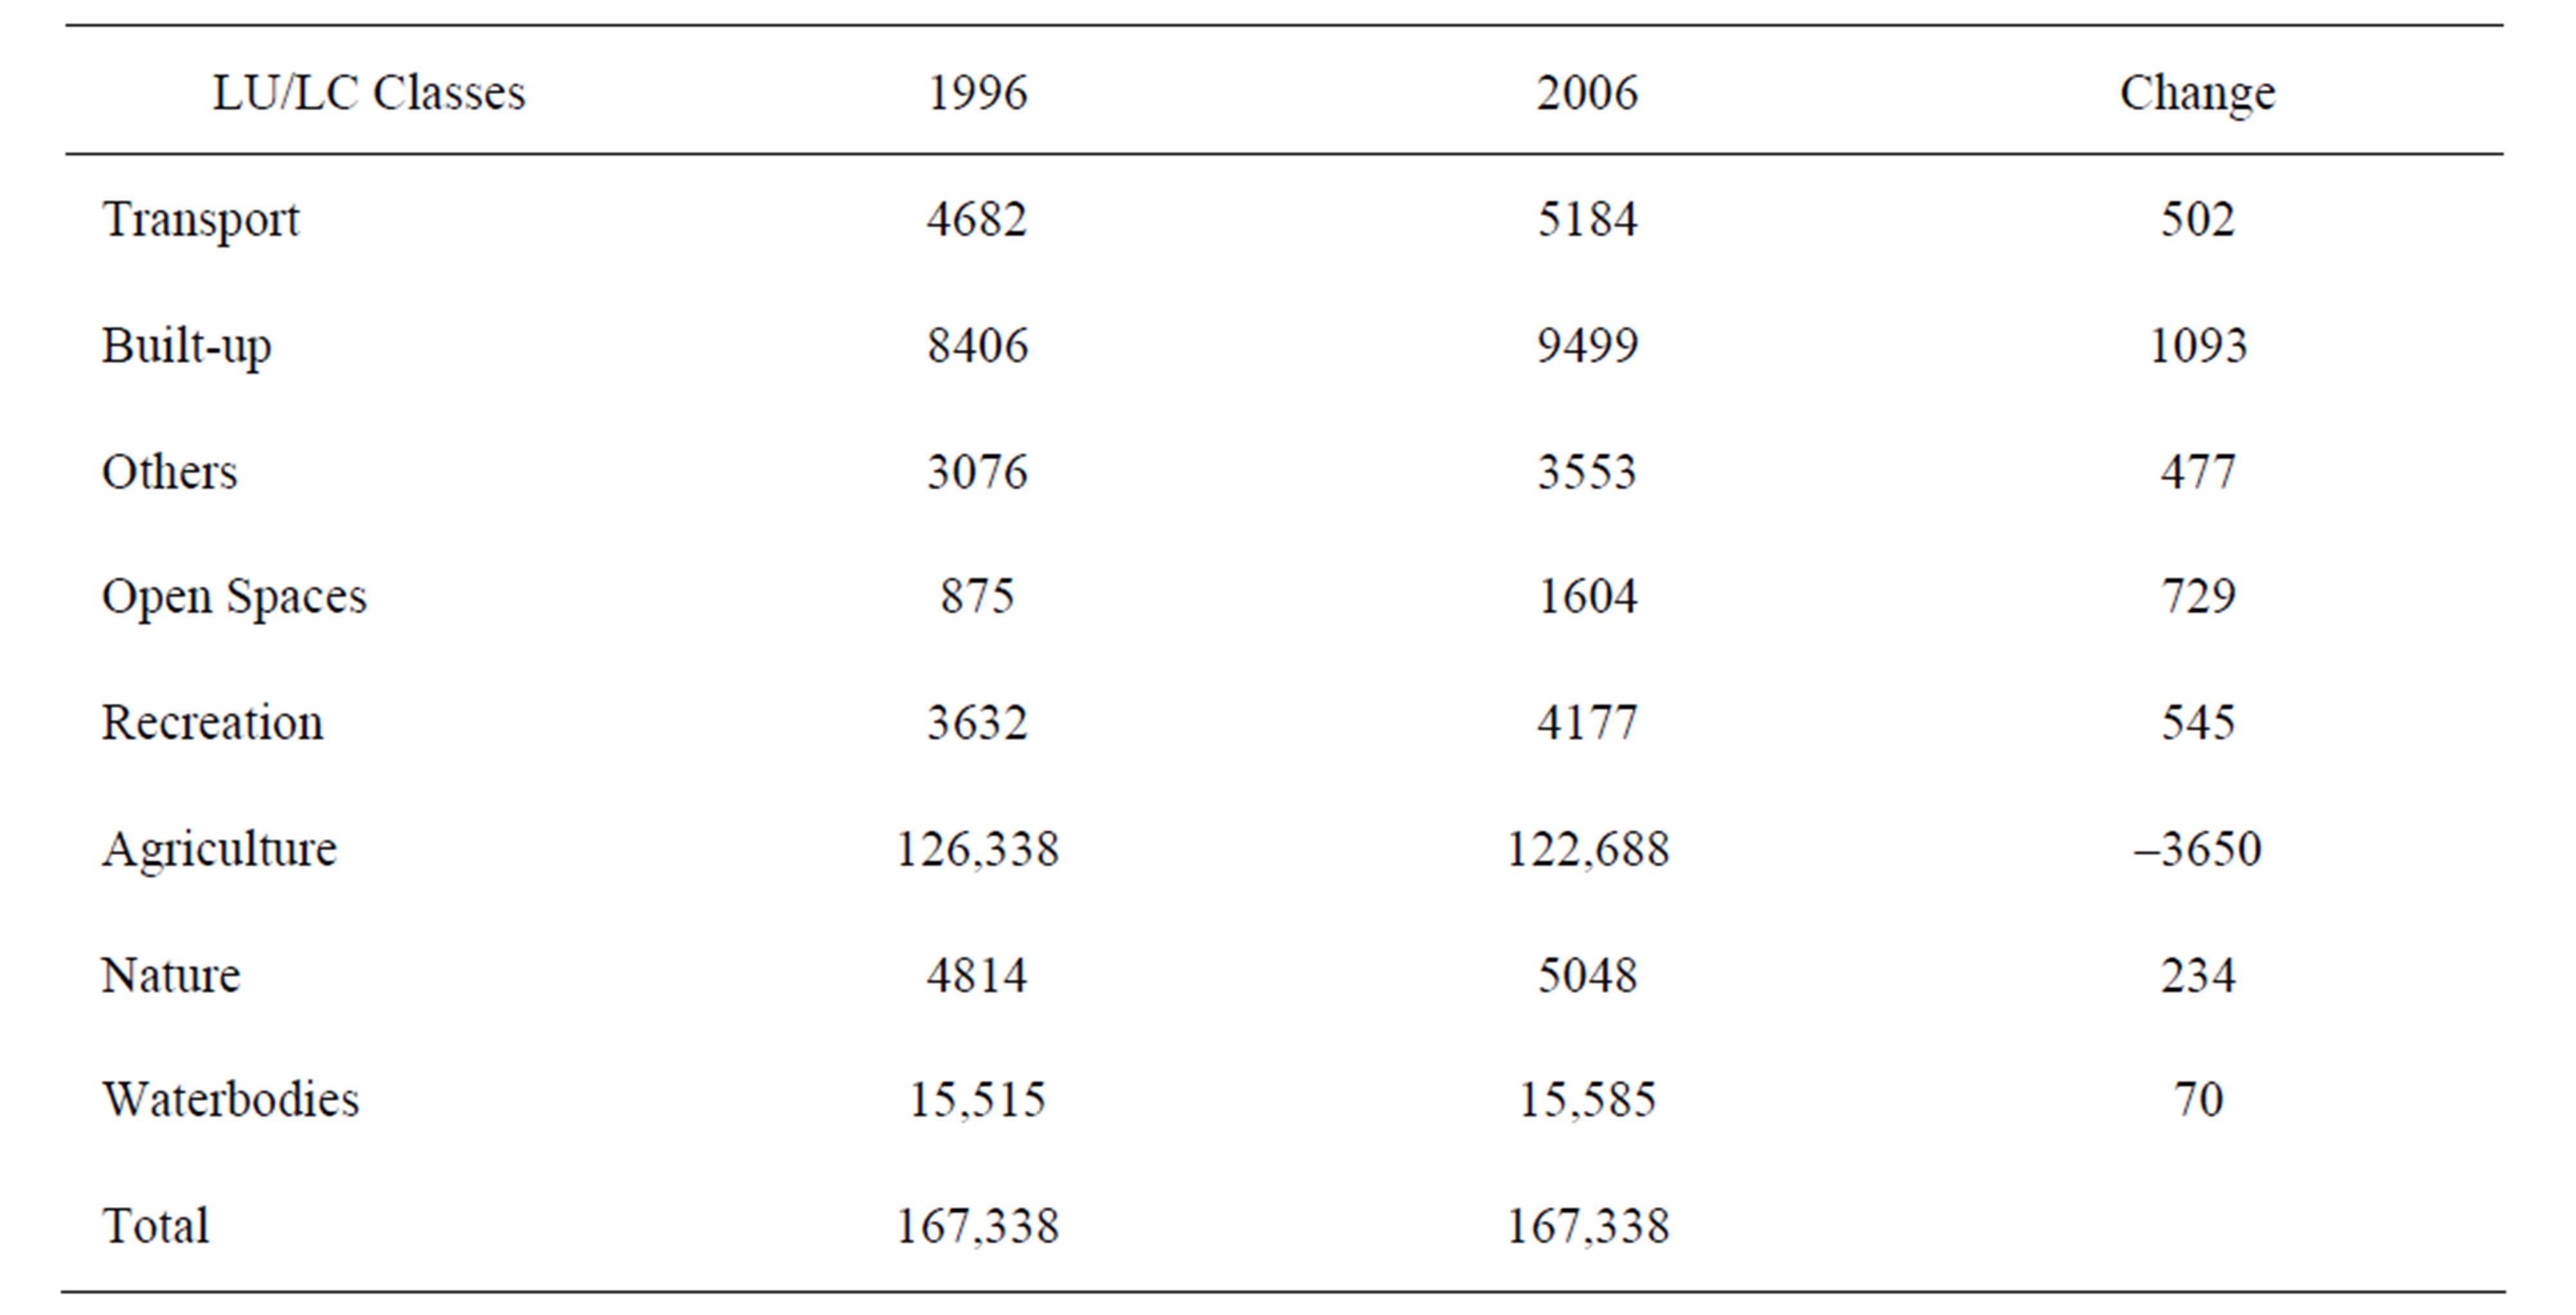
Table 1. Green heart region land use/land cover (1996-2006).

Figure 4. Green heart region land use/land cover.
3.2. Land Transformation in the Green Belt Region
Land transformation is the process of identifying differences in the state of any phenomenon by observing it at different time periods. Land is in a continuous state of transformation as a result of various natural and manmade processes. Examples are changing agricultural lands to nature or recreation or as built-up land (residential, commercial or industrial etc.). The term land transformation refers in some way to developments and the study of land transformation, therefore, requires a comprehensive understanding and monitoring of the causes responsible for the land transformation. During the study period, Green Heart Region has observed interchange of land among various land use classes. Table 2 and Figure 5, which are prepared applying G.I.S. technique (using ArcMap), show the changes in various land use classes of the region.
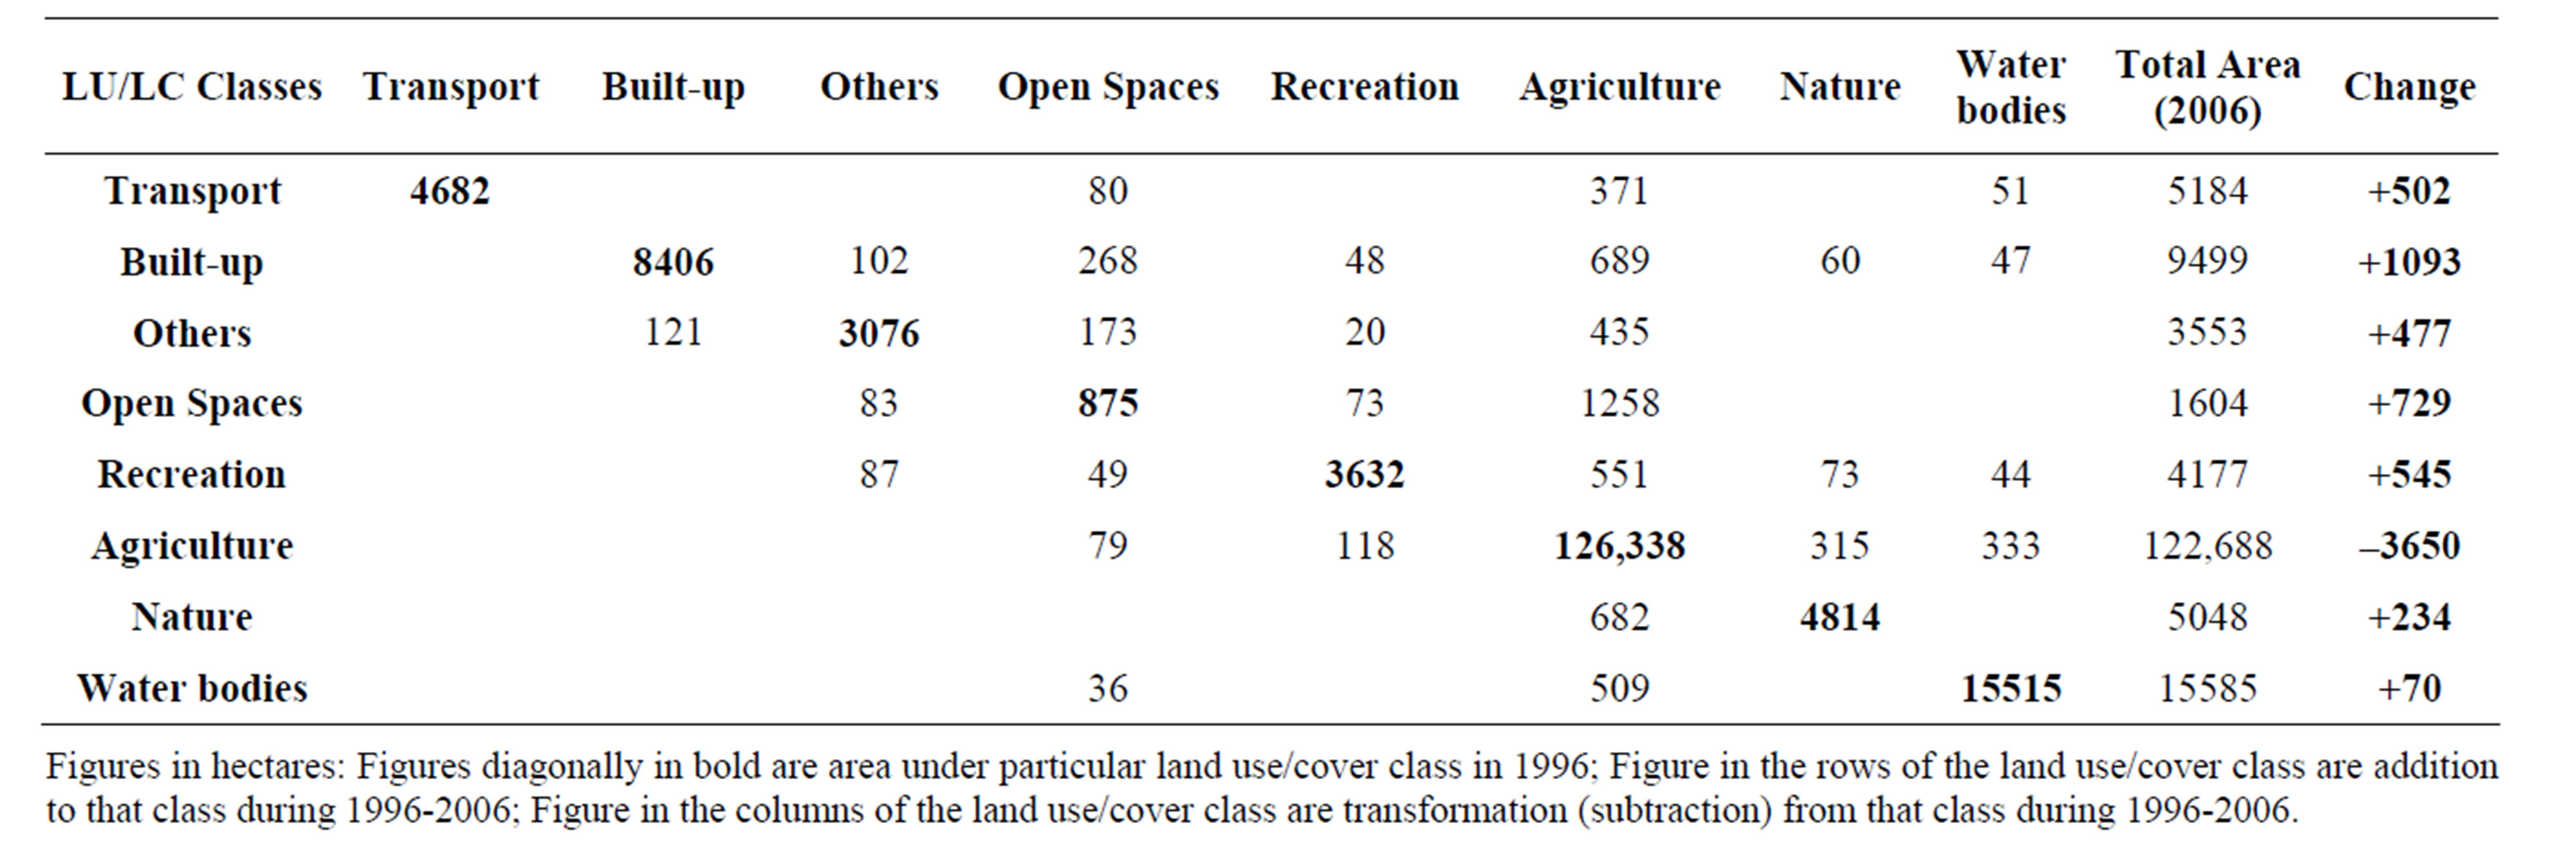
Table 2. Green heart region-land transformation (1996-2006).
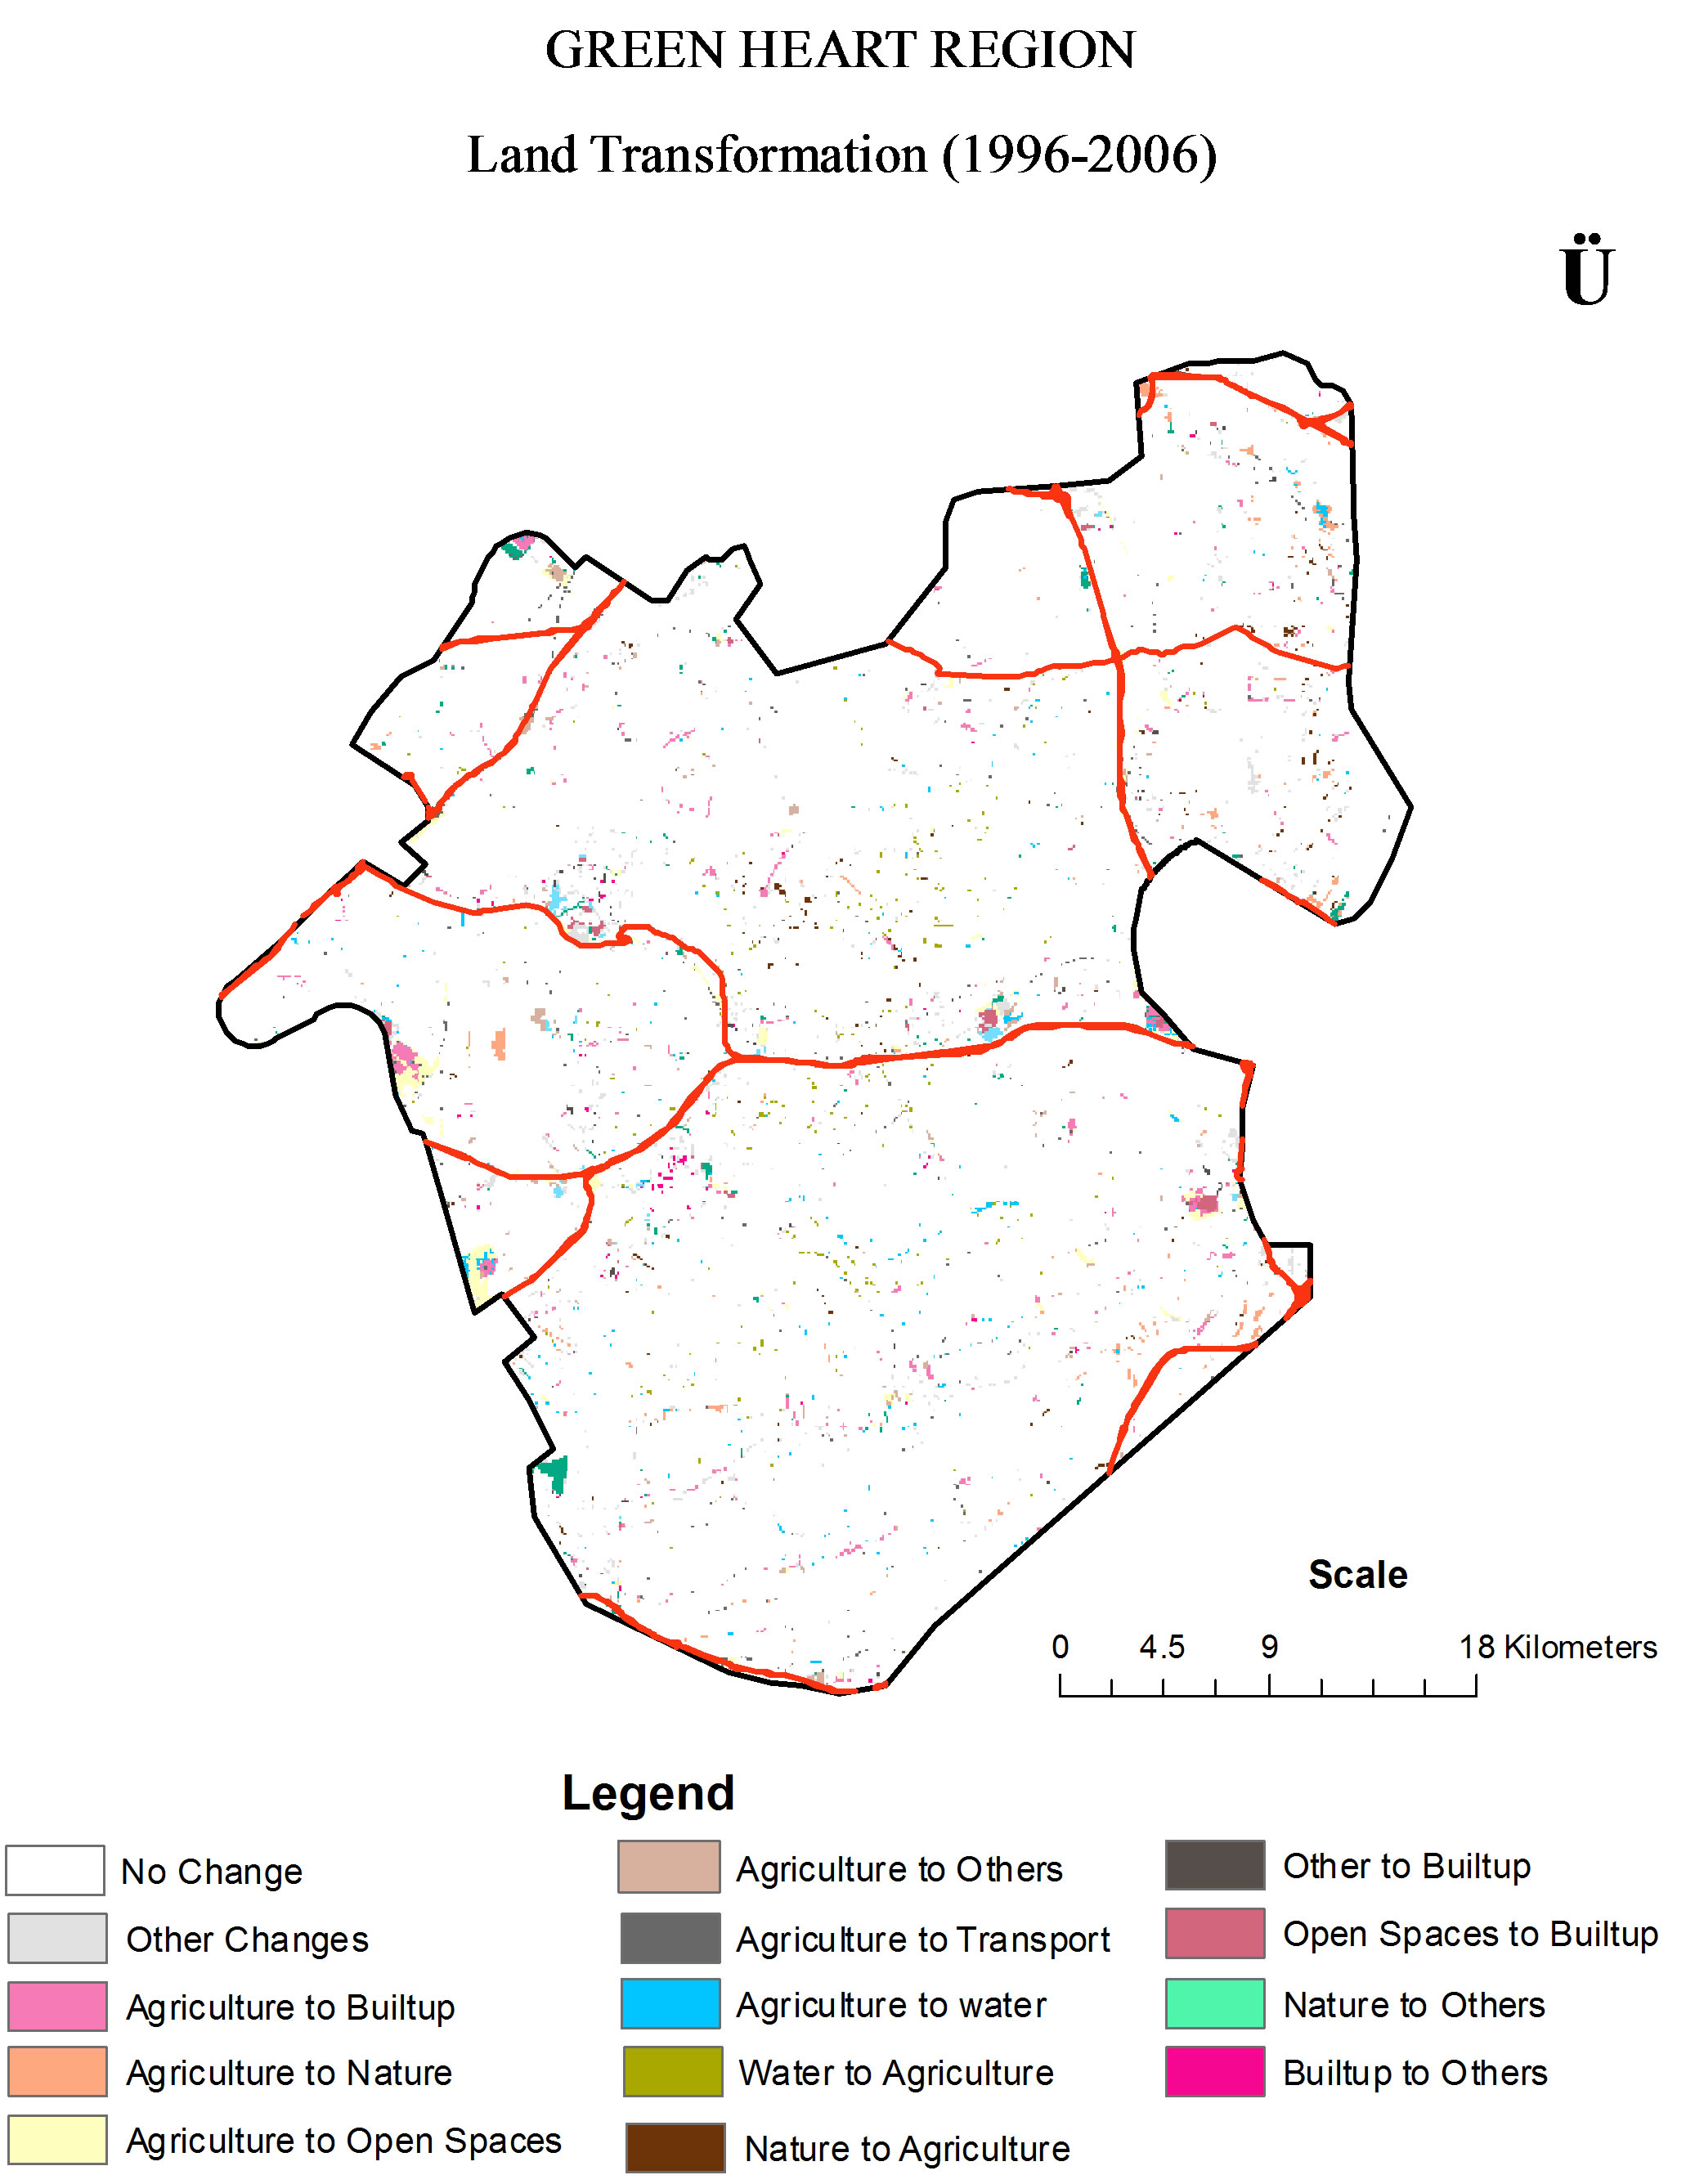
Figure 5. Green heart region land transformation (1996-2006).
The built-up area has increased by 1093 hectares, capturing land mainly from agriculture (689 hectares), open spaces (268 hectares), nature (60 hectares) and others (48 hectares). Built-up area also lost area to other land use class (121 hectares). Area under open spaces has increased from 875 hectares to 1604 hectares gaining land from agriculture (1258 hectares), recreation (73 hectares) and others (73 hectares) in the region. It also lost area largely to built-up (268 hectares), others (173 hectares) and marginal area to transport, recreation, agriculture and water bodies. Area under recreation has increased from 3632 hectares to 4177 hectares gaining land from agriculture (551 hectares), others (87 hectares) and nature (73 hectares) in the region. It also lost area to agriculture (118 hectares) and some area to open spaces, others and built-up area. Area under nature has increased from 4814 hectares to 5048 hectares interchanging land from agriculture gaining 682 hectares but also losing 315 hectares). Some more area under nature was lost to recreation (73 hectares) and transport. The water bodies increased marginally from 15,515 hectares to 15,585 hectares again interchanging land from agriculture gaining 509 hectares but also losing 333 hectares). Some more area under water bodies lost to recreation and transport.
During the study period all the changes have resulted in reduction of agricultural lands, which decreased from 126,338 hectares to 122,688 hectares. All the land use classes have captured agricultural land (open spaces 1258 hectares, built up 689 hectares, nature 682 hectares, recreation 551 hectares, water bodies 509 hectares, others 435 hectares and transport 371 hectares), where as water bodies (333 hectares) and nature (315 hectares) also contributed land to agricultural class.
The perusal of Figure 5 shows that built-up area has increased around the existing settlements. Most of these increases are on agricultural land and open spaces, especially at the junctions of roads (lying within the 500 meters buffer of roads). Whereas, the agricultural area suffers losses around the settlements where not only built-up areas are encroaching upon it but other urban oriented classes, such as open spaces, recreation, others etc. have taken up agricultural lands (lying within 500 meters buffer around settlements).
There were also restructuring within the settlements, this has resulted in interchange of land among various other land use classes.
3.3. The Drivers of Land Transformation in the Green Heart Region
The Green Heart and the Randstad consist of a ring of high ground which surrounds an area of marsh fens. Towns were built on the higher ground and, as a result, the land in the middle has remained fairly open. The concept Green Heart implies an open area meant to serve as a large, central and agricultural land mass, where urbanization is prevented as much as possible. The Dutch Government wants to achieve this aim through a restrictive policy on housing and employment, and since 1982, an active policy for enhancing the green functions, such as agriculture, nature and recreation. There are some important drivers of change which have bearings on land transformation of the region. These drivers are discussed below:
3.3.1. Demography
Despite the restrictive policy, the number of inhabitants in the Green Heart more than doubled between 1950 and 2006 as also the pace of building houses in the Green Heart was above the Dutch average. Moreover the number of households is also rising faster than the rise in population (there is also rise in single person households). These demographic developments are likely to result in an increase in urbanization, which will, due to the high density of the Netherlands, intensify pressure on the Green Heart.
3.3.2. Economy
In general, the Dutch economy is flourishing and the Randstad plays an important role in this. It is an attractive environment for companies in competitive terms due to the favourable location, infrastructure, culture, overheads and highly educated employees. The economic development of the Randstad has extended into the Green Heart, especially along the main motorways where companies want to settle in the green environment. Furthermore, future European agricultural policy will impact the vitality of the agricultural sector in the Green Heart, which is currently one of the key actors in keeping the Green Heart open and green, notwithstanding the negative environmental pressures associated with agriculture. Agriculture in the Green Heart depends heavily on dairy farming, a sector that is strongly influenced by the European Agricultural Policy.
3.3.3. Institutions
There is no single legislative body for the Green Heart. Most of the policies for the Green Heart came originally from the national government. The three provinces in which the Green Heart is located (Noord-Holland, ZuidHolland and Utrecht) translate the national policy to the regional level. Finally, municipalities are responsible for the real implementation of the policy. In the 90s, a socalled Steering Group for the Green Heart (Stuurgroep Groene Hart) was formed to coordinate the policy for the Green Heart region. It consists of policy makers from various governmental bodies (ministries, provinces, municipalities) and interest groups like nature organizations.
3.3.4. Nature and Environment
Developments in infrastructure have led to some fragmentation of the landscape and disruption of ecosystems. Other environmental problems are disturbances caused by light and sound due to transport and lamp standards. Airports and their related activities have direct environmental impacts on the Green Heart in the form of noise pollution and threats to air quality. National government is trying to create new nature areas in the Green Heart. Two examples are De Ronde Venen, development of wet nature area, and the Bentwoud, a forest development plan. Climate change and especially global warming are big issues on the global scale. As a consequence it is generally expected that water levels will rise. This may cause a water surplus increase in the polders of the Green Heart.
3.3.5. Transport and Infrastructure
The Green Heart has experienced a growth in infrastructure, both in terms of roads (such as the construction of the A2, A4 and A27 motorways), and of rail infrastructure (such as the Schiphol line and Flevoline). At the moment the Randstad is coping with severe congestion problems. Since 1986, the number of hours spent in traffic jams in the Netherlands has increased by almost 70%. The Green Heart’s road network is often used as a shortcut to escape these congestion problems. For the last 15 years the national airport, Schiphol, has experienced a yearly increase of 8% in the number of passengers and is expected to expand even further. With regard to rail infrastructure, a High Speed Line (HSL) is planned between Amsterdam and Brussels, and along the Betuwe Route, between Rotterdam and its hinterland. Both rail trajectories will go through or pass alongside the Green Heart.
3.3.6. The Changing Logic of Spatial Planning
Over the recent years all sector departments have, one by one, come up with modified planning documents. The Ministry of Agriculture advocates for mixed use environments around cities intermingling “red” and “green”. It aimed at solving problems particular to the city and to the surrounding countryside that are undergoing changes in particularly owing to a reclining agricultural usage. This was a deviation to the official planning concept of the compact city and the restrictive building policy for the green zones surrounding the urban regions. Similarly, the Ministry of Economic Affairs argues for the reservation of additional space for economic activity. It advocates for a conceptual spatial strategy, rather than just in terms of plain demand led accommodation. There is an institutional turn to active spatial-economic strategy with the idea of a corridor-oriented development of economic activity. The motorway infrastructure is taken as the basis for the determination of the ideal locations of new business parks and distribution activities which runs against the commitments of the official locational policy which is aiming at a concentration of labour intensive economic activities in the direct vicinity of nodes in the public transport system. Again, the spatial strategies are not congruent with the official line of the government spatial planning and erosion to the compact city concept. A similar effort is by the Ministry of Traffic & Transport which argued for a spatial strategy that would take the existing infrastructure—the railway system in particular—as its starting point. Again a deviation from the general spatial plan which determines where the-sectoralinfrastructure was to be, not the other way round.
These modifications presented new policy approaches incongruent to the official planning policy. Despite the fact that neither of these plans had an official legal status, they were often effective in occupying the minds of policy makers and stakeholders instigating and speculating changes.
4. Conclusions
Urban agglomerations all over Europe are growing at the expense of the surrounding landscapes simply because of economic and social demands. There are specific landscape and green space policies like, Green Heart (The Netherlands), Green Belt (Great Britain) Park Region (Germany) etc, targeted for sustainable spatial development. Overall, these policies have controlled the urban sprawl but there has been expansion of built-up land for settlement and transport use within recent decades. These strategies and policies to secure and improve green spaces play an important role because quality of life, the image of the region as well as international competitive capacity are tightly linked with the existence of valuable open green space structures. But in reality there is difference between the regulations and the contradictory, often unsustainable changes in the urban landscape. This was evident from the foregoing analysis with the spatial dynamics reflecting the existing socio-economic framework.
These policies of sustainability tend to be less effective because of the diversity in goals. By reason of this complexity the term “sustainable development” which is often used as an alibi rather than as guidance for strong action. A rational answer to this problem is to concentrate the planning process on the protection of specific regional landscape and address the institutional requirements of sustainability. Landscape is a by-product of human activities and landscape related policies require the active participation of citizens and land users. The concept of sustainable landscape development involves the linking of economic and social dimensions with the requirement of the preservation of green spaces and the consideration of the environment’s carrying capacity. Economics, ecology and social balance should, therefore, be understood as a unity in this context.
In context of the sustainability debate in the Netherlands, the “Compact City” is not an undisputed role model. The landscape planners often suggest Green areas to achieve a sustainable urban form. Green Heart reuses the vocabulary of organism planning, which was developed by the American regionalist L. Mumford during the 1930s [26]. “Organism” city planning was also familiar during the 1950s in Germany and other western European countries. In this period, cities were favourably understood as organism, consisting of blood vessels, lungs, cells and a heart. The promotion for economical development and the efforts for protection of the green space are increasing. The present study finds over the last decades, the Green Heart is under attack from suburbanization of larger and smaller settlements as several political concessions have been made to local development needs. The Green Heart is also affected by the construction of new roads and railway lines. This infrastructure is built for tangential transport of an increasing volume of commuters. Evidences from other spatial policies for preserving green spaces in UK and Germany also faced similar trends.
The spatial policies for preserving green spaces suffer from a dilemma between two contradicting functions of green space in a regional context: to be a separator of urban and rural areas and to be an integrator towards the Regional City of “Green Metropolis”. Protecting green areas during a period of over-production is nowadays a weak argument to restrict suburban development. Conflicts between ecological and socio-economic aspects tend to obstruct the implementation of spatial policy instruments, which frequently ignore the multifunctionality of urban landscapes. The logic of “protection” needs to be integrated with logic of “development”.
Summarizing it may be said, that the main reason for deficits in protecting the Green Heart lay in the fact, that the area in whole is not regarded as a spatial unity. The spatial form of the Green Heart is not derived from landscape qualities, but from a negative urban form. The approach of segregation of urban and rural areas appears irrelevant as it is simply handling the physical dimension of settlements in a static way. It does not consider the dynamics of increasing interactions and flows, which tend to level differences between urban and rural areas towards an urban-rural continuum.
5. Acknowledgements
The authors acknowledge the research grant by ICSSR (India) and NWO (The Netherlands).
REFERENCES
- C. R. Bryant, L. H. Russwurm and A. G. McLellan, “The City’s Countryside: Land and Its Management in the Rural-Urban Fringe,” Longman, London, 1982.
- E. Burgess, “The Growth of the City,” In: R. Park and E. Burgess, Eds., The City, University of Chicago Press, Chicago, 1925, pp. 47-62.
- P. Mann, “An Approach to Urban Sociology,” Routledge, London, 1965.
- M. Pacione, “Urban Geography: A Global Perspective,” Routledge, London, 2001. doi:10.4324/9780203454626
- D. Stanners and P. Bourdeau, “Europe’s Environment: The Dobříš Assessment,” Office for Official Publications of the European Communities, Luxembourg, 1995.
- M. Herold, K. C. Clarke and J. Scepan, “Remote Sensing and Landscape Metrics to Describe Structures and Changes in Urban Land Use,” Environment and Planning A, Vol. 34, No. 8, 2002, pp. 1443-1458. doi:10.1068/a3496
- J. H. Huang, et al., “A Global Comparative Analysis of Urban Form: Applying Spatial Metrics and Remote Sensing,” Landscape and Urban Planning, Vol. 82, No. 4, 2007, pp. 184-197. doi:10.1016/j.landurbplan.2007.02.010
- A. Frenkel and M. Ashkenazi, “Measuring Urban Sprawl: How Can We Deal with It?” Environment and Planning B: Planning and Design, Vol. 35, No. 1, 2008, pp. 56-79. doi:10.1068/b32155
- M. Kasanko, J. I. Barredo, C. Lavalle, N. McCormick, L. Demicheli, V. Sagris, et al., “Are European Cities Becoming Dispersed? A Comparative Analysis of 15 European Urban Areas,” Landscape Urban Plan, Vol. 77, No. 1-2, 2006, pp. 111-130. doi:10.1016/j.landurbplan.2005.02.003
- Y. Tsai, “Quantifying Urban Form: Compactness versus ‘Sprawl’,” Urban Studies, Vol. 42, No. 1, 2005, pp. 141- 161. doi:10.1080/0042098042000309748
- N. B. Grimm, et al., “Global Change and the Ecology of Cities,” Science, Vol. 319, No. 5864, 2008, pp. 756-760. doi:10.1126/science.1150195
- M. Alberti, “The Effects of Urban Patterns on Ecosystem Function,” International Regional Science Review, Vol. 28, No. 2, 2005, pp. 169-192. doi:10.1177/0160017605275160
- Q. Weng and D. Quattrochi, “Urban Remote Sensing,” Taylor & Francis Group, Boca Raton, 2007.
- F. Dieleman and M. Wegener, “Compact City and Urban Sprawl,” Built Environment, Vol. 30, No. 4, 2004, pp. 308-323. doi:10.2148/benv.30.4.308.57151
- M. Jenks, E. Burton and K. Williams, “The Compact City—A Sustainable Urban Form,” E & FN Spon, London, 1996.
- K. Williams, E. Burton and M. Jenks, “Defining Sustainable Urban Form,” In: K. Williams, E. Burton and M. Jenks, Eds., Achieving Sustainable Urban Form, E & FN Spoon, London, 2000, pp. 7-9.
- S. Ryan and M. G. McNally, “Accessibility of Neotraditional Neighborhoods: A Review of Design Concepts, Policies, and Recent Literature,” Transportation Research Part A, Vol. 29, No. 2, 1995, pp. 87-105. doi:10.1016/0965-8564(94)E0008-W
- D. Banister, “Reducing the Need to Travel,” Environment and Planning B, Vol. 24, No. 3, 1997, pp. 437-449. doi:10.1068/b240437
- M. Guérois and D. Pumain, “Built-Up Encroachment and the Urban Field: A Comparison of Forty European Cities,” Environment and Planning A, Vol. 40, No. 9, 2008, pp. 2186-2203. doi:10.1068/a39382
- Jabareen, “Sustainable Urban Forms: Their Typologies, Models, and Concepts,” Journal of Planning Education and Research September, Vol. 6, No. 1, 2006, pp. 38-52
- R. L. Gant, et al., “Land-Use Change in the ‘Edgelands’: Policies and Pressures in London’s Rural-Urban Fringe,” Land Use Policy, Vol. 28, No. 1, 2011, pp. 266-279.
- S. Fazal, “Land Use Dynamics in the London Metropolitan Fringe,” Lambert Academic Publishing, Germany, 2010.
- Siebert, Julia/Steingrube and Wilhelm, “Inszenierte Natur,” In: Institut für Länderkunde Leipzig (IfL), Ed., Nationalatlas Bundesrepublik Deutschland, Bd. 10, Freizeit und Tourismus, Heidelberg und Berlin, 2000, pp. 40-43.
- Gemeinsame Landesplanung Berlin und Brandenburg (Ministerium für Landwirtschaft, Umweltschutz und Raumordnung des Landes Brandenburg/Senatsverwaltung für Stadtentwicklung des Landes Berlin) “Regionalparks in Brandenburg und Berlin,” Potsdam, 2001.
- G. L. Burke, “Greenheart Metropolis. Planning the Western Netherlands,” St. Martin’s Press, New York, 1966.
- M. Luccarelli, “Lewis Mumford and the Ecological Region: The Politics of planning,” The Guilford Press, New York, London, 1995.
NOTES
*Corresponding author.