Advances in Infectious Diseases
Vol.4 No.2(2014), Article
ID:46629,8
pages
DOI:10.4236/aid.2014.42015
Influenza-Related Hospitalizations and Associated Comorbidities in Nebraska: 2007-2011
Guang-Ming Han1,2*, Sandra Gonzalez1,2,3*, Chrispin Chisanga3, Cole Vanicek1,2, K. M. Islam1#
1College of Public Health, University of Nebraska Medical Center, Omaha, USA
2Nebraska Department of Health and Human Services, Lincoln, USA
3University of Nebraska-Lincoln, Lincoln, USA
Email: #kmislam@unmc.edu
Copyright © 2014 by authors and Scientific Research Publishing Inc.
This work is licensed under the Creative Commons Attribution International License (CC BY).
http://creativecommons.org/licenses/by/4.0/


Received 13 March 2014; revised 13 April 2014; accepted 30 April 2014
ABSTRACT
Objective: Influenza afflicts approximately 5% - 20% of the US population annually. Although prevalence statistics are useful, they are insufficient to understand completely influenza on a health care system. This study estimated Nebraska’s annual hospitalization and comorbidity rates due to influenza from 2007 to 2011. Methods: Influenza was defined according to ICD-9-CM primary codes beginning with 487 or 488 in hospital discharge records. The comorbidities of patients with influenza were defined according to ICD-9-CM secondary diagnosis codes. Results: The highest yearly age-adjusted hospitalization rates were 30.6 and 31.1 per 100,000 populations for 2008 and 2009, respectively. In 2008, the highest hospitalization rate was among those aged 65 yrs and older; in 2009, the highest rate was among those younger than 5 yrs. Asthma was the most frequent comorbidity overall and among those younger than 50 yrs. Conversely, hypertension and heart failure were the most frequent comorbidities among those aged 50 yrs and older. Conclusion: These findings provide a better understanding of the influenza burden and may contribute to developing more effective influenza prevention strategies.
Keywords:Influenza, Hospitalization, Comorbidity

1. Introduction
Annually, about 5% to 20% of the US population is infected with influenza and approximately 36,000 individuals die from influenza [1] . In addition, influenza is an important cause of mortality in temperate countries [2] [3] . Seasonality is used as an analytic tool because most influenza infections are not confirmed virologically [4] . The increased capacity for laboratory-confirmed diagnosis of influenza infection on a global level has resulted in an increased recognition of severe influenza-related illnesses in children and adults in developing countries [5] . The most common complications of influenza include acute viral and secondary bacterial pneumonia. These complications are more likely to occur among children younger than 5 years, among those older than 65 years, and among those with concurrent medical conditions such as heart disease, asthma, or chronic bronchitis [6] [7] .
The State of Nebraska’s influenza surveillance system is a cooperative network of multiple systems whose data is considered collectively to create a general picture of influenza activity. Nebraska’s influenza surveillance system comprises the influenza-like illness (ILI) Hospital Admission Survey, influenza laboratory surveillance, the ILI Sentinel Provider Surveillance Network, the Centers for Disease Control and Prevention’s 122 Cities Mortality Reporting System, influenza-associated pediatric mortality, and emergency department syndromic surveillance of ILI [8] [9] .
Typically, the number of influenza cases is low at the onset of the influenza season, in October through December, and peaks between late January and early March. The end of the influenza season is April and is characterized by decreased influenza activity and fewer cases [1] .
Although prevalence statistics are useful, they are insufficient to a complete understanding of the impacts of influenza on Nebraska’s health care system. The actual burden on patients, families, and society is seen in the average annual hospitalization rate and in direct medical expenses due to more serious influenza.
The main objective of this study was to estimate Nebraska’s average annual hospitalization rate and identifying comorbidities due to influenza from 2007 to 2011. Previous studies have reported high numbers of influenza-associated hospitalizations in the United States among the elderly and among children younger than 5 years [10] . Additionally, influenza-associated hospitalizations account for a large proportion of the nation’s total health burden and costs. Improved influenza prevention efforts are needed [10] .
2. Material and Methods
2.1. Study Design
We estimated the yearly hospitalization rate related to influenza between 2007 and 2011 in each of Nebraska’s 21 local health department areas. Also, we reported stratified influenza cases by gender and age group. This descriptive study was conducted by analyzing confirmed diagnostic influenza cases from hospital discharge data (HDD) for inpatients. Medical expenses and comorbidities of patients hospitalized for influenza in Nebraska between 2007 and 2011 were also estimated using HDD for inpatients. This retrospective cross-sectional study represents the first analysis of confirmed influenza cases from HDD for Nebraska. Results of this study will allow a better understanding of the influenza burden in Nebraska and may contribute to the development of more effective prevention strategies.
HDD is collected from acute care hospitals in Nebraska, including inpatient and emergency departments. The HDD includes date of admission, date of discharge, patient age, gender, county of residence, and primary and secondary ICD-9-CM diagnosis codes. This information is reported by hospitals using the Centers for Medicare and Medicaid Uniform Billing Form (UB-04), transmitted electronically to the Nebraska Hospital Information System at the Nebraska Association of Hospitals and Health Systems. Although the HDD includes both emergency department and inpatient data, only inpatient data was analyzed in this study [11] .
2.2. Study Population
This study uses Nebraska HDD on inpatients from 2007 to 2011. The statewide annual hospitalization burden of influenza was expressed using the age-adjusted average annual hospitalization rate due to influenza per 100,000 residents. The flu season was defined as May 1 of one year through April 31 of the following year. Analyzing a full 12 months allowed for a more accurate assessment of annual rates than limiting the analysis to the typical October-through-May flu season, as is common in many surveillance systems. In addition, the number of cases during the H1N1 epidemic in 2009 was larger than expected during the spring [12] . Extending the flu season classification, allowed us to capture and classify data related to novel H1N1 more accurately.
2.3. Influenza Classification
Influenza was defined according ICD-9-CM codes in HDD. General burden due to influenza was characterized by any primary code beginning with 487 or 488, which included all diagnosed cases of influenza regardless of subtype or species and presentation. Avian influenza (A/H5N1) is coded 488.0, and novel swine influenza (A/H1N1) is coded 488.1. These codes were used to assess specific rates related to these novel virus strains. Estimations of the number of persons with influenza were based on the presence of said diagnostic codes in only the primary position. This approach was taken to better characterize the burden of hospitalization directly related to influenza.
2.4. Comorbidity Classification
Comorbidity of patients with influenza was defined according to the ICD-9-CM in the secondary diagnosis positions. The analysis of comorbidities was focused on conditions that have been shown to be associated with influenza. The chronic comorbid illnesses associated with severe influenza analyzed in this study were chronic lung disease (i.e., asthma), chronic cardiac disease (i.e., congestive heart failure), metabolic disease (i.e., diabetes mellitus), and immunosuppressive conditions (i.e., cancer, transplant, immunosuppressive drugs, HIV/ AIDS) [13] [14] .
2.5. Medical Expenses
Total hospital charges included costs in the following categories: general services, ICU/special care, pharmacy, laboratory, radiology, operating room, supplies, and other ancillary services. This variable is included in the HDD.
2.6. Statistical Analyses
The frequency of the average annual hospitalization related to influenza was calculated for each year from 2007 to 2011. The annual crude hospitalization rate was then estimated using US Census Bureau data to determine the total person-years of risk for the population (serving as the denominator). The annual age-adjusted hospitalization rate was estimated using standard US Census Bureau population data for 2000. In addition, we took into account gender, age, time (year), and variables for hospitalization rate estimates. Influenza-related hospitalization medical expenses were estimated with the total charge variable in the HDD. Average medical expenses related to hospitalization due to influenza were estimated and characterized by year. The frequency of common comorbidities was estimated according to ICD-9-CM code in the secondary diagnosis positions in the HDD.
2.7. Geographic Information System (GIS) Analysis
It is important to understand the statewide impact of influenza in Nebraska, such as annual hospitalizations related to influenza and medical expenses of influenza patients due to hospitalization. However, the statewide impact of influenza does not reflect the influenza burden at the local health department level. Nebraska’s 21 local health departments have different geographic characteristics and different economic and political resources. To analyze the relative distribution and burden of influenza in local health departments, we used GIS to provide a graphic description of the distribution of hospitalization due to influenza at the local health department level, and to assess potential disparities. We calculated the annual hospitalization rate and medical costs due to influenza for each local health department. The GIS maps were produced by ArcMap10 (ESRI Inc.). Chlorpleth maps were created to compare differences between rates of influenza hospitalization and influenza-related hospital costs by local health department.
3. Results
3.1. Yearly Hospitalization Numbers and Rates in Nebraska from 2007 to 2011
The yearly influenza hospitalization rates between 2007 and 2011 are shown in Table 1. The highest yearly age-adjusted hospitalization rates observed per 100,000 populations were 30.6 and 31.1 for 2008 and 2009,

Table 1. Yearly hospitalization rates: Nebraska, 2007-2011.
Rates expressed per 100,000 population; age-adjusted rates by using 2000 US Census population estimates.
respectively. Age stratification indicates that the highest frequency of hospitalization in 2008 was observed among those older than 65 years, and the highest hospitalization rate in 2009 was observed among those younger than 5 years.
3.2. Yearly Hospitalization Average Charge and Length of Stay in Nebraska from 2007 to 2011
The highest average rate of hospitalization, greatest average length of stay and the highest average charge were observed in 2009 (Table 2). Our analysis of the number of hospitalized patients due to influenza shows that while only one peak per season was observed during the 2007, 2008, 2010, and 2011 flu seasons, two peaks were observed during the 2009 flu season, one in the spring and one in the fall (Figure 1).
3.3. Cumulative Hospitalization Rate Due to Influenza between 2007 and 2011 for Local Health Departments in Nebraska
The cumulative hospitalization rate due to influenza between 2007 and 2011 for local health departments was also analyzed (Supplementary Figure 1). Hospitalization rates of 26 per 100,000 populations or higher were observed among the Panhandle, North Central, Elkhorn Logan Valley, Southeast, and Southwest Nebraska local health departments. Further studies are needed to understand the differences in cumulative hospitalization rates among local health departments.
3.4. Percentage of Common Comorbidities for Hospitalized Patients with Influenza by Age Group in Nebraska from 2007 to 2011
The percentage of common comorbidities for patients hospitalized with influenza is shown by year in Table 3. Asthma was observed with higher frequency than other comorbidities for all years. In addition, age stratification showed that asthma was observed more frequently than other comorbidities among the younger than-5-years, 5-19-years, and 20-49-years age groups. Among the 50-64-years and 65-years-and-older age groups, hypertension and heart failure, respectively, were observed with the highest frequency. Similar results were observed for patients hospitalized with H1N1 (Supplementary Table 1). Asthma and hypertension were also the most common comorbidities by year (Supplementary Table 2).
Table 2. Yearly hospitalization average charge and length of stay: Nebraska, 2007-2011.
95% CI: 95% Confidence intervals.
Table 3. Percentage of common comorbidities for hospitalized patients with influenza by age group.
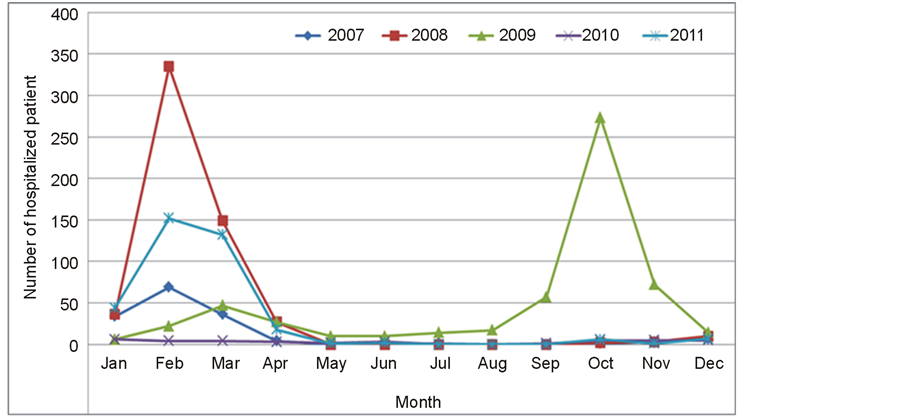
Figure 1. Trend in hospitalization for influenza: Nebraska, January 2007 to December 2011.
4. Discussion
In this study, we estimated average annual hospitalization rate and direct medical expenses due to influenza in Nebraska from 2007 to 2011. While characterizing the prevalence of influenza according to influenza surveillance is useful, it may be insufficient to understand certain statewide impacts of influenza on the health care system in Nebraska. The average annual hospitalization rate and direct medical expenses due to more serious influenza in the population represent the real burden on patients, families, and society.
Table 1 shows the yearly influenza hospitalization rates in Nebraska between 2007 and 2011. The high hospitalization rate observed among those older than 65 years could be due to a higher frequency of comorbidities in this age group (Table 3). On the other hand, the highest hospitalization rate in 2009 was observed among those younger than 5 years. The high hospitalization rate among children younger than 5 years could be due to the high percentage of asthma comorbidities in children observed in 2009 (Table 1 and Supplementary Table 2). Moreover, because the 2009 H1N1 evolved from the 1918 pandemic influenza virus [12] , the lower hospitalization rate among those 65 years and older might be due to cross-reactive immunity caused by prior infections with strains antigenically related to H1N1.
Table 2 shows the average hospitalization charge and average length of stay between 2007 and 2011. The highest average hospitalization rate and length of stay was observed for 2009. This high hospitalization burden might be due to the earlier start observed for the 2009 flu season. The 2009 flu season also had two peaks, one in the spring and one on the fall (Figure 1). These observations are consistent with previous reports on the 2009 influenza pandemic, which reported two distinct waves, one in the spring and one in the fall, and lower levels of disease activity between the two waves [12] .
Asthma was the second most frequent comorbidity in these two age groups. These results are consistent with previous studies reporting that one-third of the patients in the United States hospitalized with influenza had asthma [15] . In addition, a recent study by McKenna et al. reported an overlap in asthma and chronic obstructive pulmonary disease (COPD) in over 20% of the 50-64-years and 65-years-and-older age groups [15] . However, because these patients are not regularly monitored by spirometer, it is difficult to determine whether they had asthma, COPD, or both asthma and COPD [16] .
There are limitations concerning the use of the Nebraska HDD in this study. First, the records are reported as estimates rather than census figures because the number of records reported by acute care hospitals to the Nebraska Hospital Information System is lower than the number of records the same hospitals report to the Nebraska Department of Health and Human Services annually. Additionally, previous studies evaluating the use of ICD-9 codes have found a potential significant underestimation of hospitalization due to influenza when comparing hospital discharge codes to laboratory confirmation of influenza [17] . Including a wider range of ICD-9 codes may increase sensitivity in capturing hospitalizations related to influenza, but would likely lead to a high degree of false classification. Further studies are needed to evaluate the predictive value of ICD-9 coding groups in classifying influenza hospitalizations in Nebraska. Finally, Nebraska residents receiving care outside of Nebraska are not included in the HDD. Hence, particular attention should be used when comparing hospitalization rates geographically, since residents of some counties may be more likely than residents of other counties to receive their medical care out of state [11] .
5. Conclusion
Because this is the first time that Nebraska HDD has been used to analyze confirmed influenza cases, results from this study can be used to establish a baseline for monitoring the general trends of severe cases of influenza in the state. In addition, these findings may provide a better understanding of the influenza burden in Nebraska. Moreover, results of this study may be useful in the improvement and development of influenza prevention strategies.
Acknowledgements
We acknowledge the contribution of the Nebraska Department of Health and Human Services Office of Epidemiology, and in-kind time from faculty and students. There was no financial support for this project, and the authors report no financial conflicts. We would like to acknowledge Robin Williams for her contribution to this study and her role in strengthening influenza surveillance in Nebraska.
Conflict of Interest and Sources of Funding
There was no financial or other form of conflicts of interest to any of the authors.
References
- Division of Public Health (2009) Nebraska Department of Health and Human Services. Nebraska Influenza Prevention Fact Sheet. Issue 4, May 2009. http://dhhs.ne.gov/publichealth/Documents/Flu-fact-sheet.pdf
- Reichert, T.A., Simonsen, L., Sharma, A., Pardo, S.A., Fedson, D.S. and Miller, M.A. (2004) Influenza and the Winter Increase in Mortality in the United States. American Journal of Epidemiology, 5, 492-502. http://dx.doi.org/10.1093/aje/kwh227
- Dushoff, J., Plotkin, J.B., Viboud, C., Earn, D.J.D. and Simonsen, L. (2006) Mortality Due to Influenza in the United States an Annualized Regression Approach Using Multiple-Cause Mortality Data. American Journal of Epidemiology, 2, 181-187.
- Monto, A.S. (2004) Global Burden of Influenza: What We Know and What We Need to Know. International Congress Series, 1263, 3-11. http://dx.doi.org/10.1016/j.ics.2004.02.049
- Nair, H., Brooks, W.A., Katz, M., Roca, A., Berkley, J.A. and Madhi, S.A. (2011) Global Burden of Respiratory Infections Due to seasonal Influenza in Young Children: A Systematic Review and Meta-Analysis. Lancet, 9807, 1917-1930. http://dx.doi.org/10.1016/S0140-6736(11)61051-9
- Barker, W.H. (1986) Excess Pneumonia and Influenza Associated Hospitalization during Influenza Epidemics in the United States, 1970-78. American Journal of Public Health, 7, 761- 765. http://dx.doi.org/10.2105/AJPH.76.7.761
- Glezen, W.P., Greenberg, S.B., Atmar, R.L., Piedra, P.A. and Couch, R.B. (2000) Impact of Respiratory Virus Infections on Persons with Chronic Underlying Conditions. JAMA, 4, 499-505. http://dx.doi.org/10.2105/AJPH.76.7.761
- Division of Public Health (2007) Nebraska Department of Health and Human Services. Nebraska Influenza Epidemiology Report. 2004-2007. December 2007. http://dhhs.ne.gov/publichealth/Documents/FluReport07.pdf
- Department of Health and Human Services (2014) Division of Public Health. Weekly Influenza Report 2013-14 Influenza Season, Week 17. 2 May 2014. http://dhhs.ne.gov/publichealth/documents/report.pdf
- Thompson, W.W., Shay, D.K., Weintraub, E., Brammer, L., Bridges, C.B. and Cox, N.J. (2004) Influenza-Associated Hospitalizations in the United States. JAMA, 11, 1333-1340. http://dx.doi.org/10.1001/jama.292.11.1333
- Nebraska Health and Human Services System (2004) Impact of Cardiovascular Disease in Nebraska. Lincoln, NE: Nebraska Health and Human Services System, Department of Health and Human Services, Office of Disease Prevention and Health Promotion.
- Jhung, M.A., Swerdlow, D., Olsen, S.J., Jernigan, D., Biggerstaff, M. and Kamimoto, L. (2011) Epidemiology of 2009 Pandemic Influenza A (H1N1) in the United States. Clinical Infectious Diseases, 52, S13-S26. http://dx.doi.org/10.1093/cid/ciq008
- Zarychanski, R., Stuart, T.L., Kumar, A., Doucette, S., Elliott, L., Kettner, J. and Plummer, F. (2010) Correlates of Severe Disease in Patients with 2009 Pandemic Influenza (H1N1) Virus Infection. Canadian Medical Association Journal, 3, 257-264. http://dx.doi.org/10.1503/cmaj.091884
- Louie, J.K., Acosta, M., Winter, K., Jean, C., Gavali, S. and Schechter, R. (2009) Factors Associated with Death or Hospitalization Due to Pandemic 2009 Influenza A(H1N1) Infection in California. JAMA, 17, 1896-1902. http://dx.doi.org/10.1001/jama.2009.1583
- McKenna, J.J., Bramley, A.M., Skarbinski, J., Fry, A.M., Finelli, L. and Jain, S. (2013) Asthma in Patients Hospitalized with Pandemic Influenza A(H1N1)pdm09 Virus Infection-United States, 2009. BMC Infectious Diseases, 57, 1471-2334.
- Bolton, C.E., Ionescu, A.A., Edwards, P.H., Faulkner, T.A., Edwards, S.M. and Shale, D.J. (2005) Attaining a Correct Diagnosis of COPD in General Practice. Respiratory Medicine, 4, 493-500. http://dx.doi.org/10.1016/j.rmed.2004.09.015
- Keren, R., Wheeler, A., Coffin, S.E., Zaoutis, T., Hodinka, R. and Heydon, K. (2006) ICD-9 Codes for Identifying Influenza Hospitalizations in Children. Emerging Infectious Diseases, 10, 1603-1604. http://dx.doi.org/10.1016/j.rmed.2004.09.015
Appendix
Supplemental
Table 1. Percentage of common comorbidities for hospitalization patients with H1N1 by age group.
Supplemental
Table 2. Percentage of common comorbidities for hospitalization patients with influenza by year.

NOTES

*These authors contributed equally to the manuscript.
#Corresponding author.