World Journal of Cardiovascular Diseases
Vol.07 No.04(2017), Article ID:75935,13 pages
10.4236/wjcd.2017.74013
Assessment of Arterial Stiffening and Vascular Calcifications in End?Stage Renal Disease Patients
Mahmoud Kamal Elsamman1, Mohamed Abdel Wahab Ezzat1, Medhat Ibraheem Mohammad2, Raghda Gamal Mostafa1, Ali Taha Ali Hassan1
1Internal Medicine Department, Sohag Faculty of Medicine, Sohag University, Sohag, Egypt
2Diagnostic Radiology Department, Sohag Faculty of Medicine, Sohag University, Sohag, Egypt

Copyright © 2017 by authors and Scientific Research Publishing Inc.
This work is licensed under the Creative Commons Attribution International License (CC BY 4.0).
http://creativecommons.org/licenses/by/4.0/


Received: March 1, 2017; Accepted: April 27, 2017; Published: April 30, 2017
ABSTRACT
Background and Objective: Epidemiological and clinical studies have shown that vascular calcification and arterial vascular stiffness are associated with all-cause and cardiovascular (CV) mortality in the general populations and end-stage renal disease (ESRD) patients. The objective of this study was the assessment of arterial stiffness and vascular calcification in ESRD patients in Sohag University Hospital. Patients and Methods: In this cross-sectional descriptive study, 100 patients with ESRD (63 males and 37 females) were included. The patients were on regular hemodialysis (HD) for 65.18 ± 50.25 months. Arterial stiffness was measured by brachial pulse pressure (PP). A simple vascular calcification score (SVCS) based on plain radiographic films of pelvis and hands was used for assessment of vascular calcification. The patients undergoing clinical evaluation and serum calcium, phosphorus and parathyroid hormone (PTH) were obtained. Results: PP > 70 mmHg was observed in 24 patients (24%) and vascular calcifications were detected in 50 patients (50%). SVCS ≥ 3 was observed in 36 patients (36%) and 10 patients (10%) had both SVCS ≥ 3 and PP > 70 mmHg. PP > 70 was significantly associated with presence of vascular disease (odds ratio; 5, 95% CI = 1.56 - 16.01; P = 0.007). In multivariate analysis, PP > 70 was independently associated with elevated systolic blood pressure (odds ratio; 1.34, 95% CI = 1.11 - 1.6; P = 0.002) and serum PTH (odds ratio; 1.004, 95% CI = 1 - 1.008; P = 0.03). SVCS ≥ 3 was association with age (odds ratio; 1.05, 95% CI = 1.02 - 1.09; P = 0.003) and presence of vascular disease (odds ratio; 3.19, 95% CI = 1.3 - 7.85; P = 0.01). Elevated systolic blood pressure was independently associated with SVCS ≥ 3 (odds ratio; 1.08, 95% CI = 1.03 - 1.14; P = 0.002). Conclusion: Arterial stiffness and vascular calcifications are common in patients with ESRD on regular hemodialysis. PP and SVCS are simple and inexpensive methods in assessment of vascular calcifications and arterial stiffness in hemodialysis patients. PP and SVCS may provide important information that may guide the management of these patients.
Keywords:
Arterial Stiffness, Vascular Calcification, Pulse Pressure, Haemodialysis

1. Introduction
Vascular calcification (VC) and arterial stiffness are associated with all-cause and cardiovascular (CV) mortality in the general and chronic kidney disease (CKD) populations, and screening methods to assess the degree of both could potentially be worthwhile in general clinical practice given the high prevalence and functional significance of these structural changes [1] [2] [3] . Arterial stiffness is an alteration of the arterial wall properties with multiple causes, some of which are old age, diabetes and hypertension. All these features of alteration of the arterial wall properties are highly prevalent in dialysis patients, and arterial stiffness is a common finding in this population. End-stage renal disease (ESRD) patients have stiffer arteries than age and blood pressure matching non uraemic subject [4] [5] .
The evaluation of the relationship between the radiological vascular calcification assessment and the measurement of vascular stiffness by pulse pressure (PP) is one of the KDIGO imaging Work Group research questions [6] . Vascular calcifications can be evaluated by ultrasonography and by plain X-ray through measurement of the simple vascular calcification score (SVCS) [7] [8] . Higher SVCS and PP were associated with higher mortality in this population. Simple and inexpensive methods are required to detect cardiovascular disease and to provide information that may be relevant for guiding therapeutic intervention in dialysis patients.
Vascular calcification rarely regresses the once developed, and therefore, ma- nagement involves prevention or diminishing the progression of existing VC. Determination of patients at the higher risk of CV morbidity and mortality may lead to alteration of medications to limit exogenous calcium exposure, stricter control of blood pressure and abnormalities in mineral metabolism, and changes in dialysis prescriptions (duration, frequency and dialysate), although there is a lack of current evidences to establish the optimal management for the problems of VC and arterial stiffness.
The present study was aiming at assessing vascular calcification by simple vascular calcification score based on plain radiographic films, and measurement of vascular stiffness by pulse pressure among patients with end-stage renal disease in the dialysis unit in Sohag University Hospital.
2. Patients and Methods
The study was conducted in the dialysis unit in Sohag University Hospital which included 250 patients on regular hemodialysis (HD). One hundred patients on regular HD, who fulfilled the inclusions criteria and accepted participation in this study, were included. The inclusions criteria included age > 18 years, regular hemodialysis for at least 12 months, and no previous history of parathyroidectomy. The included patients represented 40% of the patients on regular HD in the dialysis unit. Written informed consent was obtained from each patient and the study was approved from the ethic committee of our university. The patients underwent clinical evaluation including history taking, physical examination and measurement of body mass index (BMI) and measurement of the oral intake of calcium and calcitriol. At baseline, diagnosis of vascular disease was based on a query answered by the attending physicians, concerning previous clinical manifestations and test results, according to the usual standard of care.
2.1. Biochemical Analysis
The predialysis serum calcium (Ca) and phosphorous (P) levels in mg/dl within 6 months period preceding the vascular calcification score evaluation were obtained. Serum parathormone (PTH) level (pg/ml) was measured by a first generation immunochemiluminometric assay within the same period.
2.2. Arterial Stiffness and Pulse Pressure
The pulse pressure is the difference between systolic and diastolic pressures. The brachial pulse pressure was measured once using a standard mercury sphygmomanometer with a suitable cuff adapted to arm circumference. The measurements were obtained before haemodialysis and in the day of the blood chemistry measurement.
PP was calculated by the formula: PP = SBP − DBP; (SBP; systolic blood pressure, DBP; diastolic blood pressure). According to the results, the patients were divided into two groups; Group A included patients with PP ≤ 70 mmHg and Group B included patients with PP > 70 mmHg.
2.3. Vascular Calcifications and Simple Vascular Calcification Score
Vascular calcification was evaluated in all patients during a 6 month period and marked the beginning of the study for each patient by using a simple vascular calcification score settled by Andragao T. et al. (2004). SVCC was evaluated using plain radiographic films of pelvis and hands in the department of diagnostic radiology in Sohag University Hospital. The pelvis radiographic films were divided into four sections by two imaginary lines: a horizontal line over the upper limit of both femoral heads and a median vertical line over the vertebral column. The films of the hands were divided, for each hand, by a horizontal line over the upper limit of the metacarpal bones. The presence of linear calcifications in each section was counted as 1 and its absence as 0. The final score was the sum of all the sections, ranging from 0 to 8 [8] . According to this score, the patients in our study were divided into two groups; Group I included patients with SVCS < 3 and Group II included patients with SVCS ≥ 3.
Vascular calcifications were evaluated in muscular arteries: iliac, femoral, ra- dial and digital. Pelvis films evaluated iliac and femoral arteries; hand films evaluated radial and digital arteries. The analysis of all the radiographic films was performed by one experienced radiologist blinded to patient information. Only linear calcifications, with or without patchy calcifications, were considered for the final calcification score, because they outline the vessel wall and have undoubtedly vascular localization.
3. Statistical Analysis
Data was analyzed using STATA intercooled version 12.1. Quantitative data was represented as mean, standard deviation, median and range. Data was analyzed using student t-test to compare means of two groups. When the data was not normally distributed, Mann-Whitney test was used. Qualitative data was presented as number and percentage and compared using either Chi square test or fisher exact test. Univariate and multivariate logistic regression were used to calculate the odds ratios. P value was considered significant if it was less than 0.05.
4. Results
4.1. Clinical Characteristics and Laboratory Data of the Patients
The study included one hundred patients 63 males and 37 females with a mean age of 53.15 ±13.86 years and mean hemodialysis duration of 65.18 ± 50.25 months. 5 patients (5%) were diabetic. 54 (54%) patients were receiving anti- hypertensive treatment. 58 (58%) patients were previously diagnosed to have vascular disease (coronary artery disease and/or cerebral vascular disease and/or peripheral arterial disease). The mean systolic pressure of the patients was 129.2 ± 25.88 mmHg (ranged from 70 - 170 mmHg) and the mean diastolic blood pressure was 82.7 ± 13.92 mmHg (ranged from 50 - 110 mmHg). The mean dry weight of the patients was 67.77 ± 14.46 kg (ranged from 42 - 110 kg) and the mean body mass index was 24.45 ± 4.59 kg/m2 (ranged from16.4 - 36.3 kg/m2). The mean oral calcium carbonate intake and calcitriol doses (oral or intravenous calcitriol) received by these patients were 1.62 ± 0.55 g/day [ranged from 0.5 - 3 g/day] and 1.04 ± 0.42 μg/week [ranged from 0.5 - 2 μg/week] respectively. No patients received sevelamer or cinacalcet at the time of the study. The mean serum Ca level of the patients was 9.49 ± 2.70 mg/dl, serum P level 6.39 ± 1.98 mg/dl and serum PTH level 326.26 ± 311.39 pg/ml. The clinical characteristics and laboratory data of the patients are shown in Table 1.
4.2. Clinical Characteristics of the Patients According to Pulse Pressure
Our study showed that PP ≤ 70 mmHg were observed in 76 patients (76%) who represented patients in Group A, while PP > 70 mmHg were observed in 24 patients (24%) who represented patients in Group B. Comparison of the two

Table 1. Clinical characteristics and laboratory data of the studied patients.
*Continuous variable were presented as mean ± SD, categorical variable were presented as number and percentage. Ca; calcium, P; phosphorous, PTH; parathyroid hormone.
groups showed that patients in Group B had elevated systolic blood pressure than patients in Group A (157.5 ± 9.44 vs. 120.26 ± 22.80 mmHg respectively) and the difference was statistically significant (P < 0.0001). Diastolic blood pressure showed no significant differences between the two groups. Moreover, we found that the patients with history of hypertension were more in Group B than in Group A (23 patients (95.8%) vs. 31 patients (40.7%)) respectively and the difference was statistically significant (P < 0.0001). Presence of vascular disease was more in Group B than in Group A; 20 patients (83.3%) in Group B vs. 38 patients (50%) in Group A and the difference was statistically significant (P = 0.004). We found no significant differences between the two groups regarding other clinical parameters including age, gender, duration of hemodialysis, presence of diabetes and measurement of BMI (Table 2).
When we compared the two groups in regard the calcium carbonate and calcitriol doses, we found that the patients received calcitriol and calcium carbonate by slightly higher doses in Group A than in Group B (1.19 ± 0.43 ug/week vs. 1.08 ± 0.38 ug/week and 1.63 ± 0.57 g/day vs. 1.58 ± 0.46 g/day respectively). However the differences were not statistical significant (P = 0.52 and P = 0.71 respectively). Our result revealed that serum level of PTH was significantly higher in Group B than in Group A (466.58 ± 337.96 vs. 281.95 ± 290.99 pg/dl respectively and P = 0.01). However, we found no significant difference between Group B and group A regarding serum Ca and serum P (9.96 ± 3.76 vs. 9.33 ± 2.29 and 6.51 ± 2.07 mg/dl vs. 6.35 ± 1.96 mg/dl respectively; P = 0.33 and P = 0.65 respectively) (Table 2).
Table 2. Clinical characteristics of the patients according to pulse pressure.
*Continuous variable were presented as mean ± SD, categorical variable were presented as number. PP; pulse pressure in mmHg, Ca; calcium, P; phosphorous, PTH; parathyroid hormone.
4.3. Univariate and Multivariate Analysis of Factors Associated with PP > 70
In univariate analysis, we found that PP > 70 was significantly associated with the presence of vascular disease (odds ratio; 5, 95% CI = 1.56 - 16.01; P = 0.007) and elevated systolic blood pressure (odds ratio; 1.18, 95% CI = 1.08 - 1.28; P < 0.0001). In addition, there was association between elevated PTH level and higher pulse pressure (odds ratio; 1.002, 95% CI = 1.0002 - 1.003; P = 0.02). There was no association between PP > 70 with other compared variables. In multivariate analysis, higher pulse pressure was independently associated with elevated systolic blood pressure (odds ratio; 1.34, 95% CI = 1.11 - 1.60; P = 0.002) and serum PTH (odds ratio; 1.004, 95% CI = 1.000 - 1.008; P = 0.03) (Table 3).
4.4. Clinical Characteristics of the Patients According to Calcification Score
Our study revealed that vascular calcification was detected in 50 patients (50%). 64 (64%) patients had SVCS < 3 (Group I) and 36 (36%) patients had SVCS ≥ 3 (Group II). 10 (10%) of the patients had both SVCS ≥ 3 and PP > 70 mmHg.
Patients in Group ΙΙ had older age than patients in Group Ι (58.86 ± 14.97 vs. 49.94 ± 12.19 years respectively with P = 0.002). Comparison of the two groups showed that the patients with hypertension were more in Group II than in Group I (27 patients (75%) vs. 27 patients (42.19%) respectively) and the difference was statistically significant P = 0.002. Moreover, we found that patients in
Table 3. Univariate and multivariate analysis of factors associated with pulse pressure > 70.
CI; confidence interval, Ca; calcium, P; phosphorous, PTH; parathyroid hormone, SVCS; simple vascular calcification score.
Group II had elevated systolic blood pressure than patients in Group I (139.72 ± 23.60 vs. 123.28 ± 25.38 mmHg respectively) and the difference was statistically significant (P = 0.002). There were no significant differences between the two groups regarding diastolic blood pressure. Presence of vascular disease was more in Group II than in Group I; 27 patients (75%) in Group II vs. 31 patients (48.4%) in Group I and difference was statistically significant (P = 0.01). We found no significant differences between the two groups regarding other clinical parameters including gender, duration of hemodialysis, presence of diabetes and BMI (Table 4). Our result revealed that serum level of PTH was higher in Group ΙΙ than in Group Ι. However, it was spastically not significant (343.75 ± 382.38 vs. 316.42 ± 266.21 respectively; P = 0.7). Moreover, there was no statistically significant difference between the Group I and Group II regarding Ca and calcitriol intake or between the two groups regarding serum Ca and serum P level (Table 4).
4.5. Univariate and Multivariate Analysis of Factors Associated with SVCS ≥ 3
In univariate analysis, we found that simple vascular calcification score ≥ 3 was association with age (Odds ratio; 1.05, 95% CI = 1.02 - 1.09; P = 0.003), presence of vascular disease (Odds ratio; 3.19, 95% CI = 1.30 - 7.85; P = 0.01) and elevated systolic blood pressure (Odds ratio; 1.03, 95% CI = 1.01 - 1.05; P = 0.003). There was no association between SVCS ≥ 3 and other tested parameters including
Table 4. Clinical characteristics of the patients according to calcification score.
*Continuous variable were presented as Mean ± SD, categorical variable were presented as number. SVCS; simple vascular calcification score, Ca; calcium, P; phosphorous, PTH; parathyroid hormone.
gender, DM, HD duration and serum PTH. In multivariate analysis elevated systolic blood pressure was independently associated with SVCS ≥ 3 (Odds ratio; 1.08 and 95% CI = 1.03 - 1.14; P = 0.002). Other tested parameters showed lack of independent association with SVCS ≥ 3 (Table 5).
4.6. Distribution of Vascular Calcification
The radiographic films in our study showed that there were 80% calcifications of iliac arteries, 15% calcifications of femoral arteries and 5% vascular calcification in radiograph of the hands. Examples of vascular calcification of the studied patients were presented in Figure 1 and Figure 2.
5. Discussion
Vascular calcifications in hemodialysis patients represent one of the factors contributing to the extremely high cardiovascular mortality for hemodialysis patients when compared with the general population. Vascular calcifications in those patients have already been related to arterial stiffness, cardiovascular disease and cardiovascular mortality [7] [9] . Diagnosis of vascular calcification is usually made with very expensive and highly technical devices like electron beam computed tomography or multislice computed tomography [10] . The use of simple and inexpensive methods such as the evaluation of PP or the assessment of the SVCS with plain X-ray has been suggested in the recent KDOQI clinical practice guidelines not for bone disease evaluation but for vascular calci-
Table 5. Univariate analysis and multivariate analysis of factors associated with SVCS ≥ 3.
SVCS; simple vascular calcification score, CI; confidence interval, Ca; calcium, P; phosphorous, PTH; parathyroid hormone.
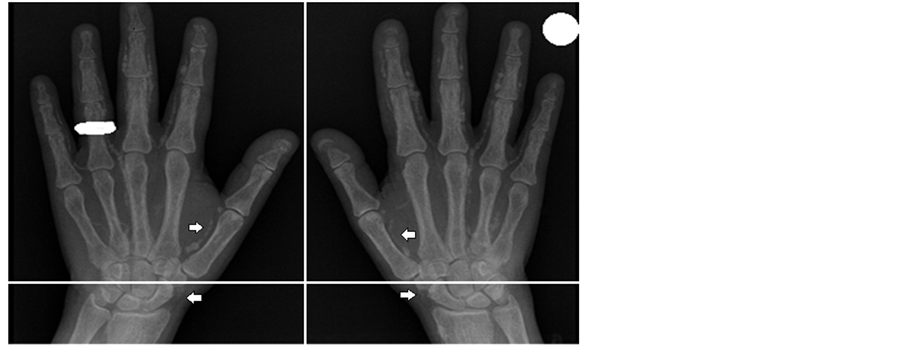
Figure 1. Bilateral anteroposterior (AP) radiographic views of the hands of a 50-year-old women receiving hemodialysis. Note the calcification of the radial and digital arteries (arrows). Simple vascular calcification score of the hands example is 4.
fication assessment [11] .
Our study revealed that arterial stiffness assessment using PP is common among our studied patients on hemodialysis. There was significant association in multivariate analysis between higher PP and elevated systolic blood pressure. However, diastolic BP values showed no significant differences between patients in Group A and patients in Group B. These results are in agreement with results reported by Tozawa M et al. who demonstrated that the higher systolic blood
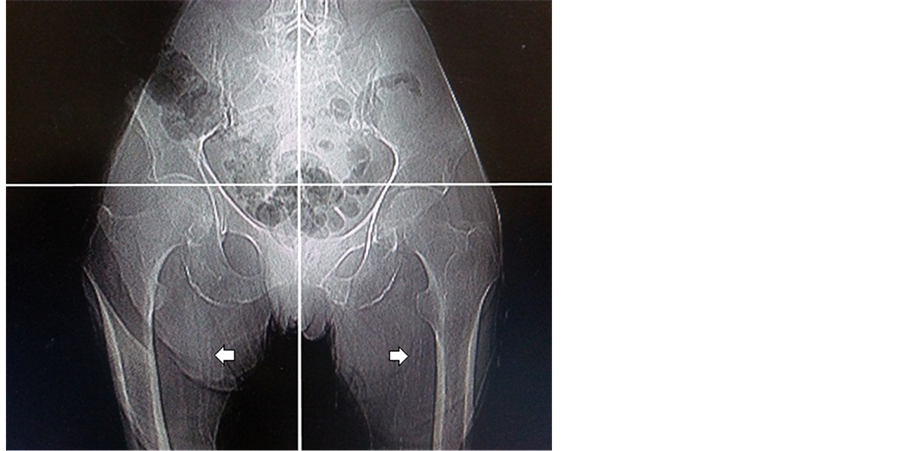
Figure 2. Pelvic radiography shows calcification of the femoral arteries. Simple vascular calcification score of the pelvis example is 2.
BP, lower diastolic BP and wider pulse pressure all confer greater CV and all- cause mortality risk [12] . Klassen PS et al. observed that the changes of arterial wall properties with age are associated with systolic BP increase and diastolic BP decrease. Increased Pulse pressure has been established as a cardiovascular disease risk factor in hemodialysis patients [13] . Presence of vascular disease was detected in 58 patients in our study and higher pulse pressure was associated with the presence of vascular disease in univariate analysis but not in multivariate analysis. London GM et al. observed that increased arterial stiffness could contribute to high pulse pressure [14] . Adragao T et al. found that PP was an independent predictor of peripheral arterial disease and significantly associated with cardiovascular morbidity and mortality in multivariate analysis in hemodialysis patients. And at baseline, clinical vascular disease was diagnosed in 36 patients (29%) and at the end of the follow-up vascular disease was detected in 61 patients (50%) [8] .
Univariate and multivariate analysis in our study showed that serum PTH was independently associated with higher PP while no association was detected with the higher PP and serum Ca or with serum P level. Our result was in agreement with that reported by Moe S. M. et al. and Blacher J. et al. which demonstrated that pulse pressure was independent of PTH values [15] [16] . However, they evaluated serum PTH level three evaluations per patient while in our study we evaluated serum PTH level once.
In our study, we found that higher pulse pressure was not correlated with hemodialysis duration and was not associated with age, sex, diabetes and BMI. Adragao T et al. demonstrated that PP was associated with diabetes and correlated with age [8] [17] . This could be explained by the differences in the number of studied population and the methods for the measurement of PP. Adragao T. et al. included 123 chronic hemodialysis patients with mean age 62.9 years and 20% were diabetic [8] . While our study included 100 patients with mean age 53.1 years and 5% were diabetic. We used pulse pressure only in the assessment of the arterial stiffness while other more reliable method can be used as evaluation of arterial stiffness by PWV by Adragao T. et al. who evaluated PWV twice, at baseline, 24 h after a HD session, using a non-invasive automated device, Complior [17] . In multivariate analysis, we found no correlation between higher pulse pressure and vascular calcification score. Adragao T. et al. reported that in all patients, using linear regression with the enter method and adjusting for multiple factors a higher vascular calcification score was directly associated with PP [17] .
In the present study, there was significant differences between higher and lower calcification score patients with regards to age, elevated BP and presence of vascular disease. And there was no significant difference between higher and lower score patients regarding gender, duration of dialysis and presence of DM. Elevated systolic BP was independently associated with vascular calcification while this independent association was not detected with age, gender, HD duration, and DM. Adragao T. et al. and Guerin A. P. et al. reported presence of significant differences between higher score and lower score patients with regards to age and HD duration [7] [8] . However, Guerin A. P. et al. reported no significant difference regarding to gender [7] . Adragao T. et al. reported significant difference regarding to DM, male sex and mean arterial pressure and these factor in addition to age were independently associated with vascular calcification [8] .
In the current study, vascular calcification score was not correlated with PTH values. This has already been demonstrated in other studies [7] [18] . Hyperphosphataemia and high calcium phosphate product are predictors of mortality in HD patients [19] . In our study, there was no correlation between calcium or phosphorus levels and vascular calcification. Andragao T. el al. reported that there was some evidence for a relationship between calcium or phosphorus levels and vascular disease: phosphorus levels were correlated with coronary artery disease and calcium levels were correlated with peripheral arterial disease. The final vascular calcification score was not correlated with calcium, phosphorus or iPTH levels, but calcium levels were correlated with the presence of iliac calcifications [8] . They showed that PTH levels were overestimated with the common intact parathormone (iPTH) assays because they detect not only PTH, but also evaluate C terminal fragments, which can have inhibitory activity. Similarly, Gue’rin et al. did not find any association between a semi-quantitative vascular calcification score evaluated by B-mode ultrasonography and calcium, phospho- rus and iPTH levels [7] . London et al. found a link between low bone turnover and VC with a study showing that a high arterial calcification score was associated with bone histomorphometry suggestive of low bone activity and adynamic bone disease, indicating that over-suppression of PTH may also influence the development of VC [20] . Therefore, both high and low PTH levels are associated with CV events and mortality and vascular calcification.
The present study has some limitations. Firstly, there were a relatively small number of patients conducted in a single institution. Including patients from other institutions could have a positive impact on the results. However, adding patients from other dialysis units has some socioeconomic difficulties and needs a complicated administrative process. Secondly, another limitation of this study was a selection bias in the subjects. All patients were ESRD on hemodialysis for 12 months or more, 54% had history of hypertension and 58% were previously diagnosed to have vascular disease. So, the result of this study might be limited to apply for subjects with less advances chronic renal diseases and in those without hypertension or clinical evidence of vascular diseases. Thirdly, we did not compare assessment of vascular calcification and arterial stiffness by using SVCS and PP with other imaging modalities such as electron beam computed tomography, B-mode ultrasonography and PWV with Complior due to high cost of these investigations. Fourthly, pulse pressure was evaluated once a month during the same 6 months period and the serum levels of Ca, P and PTH were measured once due to high cost of these investigations. Finally, vascular calcification score is not quantitative and therefore is not adequate for accurately assessing the progression of calcifications, as opposed to the scores evaluated by electron beam computed tomography. Further larger prospective studies were needed to determine the optimal methods for assessment of vascular diseases in ESRD patients.
6. Conclusion
In conclusion, arterial stiffness and vascular calcifications are common in patients with ESRD on regular hemodialysis. PP and SVCS are simple and inexpensive methods for assessment of vascular calcifications and arterial stiffness in hemodialysis patients. Therefore, they can be used to detect the risk of cardiovascular disease and to provide important information that may guide the manage- ment of hemodialysis patients.
Cite this paper
Elsamman, M.K., Ezzat, M.A.W., Mohammad, M.I., Mostafa, R.G. and Hassan, A.T.A. (2017) Assessment of Arterial Stiffening and Vascular Calcifications in End-Stage Renal Disease Patients. World Journal of Cardiovascular Diseases, 7, 131-143. https://doi.org/10.4236/wjcd.2017.74013
References
- 1. Raine, A.E.G., Margreiter, R., Brunner, F.P., et al. (1992) Report on Management of Renal Failure in Europe, XXII, 1991. Nephrology Dialysis Transplantation, 7, 7-35.
- 2. Lindner, A., Charra, B., Sherrard, D.J., et al. (1974) Accelerated Atherosclerosis in Prolonged Maintenance Hemodialysis. The New England Journal of Medicine, 290, 697-701.
https://doi.org/10.1056/NEJM197403282901301 - 3. McIntyre, C.W. (2006) Is It Practical to Screen Dialysis Patients for Vascular Calcification. Nephrology Dialysis Transplantation, 21, 251-254.
https://doi.org/10.1093/ndt/gfi227 - 4. London, G.M., Guérin, A.P., Marchais, S.J., et al. (1996) Cardiac and Arterial Interactions in End-Stage Renal Disease. Kidney International, 50, 600-608.
https://doi.org/10.1038/ki.1996.355 - 5. London, G.M., Marchais, S.J., Safar, M.E., et al. (1990) Aortic and Large Artery Compliance in End-Stage Renal Failure. Kidney International, 37, 137-142.
https://doi.org/10.1038/ki.1990.19 - 6. Moe, S., Drüeke, T., Cunningham, J., et al. (2006) Kidney Disease: Improving Global Outcomes (KDIGO). Definition, Evaluation, and Classification of Renal Osteodystrophy: A Position Statement from Kidney Disease: Improving Global Outcomes (KDIGO). Kidney International, 69, 1945-1953.
https://doi.org/10.1038/sj.ki.5000414 - 7. Guérin, A.P., London, G.M., Marchais, S.J., et al. (2000) Arterial Stiffening and Vascular Calcifications in End-Stage Renal Disease. Nephrology Dialysis Transplantation, 15, 1014-1021.
https://doi.org/10.1093/ndt/15.7.1014 - 8. Adragao, T., Pires, A., Lucas, C., et al. (2004) A Simple Vascular Calcification Score Predicts Cardiovascular Risk in Haemodialysis Patients. Nephrology Dialysis Transplantation, 19, 1480-1488.
https://doi.org/10.1093/ndt/gfh217 - 9. Blacher, J., Guerin, A.P., Pannier, B., et al. (2001) Arterial Calcifications, Arterial Stiffness, and Cardiovascular Risk in End-Stage Renal Disease. Hypertension, 38, 938-942.
https://doi.org/10.1161/hy1001.096358 - 10. Goodman, W.G. and Salusky, I.B. (2001) Non-Invasive Assessments of Cardiovascular Disease in Patients with Renal Failure. Current Opinion in Nephrology and Hypertension, 10, 365-369.
https://doi.org/10.1097/00041552-200105000-00011 - 11. National Kidney Foundation (2003) KDOQI Clinical Practice Guidelines for Bone Metabolism and Disease in Chronic Kidney Disease. American Journal of Kidney Diseases, 42, S1.
- 12. Tozawa, M., Iseki, K., Iseki, C., et al. (2002) Pulse Pressure and Risk of Total Mortality and Cardiovascular Events in Patients on Chronic Hemodialysis. Kidney International, 61, 717-726.
https://doi.org/10.1046/j.1523-1755.2002.00173.x - 13. Klassen, P.S., Lowrie, E.G., Reddan, D.N., et al. (2002) Association between Pulse Pressure and Mortality in Patients Undergoing Maintenance Hemodialysis. Journal of the American Medical Association, 287, 1548-1555.
https://doi.org/10.1001/jama.287.12.1548 - 14. London, G.M., Guérin, A.P., Marchais, S.J., Métivier, F., Pannier, B. and Adda, H. (2003) Arterial Media Calcification in End-Stage Renal Disease: Impact on All-Cause and Cardiovascular Mortality. Nephrology Dialysis Transplantation, 18, 1731-1740.
https://doi.org/10.1093/ndt/gfg414 - 15. Moe, S.M., Duan, D., Doehle, B.P., et al. (2003) Uremia Induces the Osteoblast Differentiation Factor Cbfa1 in Human Blood Vessels. Kidney International, 63, 1003-1011.
https://doi.org/10.1046/j.1523-1755.2003.00820.x - 16. Blacher, J., Guérin, A.P., Pannier, B., et al. (2001) Arterial Calcifications, Arterial Stiffness, and Cardiovascular Risk in End-Stage Renal Disease. Hypertension, 38, 938-942.
https://doi.org/10.1161/hy1001.096358 - 17. Adragao, T., Pires, A., Birne, R., et al. (2009) A Plain X-Ray Vascular Calcification score Is Associated with Arterial Stiffness and Mortality in Dialysis Patients. Nephrology Dialysis Transplantation, 24, 997-1002.
https://doi.org/10.1093/ndt/gfn584 - 18. Braun, J., Oldendorf, M., Moshage, W., et al. (1996) Electron Beam Computed Tomography in the Evaluation of Cardiac Calcification in Chronic Dialysis Patients. American Journal of Kidney Diseases, 27, 394-401.
https://doi.org/10.1016/S0272-6386(96)90363-7 - 19. Block, G.A., Hubet-Shearon, T.E., Levin, N.W. and Port, F.K. (1998) Association of Serum Phosphorus and Calcium Phosphate Product with Mortality Risk in Hemodialysis Patients: A National Study. American Journal of Kidney Diseases, 31, 607-617.
https://doi.org/10.1053/ajkd.1998.v31.pm9531176 - 20. London, G.M., Marty, C., Marchais, S.J., et al. (2004) Arterial Calcifications and Bone Histomorphometry in End-Stage Renal Disease. Journal of the American Society of Nephrology, 15, 1943-1951.
https://doi.org/10.1097/01.ASN.0000129337.50739.48