Open Journal of Epidemiology
Vol.4 No.2(2014), Article ID:45454,8 pages DOI:10.4236/ojepi.2014.42013
Structured Equation Model of Tuberculosis Incidence Based on Its Social Determinants and Risk Factors in Bandar Lampung, Indonesia
Dyah Wulan Sumekar Rengganis Wardani1*, Lutfan Lazuardi2, Yodi Mahendradhata2,3, Hari Kusnanto2
1Department of Public Health, Faculty of Medicine, University of Lampung, Bandar Lampung, Indonesia
2Department of Public Health, Faculty of Medicine, Gadjah Mada University, Yogyakarta, Indonesia
3Centre for Tropical Medicine, Faculty of Medicine, Gadjah Mada University, Yogyakarta, Indonesia
Email: *dwwardani@yahoo.com
Copyright © 2014 by authors and Scientific Research Publishing Inc.
This work is licensed under the Creative Commons Attribution International License (CC BY).
http://creativecommons.org/licenses/by/4.0/


Received **** 2014
ABSTRACT
World Health Organization through tuberculosis (TB) control averted up to six million deaths and cured thirty-six million people in 1995-2008, but had less success in reducing TB incidence, especially in thirteen high burden countries, including Indonesia. Therefore, TB control will need to have more emphasis on the issues of social determinants, as social determinants affect TB’s incidence directly and/-or through TB’s risk factors. This study aimed to identify a significant effect of social determinants and the risk factors of TB incidence. The research setting was at twenty-seven primary health centers and one hospital that have implemented the Directly Observed Treatment Short Course (DOTS) strategy in Bandar Lampung municipality, Indonesia. Respondents of this research were 238 smear-positive TB patients as case group and 238 patients without TB as control group. Research variables consisted of “social determinants”, “housing condition”, “household food security” and “health access” which were set as latent variables and measured through their indicators. Data had been collected by using questionnaire and then was analyzed with Structural Equation Modeling using SmartPLS 2.0 software. The result showed that “social determinants” through “housing condition” and “household food security” affected “TB incidence”. Moreover, “social determinants”, “housing condition” and “household food security” can be used to explain 34.1% variation of “TB incidence”. In conclusion, the knowledge can be used to support the TB control program, particularly to implement the DOTS strategy together with improving social determinants, housing condition and household food security.
Keywords:Social Determinants, Housing Condition, Household Food Security, TB Incidence, Structural Equation Modeling

1. Introduction
Since 1947-now, World Health Organization (WHO) has been conducting tuberculosis (TB) control through various interventions, such as mass Bacillus Calmette-Guérin (BCG) vaccination, improved chemotherapy, management and service program as well as the implementation of the Directly Observed Treatment Short Course (DOTS) strategy. Moreover, since 2000, WHO has initiated the Stop-TB Partnership in order to improve the effectiveness of the TB control program globally. The Stop-TB Partnership targets, included in the Millennium Development Goals (MDGs), is to halve prevalence and mortality by 2015 compared with their levels in 1990 [1] -[4] .
TB control averted up to six million deaths and cured thirty-six million people in 1995-2008. Unfortunately, the control had less success in reducing TB incidence. TB incidence only declined in 0.7% per year during 2004-2008. Moreover, the decline only occurred in some American and European countries. None of them are among the thirteen WHO high burden countries, which are mainly in Sub-Saharan and South East Asia [3] [5] -[7] . Globally, in 2010, there were estimated of 8.8 million TB incidences. The number was equivalent to 128 cases/100,000 populations. Most of cases occurred in Asia (59%) and Africa (26%), meanwhile smaller proportions of cases occurred in the Eastern Mediterranean region (7%), European (5%) and Americas (3%). Indonesia is one of the five countries with the highest number of TB incidence in 2010 (0.37 - 0.54 million incidences). In addition to that, the number increased compared to TB incidence during 2009 (0.35 - 0.52 million incidences) [3] [6] .
Therefore, in order to reduce the incidence of TB further, TB control will need to “move out of the TB box” with more emphasis on the issues of social determinants [8] as, social determinants affect TB’s incidence directly and/-or through TB’s risk factors, those are household food security, housing condition and health access [5] [9] -[12] . In addition, it has been proven that social determinants and TB risk factors are latent variables that couldn’t be measured directly but measured through their indicators (manifest variables). Previous studies have shown that TB incidence in some countries such as Philippines, Bangladesh, Vietnam, India, South Africa and Gambia is closely related to some indicators of social determinants as well as some indicators of TB risk factors [13] -[16] . In those studies, however, social determinants and TB risk factors have not been studied as latent variables.
Bandar Lampung is the capital city of Lampung Province in Indonesia. Based on Bandar Lampung Municipality Health Office TB report 2010-2011, although TB cure rate in 2009 and 2010 had reached 80% - 85%, TB incidence in the city during that period increased, from 112/100,000 population in 2009 to 114/100,000 population in 2010. Moreover, based on statistical data in the year of 2011, Lampung is one of the poorest provinces as well as the province with poorest housing condition in Indonesia. Those two factors, poverty and housing condition, are well known to directly correlate with social determinants and TB risk factors.
This study aimed to identify the significant effect of social determinants and TB risk factors again TB incidence. Since social determinants and TB risk factors were latent variables which couldn’t be measured directly, Structural Equation Modeling (SEM) was then required to analyze the effect rather than the ordinary regression model. The knowledge of how social determinants and TB risk factors influence the TB incidence will then be useful to support a more effective TB control program.
2. Methods
2.1. Study Site and Sample
This study has been conducted in one hospital and twenty-seven Primary Health Centers (PHC) across the Bandar Lampung City that have been implementing the DOTS strategy. Population of this research consisted of case population and control population. Case population was consisted of 628 smear-positive TB patients recorded during January-July 2012 at the study site. Meanwhile, control population was TB suspects that were recorded during period of January-July 2012 who did not suffer from TB. The control population, were confirmed by negative result of TB laboratory test or X-ray examination. The sample size of both the case group and control group was decided based on the sample size calculation method for case and control group [17] . In this study, a sample size of 238 were used for both case and control groups to clarify a statistically significance influence of research variables, with 80% power and 95% significance level.
2.2. Research Variables
Research variables in this study were latent variables, which cannot be measured directly and must be measured through their indicators. The dependent variable was TB, which was measured by one indicator namely suffering TB (yes and no). The independent variables consisted of “social determinants”, “housing conditions”, “household food security” and “health access”. Latent variable of “social determinants” was measured by four indicators: education (length of education that has been received: less than nine years, nine years, more than nine years), occupation (unemployed, temporary employee, permanents employee), income (income per-capita: less than US$ 804; US$ 804 – 1639; more than US$ 1639) and social classes ( having none productive asset, having one productive assets, having more than one productive assets) [11] [12] [18] [19] . “Housing conditions”, as latent variable, was measured by three indicators: house density index (house area divided by number of person: less than 5.6 m2, 5.6 - 8 m2, more than 8 m2), ventilation (percentage of ventilation area of house width: less than 13.75%, 13.75% - <20.00%, more than 20%) and indoor air pollution (number of indoor air pollution sources: 5, 4, 3, 2, 1,0) [14] [20] . “Household food security”, as latent variables, was measured by three indicators: food budget (monthly food budget for each person: less than US$ 13, US$ 13 - 30, more than US$ 30), diet diversity (number of diet type of daily consumption: 1, 2, 3, 4) and food sufficiency (ever missed meal time and reduced meal portion for one—four weeks, ever missed meal time less than one week and ever reduce meal portion for one—four weeks; ever reduced meal portion for one—four weeks; ever reduced meal portion for less than one week) [21] [22] . Meanwhile, “health access” was measured by two indicators: distance to health facility (more than five kilometer, one—five kilometer, less than one kilometer) and transportation needs (availability of transportation: public transportation, private transportation, no transportation needed) [23] .
2.3. Data Collection and Analysis
In-depth interview using questionnaire was performed in order to collect data in this research. The data collected were then analyzed using SEM. It has been known that SEM is a statistical method which can be used to measure not only relationship among all latent variables involved but also measure relationship between latent variables and their indicators. This method provides relationship significance among latent variables simultaneously. In the other hand, both using ordinary regression and only using indicators without latent variables to analyze latent variables will be able to cause a parametric measurement false [24] .
Partial Least Square (PLS) algorithm was chosen to set up SEM since the data was considered as non-normal distribution and due to its multi-co-linearity. SmartPLS version 2.0M3 was chosen as software to conduct the SEM analysis. The SmartPLS supports graphical modeling and carries out the bootstrapping procedure to generate significance measurements. Evaluation within the PLS algorithm consists of measurement-model evaluation (outer model) and structural-model evaluation (inner model). Measurement-model evaluation was performed to evaluate goodness of concerned indicators to represent their latent variable signified by loading indicator values. Meanwhile structural-model evaluation was done to evaluate goodness of relationship between independent-latent variable and dependent-latent variable signified by value of both the path-model coefficient and R2. In this research, the PLS analysis was performed by specifying the sampling number of 1000 for bootstrapping. Furthermore, the latent variables namely TB, social determinants and risk factors scores were estimated for further analysis.
2.4. Ethical Clearance
We obtained ethical clearance for the study from the Medical and Health Research Ethics Committee, Faculty of Medicine, Gadjah Mada University. In addition to that, all of respondents involved in this research were asked to participate on voluntary basis and received sufficient information to consider consent prior to the interview.
3. Result
PLS path model of TB incidence has been developed, to identify relationship between latent variable and its indicators as well as correlation among the concerned latent variables namely TB risk factors, “social determinants” and “TB incidence” (Figure 1). In this path model, “social determinants” is predicted to affect “TB incidence” directly and/orthrough other latent variable namely “housing condition”, “food security” and “health access” of concerned household [9] . The significances of predicted each and or simultaneous paths were then analyzed during the model running (measurement-model and structural-model evaluation). The path coefficient of the structure model and bootstrapping test results for outer loading of the measurement model are presented at Table 1 and Table 2 respectively.
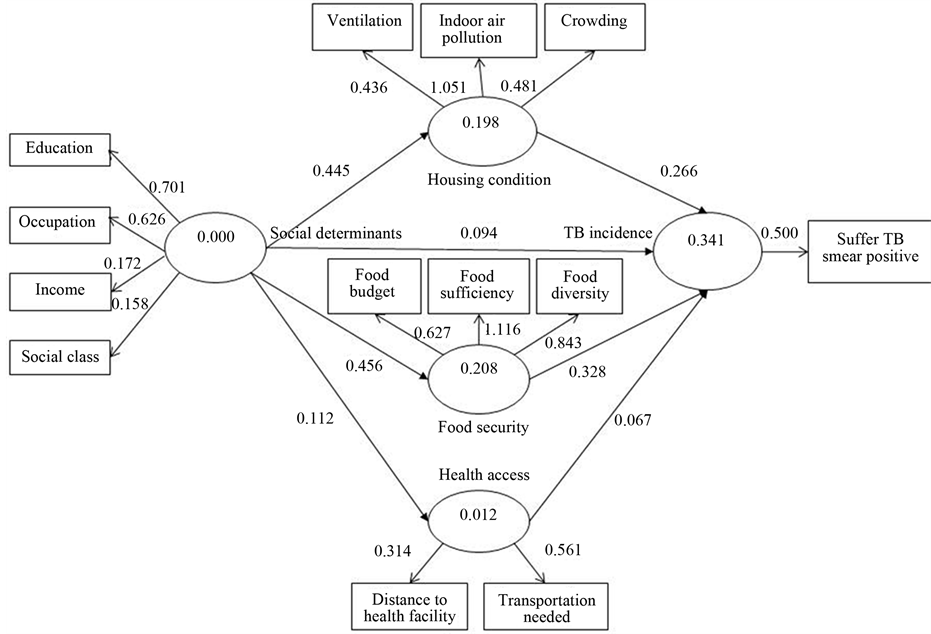
Figure 1. PLS path model of TB incidence, social determinants and risk factors.

Table 1. Bootstrapping test for path coefficients.
*p value < 0.05.
Table 2. Bootstrapping test for outer loadings.
*p value < 0.05.
Table 1 shows that four out of seven paths in the model are considered significant indicated by their t value which higher than 1.96 (at 0.05 of significant level) and the remaining three path lines within the model are considered as insignificant. Those three path lines have origin and destination respectively as the following: “social determinants”—“TB incidence”, “social determinants”—“health access” and path from “health access” to “TB incidence”. The four significant paths consist of: “social determinants”—“food security”, “social determinants”— “housing conditions”, “food security”—“TB incidence” and “housing conditions”—“TB incidence”. Two paths that originated from “social determinants” which are connecting to both “food security” and “housing condition” of concerned household have t value of 6.088 and 5.821 respectively. Meanwhile, paths from both food security and housing condition of concerned household which are connecting to “TB incidence” as their destinations have t value of 2.467 and 3.427 respectively.
Refer to the results above which are schematized in Figure 1, it can be learned that “social determinants” has no direct effects to “TB incidence”. Paths of “social determinants” through “health access” also found insignificant influence to the “TB incidence”. Meanwhile, path of “social determinants” through other two latent variables, “food security” and “housing condition” of the concerned household, present strong effects to “TB incidence”.
Figure 1 and Table 1 also show that standardized path coefficients of “social determinants”, “household food security” and “housing condition” are positive, which mean that effect of social determinants to “TB incidence” through “household food security” and “housing condition” are also associated as positive. The path coefficient of connecting paths originated from “social determinants” to “TB incidence” through “household food security” is 0.149 which was provided by multiplication among all paths coefficient involved, in this case 0.456 multiplied by 0.328. Meanwhile, with the same method, the path coefficient of “social determinants” to “TB incidence” through “housing condition” was calculated as 0.456 multiplied by 0.266 which is 0.118.
The resultant effect of “social determinants”, “household food security” and “housing condition” can explain 34.1% variation of TB incidence, as showed in Figure 1. Meanwhile, the remaining variation can be explained by other variables which are not studied in this research.
Both Figure 1 and Table 2 show that most of loading factors, except social class and distance to health facility, are considered prominent to explain their latent variable at 0.05 significant level (t value is more than 1.96). It means that most of the indicators, ten out of twelve, represent or can be used to explain their latent variable. Figure 1 and Table 2 also show that education is indicator with the highest loading factor value (λ = 0.702), compared to other indicators in “social determinants” latent variable. Indicator with the highest loading factor value indicates that the indicator also has the strongest correlation to its latent variable. Meanwhile, indoor air pollution (λ = 1.051) and food sufficiency (λ = 1.116) are indicators which have strongest correlation to their latent variables, those are “housing condition” and “household food security” respectively.
4. Discussion
Our findings suggest that “social determinants” through “household food security” and “housing condition” affect “TB incidence” significantly. The result indicates that people with lower education, occupation, income and social class, tend to have house with an overcrowded, inadequately ventilation, and indoor air pollutions. The people also tend to have lack of food budget, food diversity and food sufficiency. Those factors will increase risk of TB. The result concur with some reviews which stated that social determinants through TB risk factors (“housing condition” and “household food security”) affect TB incidence [5] [9] [25] . Since found no particular published studies about “social determinants”, “housing condition”, “household food security” and “TB incidence” as latent variables, it was difficult to have a significant comparison that can be performed. In the other hand, there were some researches which studied relationship between indicators of the three concerned latent variables (“social determinants” and “housing condition” or “household food security”) and they provided similar results. Similar result also presented on number of works studied about interaction between “housing condition” and “TB incidence” as well as “household food security” and “TB incidence” [14] -[16] .
Our findings suggest that latent variable of “social determinants” have no direct effect to “TB incidence” or indirect effect through “health access”. The result, however, is not in line with some reviews which stated that social determinants have direct effect to TB incidence, as well as indirect effect through “health access” [5] [9] [25] . The insignificant could be caused by the fact that there is no difference of social class between control group and case group, which can be resulted from the same sources of control and case group [16] . It also could be caused by fact that basically distance from their address to health service both for control group and case group are relatively the same. The fact was mainly due to regional conditions of the Bandar Lampung. Distance from one health-service unit to the other health-service unit in the Bandar Lampung, as a research location, is only about two kilometers, in perpendicular line, and the farthest respondent from health service is only 6 kilometers. Moreover, the non-concurrence of the findings is also caused by other independent latent variables which have stronger relationships to TB. On the path model, it can be seen that all indicators of both “housing conditions” and “household food security” are significant at 0.05 level and have high loading factor (λ) values, which means that those variables represent their latent variables and have a stronger relationship to “TB incidence” compared to “social determinants” and “health access” [26] .
Our findings show that education, indoor air pollution and food sufficiency are indicators which have the strongest correlation to social determinants, housing condition and household food security respectively. The knowledge suggests that improvement in education would have the strongest effect in social determinants improvement. The result in line with “fighting Poverty to Control TB Project” in Lima, Peru, which demonstrated that improving access to the work education has a significant effect in improving social determinants as well as the tuberculosis control [27] . In spite of improvement in education, our findings also suggest that improvement in indoor air pollution and food sufficiency would have the strongest effect in housing condition and food security, respectively.
Our finding also shows that “social determinants” through “housing condition” and “household food security” all together represent 34.15% of “TB incidence”. Meanwhile, the remaining 65.85% should be explained by other variables which are not studied in this research. The remaining variables are strong related to human behavior that could be measured by its indicators namely: HIV, diabetes mellitus, smoking and malnutrition [10] .
5. Conclusion
We have demonstrated that TB incidence is closely related to the insufficiency of social determinants (education, occupation, income and social status) which then also affect TB risk factors namely inadequate of housing condition and food security of the concerned household. The findings of social determinants and risk-factors significance can be used to support TB control program in low and middle countries that have social determinants as main issue causing TB incidences, including Indonesia. The knowledge also implies that the implementation of the DOTS-strategy should be combined with promotion and improvement effort upon all aspects regarding “social determinants”, “housing condition” as well as “household food security”. Indicators suggested in the improvement are education, indoor air pollution and food sufficiency. To be more effective, the effort must be supported by other health sectors and other institutions [25] [28] . Therefore, social determinants, housing condition as well as household food security improvement should be elaborated into the implementation of the DOTS strategy as an integrated TB control program.
Acknowledgements
We would like to thank all of health-services officer across Bandar Lampung particularly TB’s taskforce for their support during the data collection.
References
- Raviglione, P. (2002) Evolution of WHO Policies for Tuberculosis Control, 1948-2001. The Lancet, 359, 775-780. http://dx.doi.org/10.1016/S0140-6736(02)07880-7
- Stop TB Partnership WHO (2006) The Stop TB Strategy. Building on and Enhancing DOTS to Meet The TB-Related Millennium Development Goals. Geneva.
- WHO (2011) Global tuberculosis control: WHO Report 2011. Geneva.
- Stop TB Partnership WHO (2010) The Global Plan to Stop TB 2011-2015. Transforming the Fight towards Elimination of Tuberculosis. Geneva.
- Lönnroth, K., Castro, K.G., Chakaya, J.M., Chauhan, L.S., Floyd, K., Glaziou, P., et al. (2010) Tuberculosis Control and Elimination 2010-50: Cure, Care, and Social Development. The Lancet, 375, 1814-1829. http://dx.doi.org/10.1016/S0140-6736(10)60483-7
- WHO (2010) Global Tuberculosis Control 2010: WHO Report 2010. Geneva.
- Dye, C., Lönnroth, K., Jaramillo, E., Williams, B. and Raviglione, M. (2009) Trends in Tuberculosis Incidence and Their Determinants in 134 countries. Bulletin World Health Organization, 87, 683-691. http://dx.doi.org/10.2471/BLT.08.058453
- Raviglione (2009) Tuberculosis Prevention, Care and Control, 2010-2015: Framing Global and WHO Strategic Priorities. Report of the Ninth Meeting 9-11 November 2009. Geneva.
- Lönnroth, K. (2011) Risk factors and Social Determinants of TB. The Union NAR Meeting. http://www.bc.lung.ca/association_and_services/documents/KnutUnionNARTBriskfactorsanddeterminantsFeb2011.pdf
- Lönnroth, K, Jaramillo, E., Williams, B.G., Dye, C. and Raviglione, M.C. (2009) Drivers of Tuberculosis Epidemics: The Role of Risk Factors and Social Determinants. Social Science & Medicine, 68, 2240-2246. http://dx.doi.org/10.1016/j.socscimed.2009.03.041
- CSDH (2007) A Conceptual Framework for Action on the Social Determinants of Health. Geneva.
- Solar, O. and Irwin, A. (2010) A Conceptual Framework for Action on the Social Determinants of Health. Social Determinants of Health Discussion Paper 2 (Policy and Practice). WHO, Geneva.
- van Leth, F., Guilatco, R.S., Hossain, S., van’t Hoog, A.H., Hoa, N.B., van der Werf, M.J., et al. (2011) Measuring Socio-Economic Data in Tuberculosis. The International Journal of Tuberculosis and Lung Disease, 15, 558-563. http://dx.doi.org/10.5588/ijtld.10.0417
- Balakrishnan, K., Mehta, S., Kumar, P. and Ramaswamy, P. (2004) Indoor Air Pollution Associated with Household Fuel Use in India Indoor Air Pollution Associated with Household Fuel Use in India. An exposure Assessment and Modeling Exercise in Rural Districts of Andhra Pradesh, India. The World Bank, Washington DC.
- Harling, G., Ehrlich, R. and Myer, L. (2008) The Social Epidemiology of Tuberculosis in South Africa : A Multilevel Analysis. Social Science & Medicine, 66, 492-505. http://dx.doi.org/10.1016/j.socscimed.2007.08.026
- Hill, P.C., Jackson-sillah, D., Donkor, S.A., Out, J., Adegbola, R.A. and Lienhardt, C. (2006) Risk Factors for Pulmonary Tuberculosis : A Clinic-Based Case Control Study in The Gambia. BMC Public Health, 6, 1-7. http://dx.doi.org/10.1186/1471-2458-6-156
- Lemeshow, S. and David, J. (1997) Besar Sampel dalam Penelitian Kesehatan (terjemahan). Gadjah Mada University Press, Yogyakarta.
- Badan Perencana Pembangunan Nasonal (2010) Peningkatan Akses Masyarakat terhadap Pendidikan yang Berkualitas. http://www.bappenas.go.id/index.php/download_file/view/10157/1920/?&kid=1397612052
- Badan Pusat Statitistik Kota Bandar Lampung (2013) Kota Bandar Lampung dalam Angka, Bandar Lampung City in Figures 2013. http://bandarlampungkota.bps.go.id/publikasi/buku/BLDA2013/
- Kementrian Kesehatan RI (2010) Riset Kesehatan Dasar 2010. Kementrian Kesehatan Republik Indonesia.
- Bickel, G., Nord, M., Price, C., Hamilton, W. and Cook, J. (2000) Guide to Measuring Household Food Security, Revised 2000. US Department of Agriculture, Food and Nutrition Service, Alexandria.
- Badan Pusat Statistik Provinsi Lampung (2013) Lampung dalam Angka 2013, Lampung in Figures. http://lampung.bps.go.id/publikasi/buku/lda2013/index.html
- Badan Perencanaan Pembangunan Nasional (2010) Peningkatan Akses Masyarakat terhadap Kesehatan yang Berkualitas. http://www.bappenas.go.id/index.php/download_file/view/10158/1920/?&kid=1397612052
- Wijanto, S. (2008) Structural Equation Modeling dengan Lisrel 8.8. Graha Ilmu, Yogyakarta.
- Lönnroth, K., Holtz, T.H., Cobelens, F., Chua, J., Leth, F.V., Tupasi, T., et al. (2009) Inclusion of Information on Risk Factors, Socio-Economic Status and Health Seeking in A Tuberculosis Prevalence Survey. The International Journal of Tuberculosis and Lung Disease, Educational Series, 13, 171-176.
- Hastono (2001) Analisis Data. Fakultas Kesehatan Masyarakat UI, Jakarta.
- Hargreaves, J.R., Boccia, D., Evans, C.A., Adato, M., Petticrew, M. and Porter, J.D.H. (2011) The Social Determinants of Tuberculosis: From Evidence to Action. American Journal of Public Health, 101, 654-662. http://dx.doi.org/10.2105/AJPH.2010.199505
NOTES

*Corresponding author.