Open Journal of Civil Engineering
Vol.2 No.1(2012), Article ID:17816,5 pages DOI:10.4236/ojce.2012.21004
Strength of Concrete in Slabs, Investigates along Direction of Concreting
Institute of Building Engineering, Wroclaw University of Technology Wybrzeze Wyspianskiego, Wroclaw, Poland
Email: Bohdan.Stawiski@pwr.wroc.pl
Received October 15, 2011; revised November 21, 2011; accepted November 30, 2011
Keywords: Concrete; Compressive Strength of Concrete; Non-Destructive
ABSTRACT
In theory of concrete it is assumed that concrete composites are isotropic on a macro scale. For example, it is assumed that a floor slab’s or a beam’s strength is identical in all directions and its nonhomogeneity is random. Hence neither calculations of the load-bearing capacity of structural components nor the techniques of investigating concrete in structure in situ take into account to a sufficient degree the fact that the assumption about concrete isotropy is overly optimistic. The present research shows that variation in concrete strength along the direction of concreting has not only a qualitative effect (as is commonly believed), but also a significant quantitative effect. This indicates that concrete is a composite which has not been fully understood yet. The paper presents evaluations of ordinary concrete (OC) homogeneity along component thickness along the direction of concreting. The ultrasonic method and modified exponential heads with a point contact with concrete were used in the investigations [1-3].
1. Introduction
In a building structure there are components which are expected to have special properties but not necessarily in the whole cross section. Components under bending, such as beams and floor slabs are generally compressed in their upper zone and the concrete’s compressive strength is vital mainly in this zone. The components are usually moulded in the same position in which they later remain in service, i.e. with their upper zone under compression. Concrete in the upper zone is expected to be slightly weaker than in the lower zone, but it is unclear how much weaker [4,5]. Also flooring slabs in production halls are most exposed to abrasion and impact loads in their upper zone which is not their strongest part. It is known from practice that industrial floors belong to the most often damaged building components.
When reinforced concrete beams or floor slabs are to be tested they can be accessed only from their undersides and so only the bottom parts are tested and on this basis conclusions are drawn about the strength of the concrete in the whole cross section, including in the compressed upper zone. Thus a question arises: how large are the errors committed in this kind of investigations?
In order to answer the above and other questions, tests of the strength of concrete in various structural components, especially in horizontally concreted slabs, were carried out. The variation of strength along the thickness of the components was analyzed.
2. Research Significance
The research results presented in the paper show that the compressive strength of concrete in horizontally formed structural elements varies along their thickness. In the top zone the strength is by 25% - 30% lower than the strength in the middle zone, and it can be by as much as 100% lower than the strength in the bottom zone. The observations are based on the results of nondestructive tests carried out on drill cores taken from the structure, and verified by a destructive method. It is interesting to note that despite the great advances in concrete technology, the variation in compressive strength along the thickness of structural elements is characteristic of both old (over 60 years old) concretes and contemporary ordinary concretes.
3. Test Methodology
Before Concrete strength was tested by the ultrasonic method using exponential heads with a point contact with concrete. The detailed specifications of the heads can be found in [2,3]. The heads’ frequency was 40 and 100 kHz and the diameter of their concentrators amounted to 1 mm2). The head’s cross section is shown in Figure 1.
In order to determine the real strength distributions in the existing structures, cylindrical cores 80 mm or 114 mm diameter (Figure 2) were drilled from them in the direction of concreting. Then specimens with their height equal to their diameter were cut out of the cores.
Figure 1. Ultrasonic probe equipped with exponential concentrator.
Figure 2. Exemplary cores drilled from slabs.
Ultrasonic measurements were performed on the cores according to the scheme shown in Figure 3. Ultrasonic pulses (pings) were passed through in two perpendicular directions I and II in planes spaced every 10 mm. In this way one could determine how ping velocity varied along the core’s height, i.e. along the thickness of the tested component.
In both test directions ping pass times were determined and velocities CL were calculated. The velocities from the two directions in a tested measurement plane were averaged.
Subsequently, specimens with their height equal to their diameter of 80 mm were cut out of the cores. Average ultrasonic pulse velocity CL for the specimen’s central zone was correlated with fatigue strength fc determined by destructive tests carried out in a strength tester. For the different concretes different correlation curves with a linear, exponential or power equation were obtained. Exemplary correlation curve equations are given below:
 (1)
(1)
 (2)
(2)
 (3)
(3)
where:
fc—the compressive strength of concrete MPaCL—ping velocity km/s.
The determined correlation curve was used to calculate the strength of concrete in each tested core cross section and the results are presented in the form of graphs illus-
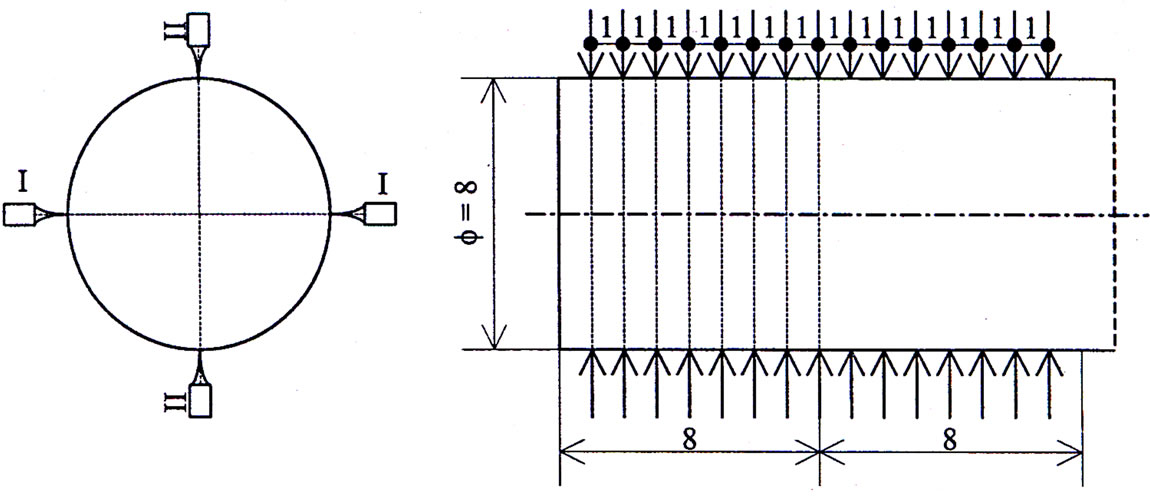
Figure 3. Scheme showing how concrete cores drilled from tested structures were tested.
trating concrete strength distribution along the thickness of the tested component.
4. Investigation of Concrete Strength Distribution along Direction of Concreting for Different Structural Components
4.1. Investigation of Concrete in Industrial Floors
After Floor in sugar factory’s raw materials storage hall Concrete in an industrial floor must have particularly good characteristics in the top layer. Since it was to be loaded with warehouse trucks and stored sugar beets and frequently washed the investigated concrete floor (built in 1944) was designed as consisting of a 150 mm thick underlay and a 50 mm thick surface layer and made of concrete with a strength of 20 MPa (concrete A).
As part of the investigations eight cores, each 80 mm in diameter, were drilled from the floor. The investigations showed significant departures from the design. The concrete subfloor’s thickness varied from 40 to 150 mm. The surface layer was not made of concrete, but of cement mortar with sand used as the aggregate. Also the thickness of this layer was uneven, varying from 40 to 122 mm. After the ultrasonic tests specimens with their height equal to their diameter of 80 mm were cut out of the cores. Two scaling curves: one for the surface layer and the other for the bottom concrete layer were determined. A characteristic concrete compressive strength distribution along the floor’s thickness is shown in Figure 4.
Strength in the upper zone is much lower than in the lower zone: ranging from 4.7 to 9.8 MPa for the mortar and from 13.9 to 29.0 MPa for the concrete layer. The very low strength of the upper layer of mortar is the result of strong porosity caused by air bubbles escaping upwards during the vibration of concrete. Figure 5 shows the specimen’s porous top surface.
Floor in warehouse hall with forklift truck transport The floor was built in 1998. Cellular concrete was used as for the underlay and the 150 mm thick surface layer was made of ordinary concrete with fibre (steel wires) reinforcement (concrete B). Cores 80 mm high and 80 mm in
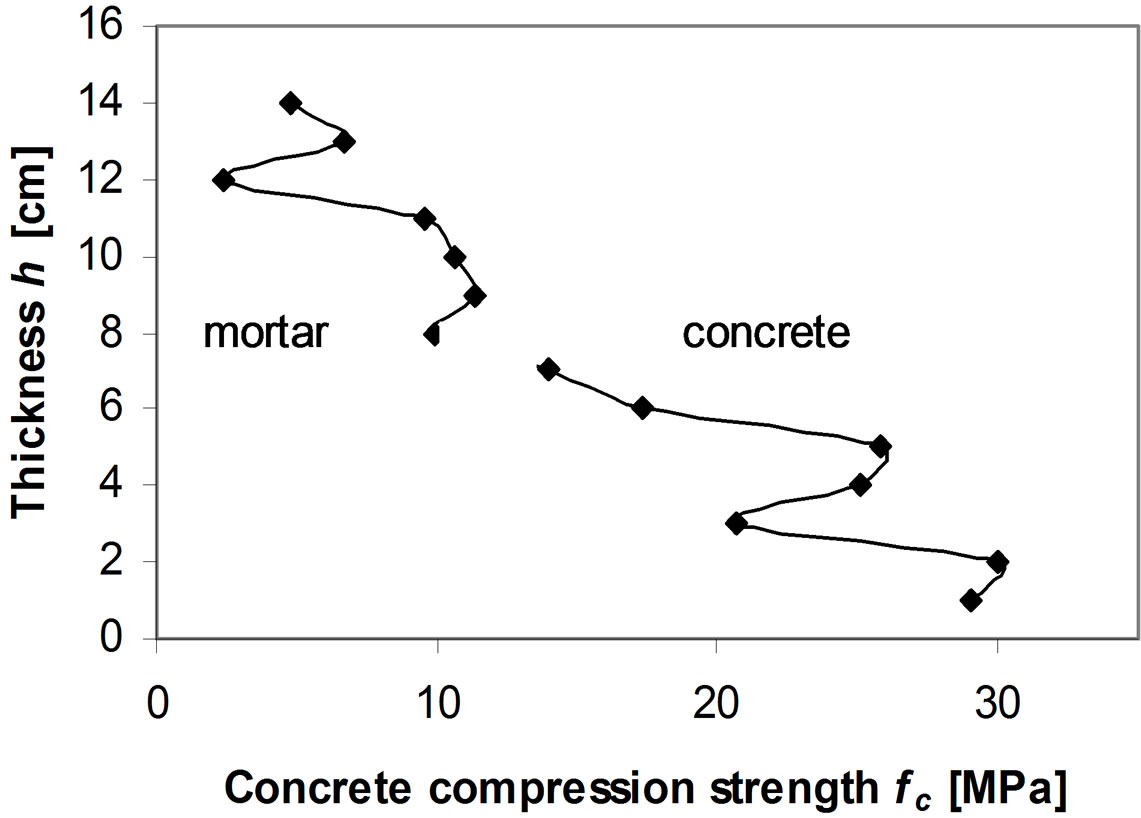
Figure 4. Concrete strength distribution in concrete underlay and in cement mortar floor.
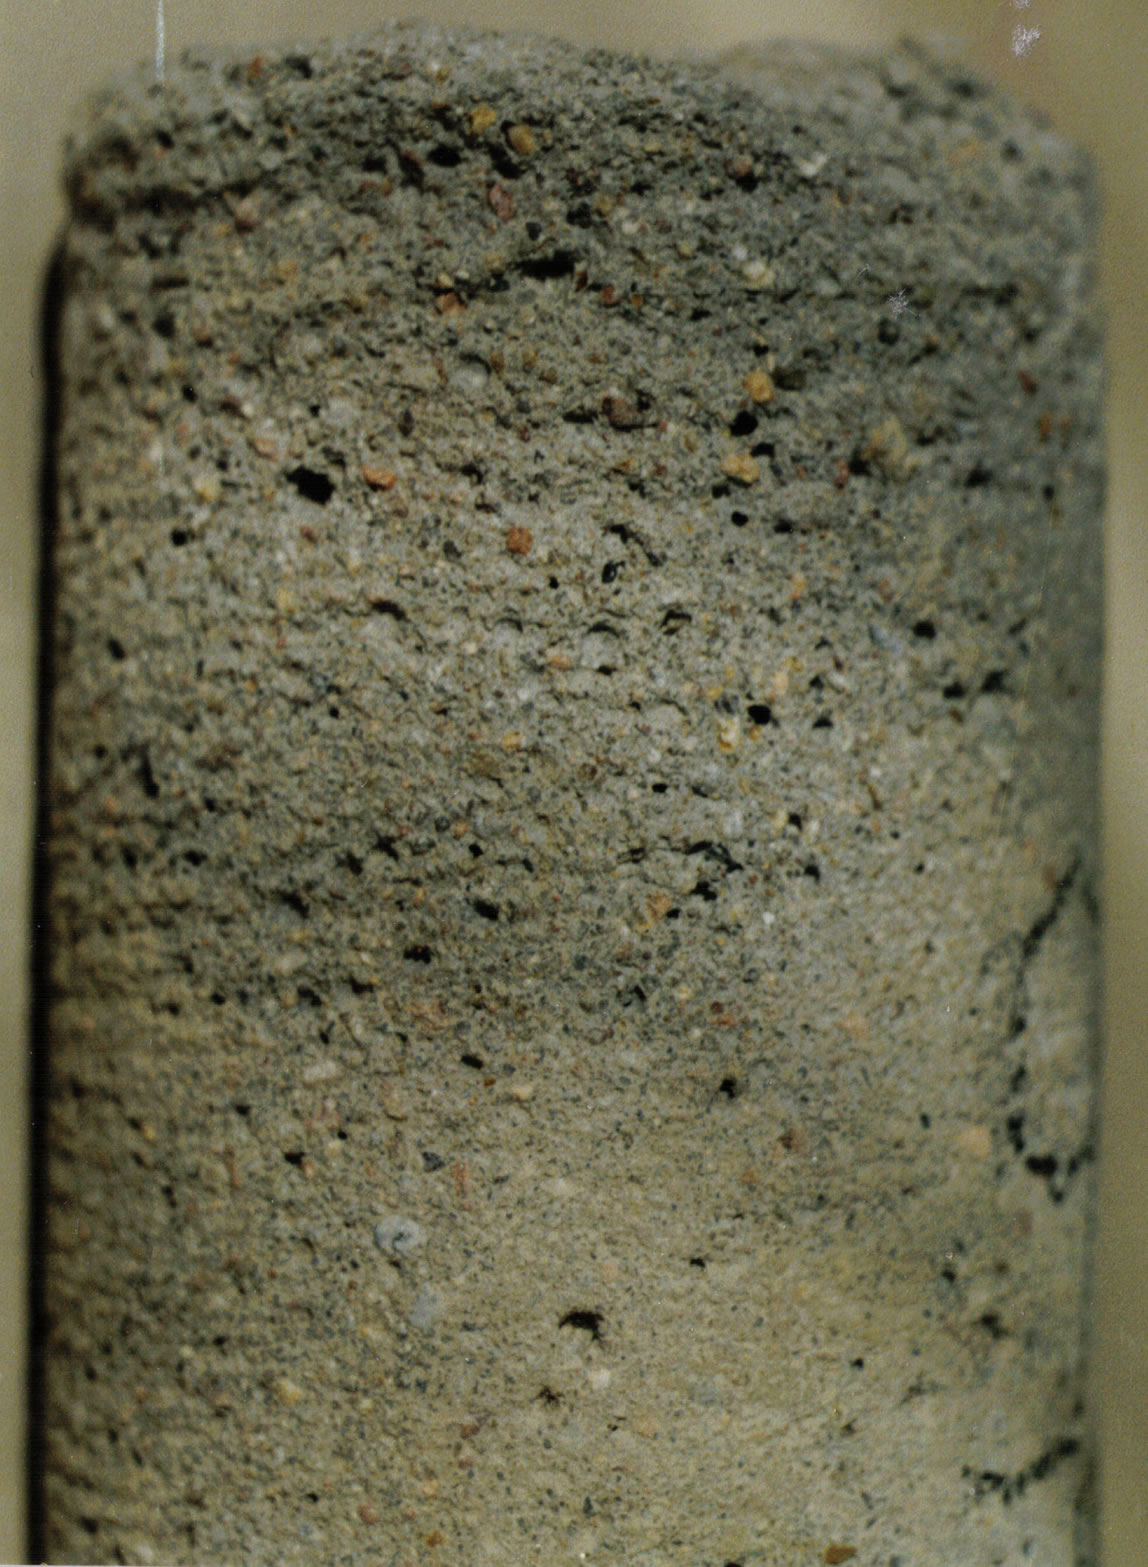
Figure 5. Top layer of floor is most porous and weakest.
diameter were drilled from the surface layer. Ultrasonic measurements and destructive tests were performed as described above. Also the test results were handled in a similar way. An exemplary strength distribution along the floor’s thickness is shown in Figure 6.
The upper zone strength is by 40% - 60% lower than the lower zone strength. The design grade of concrete was B25. But the concrete reaches this strength as much down as 90 mm from the top surface.
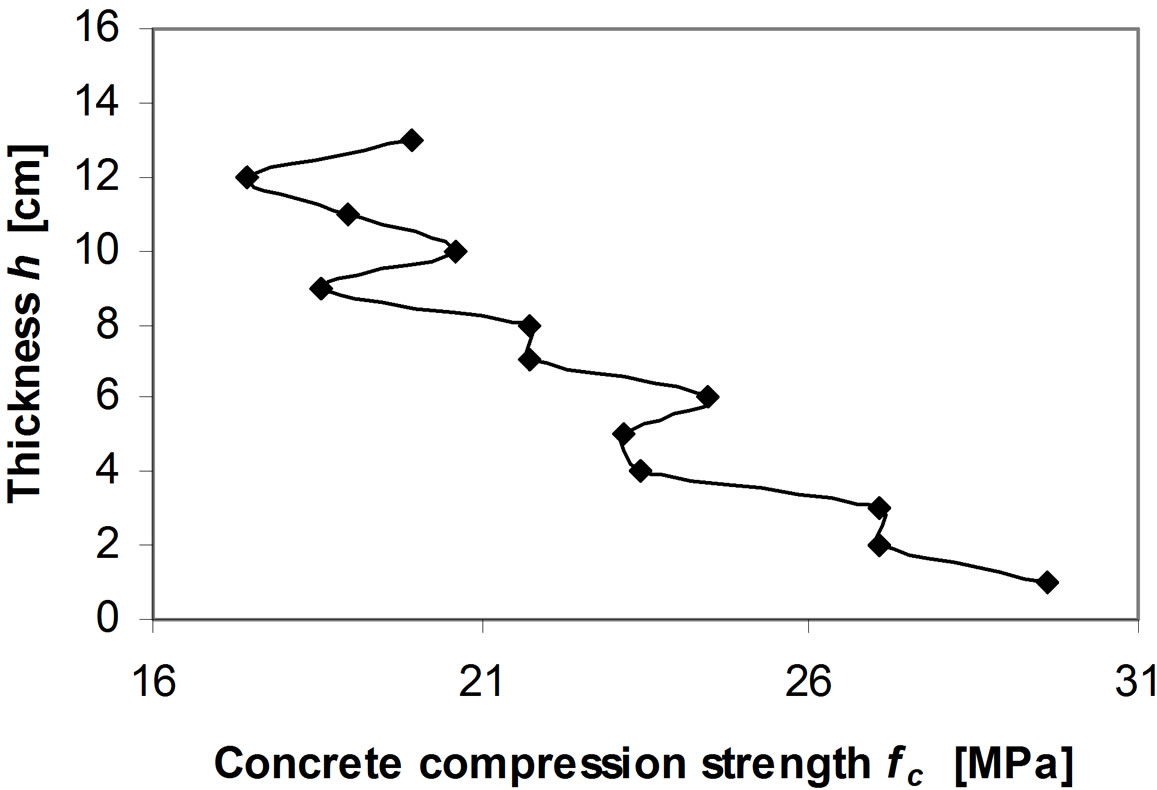
Figure 6. Exemplary concrete compressive strength distribution in warehouse hall floor.
4.2. Investigation of Concrete in Old and New Floor Slabs
Building erected in 1942 Concrete (C) in the floor slab of an industrial building was investigated. Nine cores 80 mm in diameter were drilled from the whole thickness of the floor whose loadbearing layer was 115 mm thick. The obtained ultrasonic test results were converted into strengths and shown in Figure 7 for the most typical core.
Visual inspection of the element’s macroscopic structure had not revealed such differentiation in strength. A view of an exemplary structure of the tested concrete is shown in Figure 8.
Hence a uniform strength distribution along the thickness of the floor slab had been expected. But ultrasonic tests showed a drop in strength down to 17 MPa in the upper zone while the concrete in the slab’s lower zone had a strength of 34 MPa.
Building erected in 2001 Contemporary buildings are quite commonly built from hybrid concrete structures, e.g. floors made from prefabricated reinforced concrete components forming the underlay for a top monolithic layer. Concrete (D) strength distribution along the thickness of the monolithic layer was investigated in a similar way as in the above case. Cores were drilled from the top part of the floor down to the prefabricated concrete underlay as shown in Figure 9.
In this case, macroscopic examinations showed much greater porosity of the concrete in the upper zone (Figure 10).
Concrete strength distribution along the thickness of the monolithic slab was investigated on the basis of the cores. The characteristic graph of strength distribution is shown in Figure 11.
Also in this case the compressive strength of the concrete varies greatly: amounting to about 12 MPa and 23 MPa in respectively the upper and lower zone.
5. Conclusions
Tests of ordinary concretes show unexpectedly greatly reduced strength in the upper zone of horizontally moulded structural components. This is to a large degree due to the
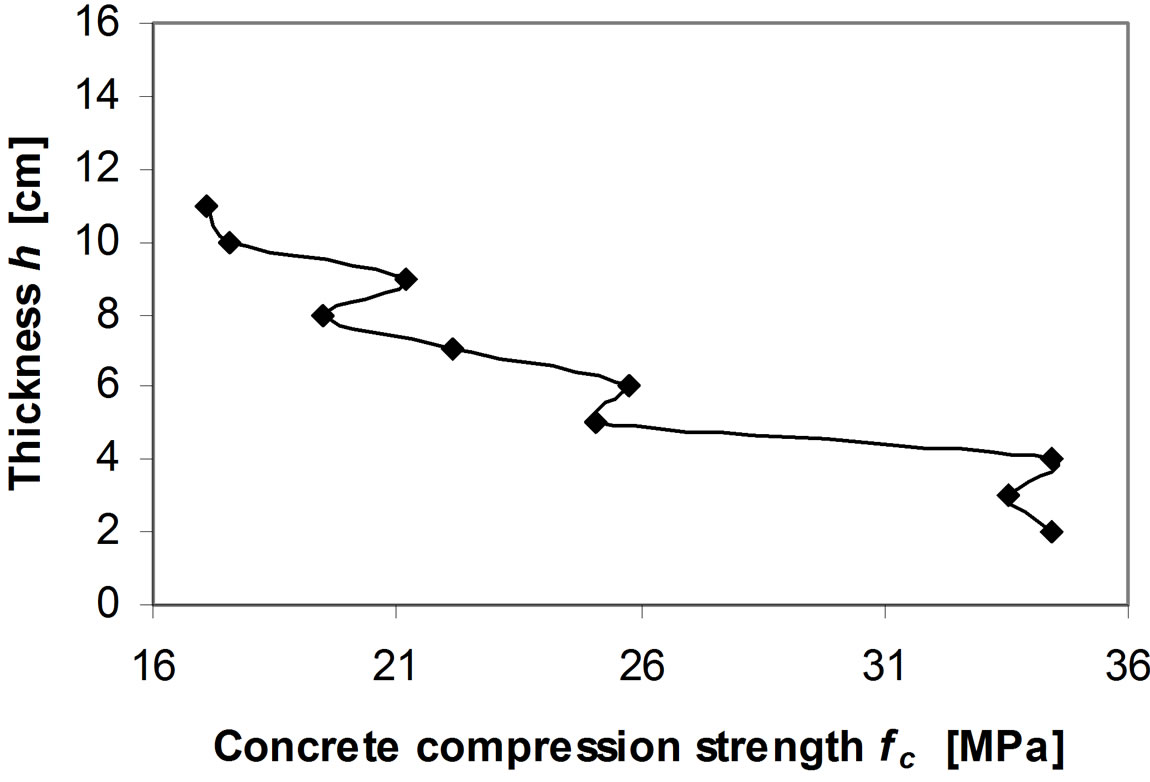
Figure 7. Typical concrete strength distribution along thickness of tested floor slab made in 1942.

Figure 8. View of exemplary structure of tested concrete.

Figure 9. Hybrid floor structure and drilling of cores 114 mm in diameter for ultrasonic tests.
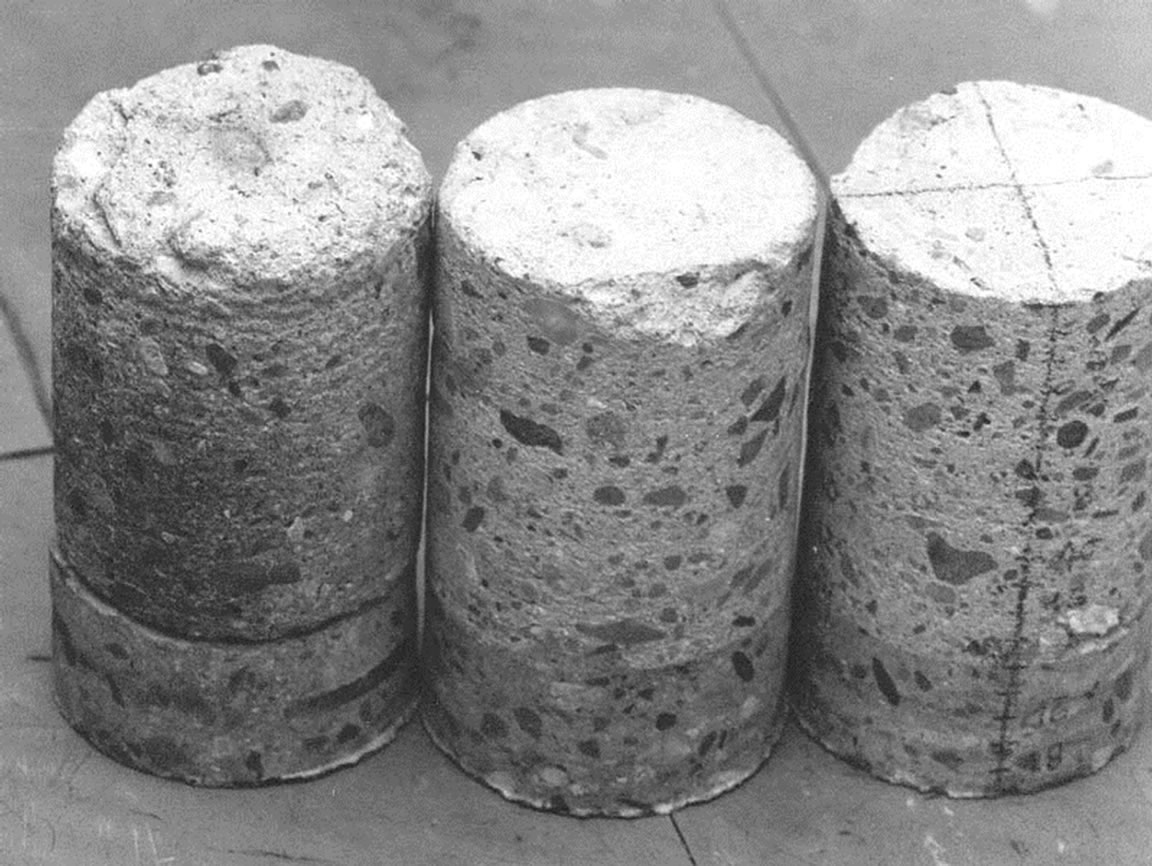
Figure 10. Macroscopic examination shows more porous structure in upper zone of concrete in cores.
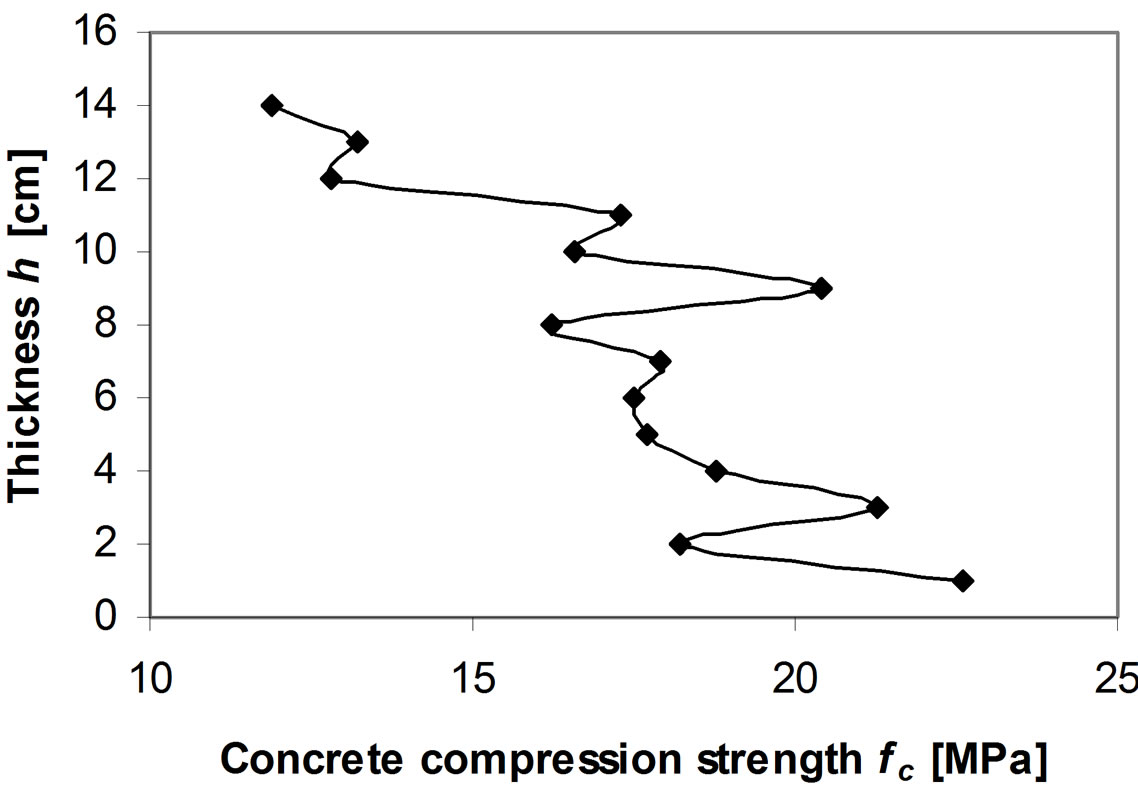
Figure 11. Characteristic graph of concrete compressive strength distribution in monolithic layer of hybrid floor slab.
vibration of concrete as a result of which coarse aggregate displaces downwards making the lower layers more compact while air moves upwards aerating the upper layers and thereby increasing their porosity (Figure 5). The increase in the concrete’s porosity results in a large drop in its compressive strength. Thanks to the use of the ultrasonic method and probes with exponential concentrators it could be demonstrated how the compressive strength of ordinary concrete is distributed along the thickness of structural components in building structures. It became apparent that the reduction in compressive strength in the compressed zone of structural components under bending and in industrial concrete floors can be very large (amounting to as much as 50% of the strength of the slab’s lower zone). Therefore this phenomenon should be taken into account at the stage of calculating slabs, reinforced concrete beams and industrial floors [6].
The results of the presented investigations apply to ordinary concretes (OC) which are increasingly supplanted by self-compacting concretes (SCC) and high-performance concretes (HPC). Since no intensive vibration is required to mould structures from such concretes one can expect that they are much more homogenous along their thickness [7]. This will be known once the ongoing experimental research is completed.
REFERENCES
- T. Gudra and B. Stawiski, “Non-Destructive Strength Characterization of Concrete Using Surface Waves,” NDT&E International, Vol. 33, No. 1, 2000, pp. 1-6. doi:10.1016/S0963-8695(99)00028-6
- B. Stawiski and M. Stawiski, “Tests of Directional Characteristics of Ultrasonic Probes with Geometrically Defined Waveguides (in Czech),” NDT Welding Bulletin, Vol. 10, 2000, pp. 17-19.
- V. Dzenis, “Application of Ultrasonic Transducers with Point Contact in Nondestructive Testing (in Russian),” Zinatne Publishing House, Riga, 1987.
- N. Greig, “Concrete Core Strenght Testing,” Concrete Society, London, 1988.
- J. Hoła, K. Schabowicz and B. Stawiski, “Atypical Applications of Ultrasonic Method in Testing of Concrete Structures,” 9th European Conference on NDT.EC NDT, Berlin, 25-29 September 2006, DGZFP Proceedings BB 103-CD.
- B.Stawiski, “Ultrasonic Testing of Concrete and Mortar Using Point Probes (in Polish),” Wroclaw University of Technology Press, Wroclaw, 2009.
- J. Hoła and K. Schabowicz, “New Technique of Nondestructive Assessment of Concrete Strength Using Artificial Intelligence,” NDT&E International, Vol. 38, No. 4, 2005, pp. 251-259. doi:10.1016/j.ndteint.2004.08.002