Open Journal of Biophysics
Vol. 2 No. 4 (2012) , Article ID: 24140 , 4 pages DOI:10.4236/ojbiphy.2012.24017
Magnetic Field Intensity/Melatonin-Molarity Interactions: Experimental Support with Planarian (Dugesia sp.) Activity for a Resonance-Like Process
1Department of Biology, Laurentian University, Sudbury, Canada 2Behavioural Neuroscience Program, Laurentian University, Sudbury, Canada
3Biomolecular Sciences Program, Laurentian University, Sudbury, Canada
Email: mpersinger@laurentian.ca
Received September 20, 2012; revised October 20, 2012; accepted October 27, 2012
Keywords: Resonance; Planarian; Melatonin; Magnetic Fields; 7 Hz
ABSTRACT
Synergistic interactions between specific magnetic field intensities and chemical concentrations are challenging biophysical phenomena. Planarian were exposed to one of five different concentrations of melatonin and to a “geomagnetic”—patterned 7 Hz amplitude modulated magnetic field for 6 min once per hour for 8 hr during six successive nights. The peak average strengths were within the range (50 nT) or outside the range (200 nT) derived by the equation. As predicted by a resonance equation planarian displayed highly statistically significant decreased relative activity within the 50 nT, 10–7 to 10–6 M melatonin conditions compared to lower or higher concentrations. The effect explained about 30% of the variance in these changes of activity. Activity of planarian exposed to the same melatonin concentrations but to the 200 nT field did not differ significantly from each other or from those exposed to the 50 nT field in concentrations of melatonin <10–7 M or >10–6 M. These results suggest the existence of non-linear, “narrow-band” mechanisms involving the numbers of molecules within a distance determined by the boundary of the organism and the intensity of naturally-patterned magnetic fields derived from energy rather than force-based resonances.
1. Introduction
The traditional argument that the quantum of energy from weak (<1 mT), extremely low frequency (ELF or < 100 Hz) electromagnetic (EM) fields is less than the average energy of thermal noise (the kT restraint) and hence cannot be biologically effective has been challenged [1]. According to Binhi and Rubin [2] the kT constraint is applicable to dead or simple inanimate systems near thermal equilibrium. Biological systems are typically not in thermal equilibrium. There have been a variety of biophysical mechanisms postulated by which externally applied low intensity, ELF or biofrequency EM fields affect biochemical pathways, cellular physicology, and consequently the behavior of organisms. Several variations of classical inductive Faraday effects [3-5] and a large range of Larmor (cyclotron) resonance related processes [6-8] have been derived and either totally or partial validated by experimentation within specific contexts.
Given the myriad of application geometries, levels of measurement (from atomic to behavioral perspectives) and the emergent properties associated with each level of discourse [9], there is no a priori reason (except the principle of parsimony) to assume a singular mechanism should explain all of these phenomena. The purpose of the present study was to test the empirical validity of a model based upon resonance, magnetic energy and the molecular weight of the “target” molecule which involves an alternative approach to the problem. At the molecular level, special conditions are often required to observe weak ELF magnetic field effects. These special conditions include: 1) Optimal concentrations of pairs of radicals or ion-radicals [10]; 2) Specific kinetics of the entire system through binding impedance [11]; 3) Collective interactions of large ensembles of ions with the external field to overcome the “kT problem” of stochastic molecular forces of about 1.4 × 10⁻¹⁴ N [12]; and, 4) Tuning the coerced vibrational force on free ions within the channels and on either side of the plasma membrane through the ion’s attenuation coefficient (about 10–12 kg∙s–1) for movement [13].
The inconsistencies of the observed effects from applied ELF-EM fields may reflect an intrinsic nonlinearity much like the relationship between optimal KD values of a ligand for different subtypes of membrane receptors. That chemical systems are responsive to µT range, 60 Hz magnetic fields within a narrow band of a continuum of activity was shown by Blank and Soo [14]. For example when the control rate of oxidation of 10–7 mol of cytochrome C was about 1015 electrons/mg protein/min there was an increase in activity during the application of an ELF pulsed EM field. When the electron density was increased to 1016 electrons/mg protein/min there was no effect upon cytochrome C oxidation rate by the same field.
The consideration of the specific mass and concentration of the molecules involved with magnetic fieldmediated effects could be revealing. Vaughn and Weaver [15] showed that the accumulative number of molecules over time due to the applied field compared to other factors would allow information to be presented as signal-to-noise ratios. Magneto hydrodynamic theory [16] indicates that velocity is equal to B(uop)–1/2 where B is the magnetic field intensity, uo is the permeability of free space and p is mass density of charge carriers. For the tens of nanoTesla range and typical ion velocities in living tissues, the mass solution approaches the value of the proton. This is an important observation that indicates mobile protons in hydronium (H3O+) populations [17] within liquid water may be a major physical substrate for EM field effects. According to Preparata [18] water consists of two phases. One involves coherence domains with diameters in the order of 10–6 m where all molecules synchronously oscillate in the same phase while the other is the incoherent component where phases are random.
By shifting source equations from forces to energy Jacobson [19] altered the emphasis on resonance models from B = (f·2π·m)·q–1) to B = mc2·(vlq)–1 where, in addition to the usual variables of B (magnetic field strength), q (unit charge = 1.6 × 10⁻¹⁹ A·s), f(frequency) and m (mass), l became the length of the structure to which the field was applied, and, v was satisfied by the orbital velocity of the earth (~2.9 × 10⁴ m·s–1). By substituting the number of molecules associated with particular molarities and multiplying by the unit charge, appropriate dimensional solutions were obtained [20]. Although the inclusion of orbital velocity of the earth in the solution could be considered anomalous or even opportunistic, an appreciation for relativistic frameworks and intrinsic connections between macroand micro-spatial processes may be more important than assumed [21].
In the present study the “target” molecule was melatonin (C13H16N2O2, 232 Daltons), a multipotent molecule that is present in plants and animals [22]. The organism selected for study was the planarian [23]. Melatonin is synthesized from serotonin through two enzymatic sequences, primarily during the dark, and functions as a “scavenger molecule” for reactive oxygen species. The average concentrations of melatonin in planarian, for example, fluctuate during the day-night cycle range from 0.1 pM to 0.4 pM [24]. Assuming the measures of the average planarian by Okamoto et al. [25] as 6 mm for length, 0.15 mm for thickness and 0.5 mm for width (a volume of ~4.5 × 10⁻⁷ L) the functional concentration of melatonin would be ~2 × 10⁻⁷ M. If the modified procedure [20] for the Jacobson equation is applied, the equation predicts an optimal intensity of about 50 nT. Realistically assuming c = 1.9 × 10⁸ m∙s–1 in an aqueous medium [26] and the mass of a melatonin molecule (3.9× 10⁻²⁵ kg) , the numerator of the equation would be ~14 × 10–9 kg∙m2∙s–2 while the denominator would be ~28∙10–1 A∙m2 [from (2.9 × 10⁴ m∙s–1)∙(10–2 m)∙(1.6 × 10⁻¹⁹ A∙s)∙(10–7 M)∙(6.0 × 10²³ molecules·M–1)], resulting in a magnetic field strength in the range of ~50 nT.
The peak frequency would be around 7 Hz [20]. We obtained this value by setting mv2 = B∙q∙v∙l. When solved for Hz (1/s) the equation is f = (B∙q)/m. If the traditional ½ mv2 is employed, then the value would be twice the solution. The prime candidate in this model is the hydrogen atom. Consequently [(50 × 10–9 T)∙(1.6 × 10⁻¹⁹ A∙s)]/(1.66 × 10–27 kg) is ~5 Hz, and, when the factor of 2 is included, ~10 Hz. We selected 7 Hz based upon our previous research and the dominance of this value as the approximate fundamental for the Schumann resonance that is generated within the cavity between the ionosphere and earth’s surface. Presumably, living systems have been exposed to this intrinsic terrestrial frequency and its harmonics since abiogenesis [27].
We designed a series of experiments to test the validity of this equation and approach by maintaining planarian in different concentrations of ambient melatonin and exposing them to either the predicted intensity of magnetic field (50 nT) or a value beyond the maximum boundary of that prediction (200 nT). If the specific intensity and frequency magnetic field targeted a range of concentrations of melatonin through this resonance model and consequently enhanced the effect of melatonin we expected a diminishment of activity for planarian exposed to the 10–7 to 10–6 M melatonin concentrations when exposed to the 50 nT but not to the 200 nT field. Nonspecific quiescence (decreased activity) is the general effect of exogenously applied melatonin in most species. Hence, an optimal match between the concentration of melatonin and the applied magnetic field strength should augment this effect. Lower or higher concentrations of melatonin should not produce the diminished motility.
There are other experimental data that support our approach. Administration of exogenous melatonin [28] is known to suppress the symptoms of experimental allergic encephalomyelitis in Lewis rats. We [29,30] also found that Lewis rats in which experimental allergic encephalomyelitis had been induced and who were exposed nightly to 7 Hz, 50 nT magnetic fields displayed marked attenuation of both the clinical and neuropathological symptoms of this “multiple sclerosis” model. However clinical and neurohistological indicators of rats exposed to either a 7 Hz, 500 nT field or to 40 Hz, 50 nT or 500 nT fields did not differ significantly from sham field controls or animals exposed to <10 nT, 7 Hz fields.
Cell culture research has also supported the interaction between the molarity of the substance and the intensity of the applied field affecting the substance. For example, Gigert et al. [31] showed that the maximum induction of proliferation of cells when they were exposed to 1.2 µT 60 Hz fields occurred when tamoxifen concentrations were 10–6 M. When the modified Jacobson equation is applied to the molecular weight of tamoxefin, the optimal length for the 1.2 µT EM field and 10–6 M of this compound would be the width of a cell.
2. Materials and Methods
2.1. Planarian
Planarian (Dugesia sp.) were obtained from Carolina Biological Supplies and had been maintained in colonies of up to 100 in jars containing 300 cc of spring water (Feversham, Grey County, Ontario) within the laboratory for approximately a year before the initiation of the experiments. The ion content of the water was HCO3 270 ppm, Ca 71 ppm, Mg 25 ppm, SO4 5.9 ppm, Cl 2.7 ppm, NO3 2.6 ppm and Na 1 ppm. The planarians were fed with bovine liver weekly. Their vitality was indicated by the proliferation of the colonies [32].
2.2. Procedures
Only intact (non-injured, non-regenerating) worms were selected for the experiments. After being immersed in cold water, each worm was cut with a scalpel so there was either a decapitation or tail excision. Because the mean resistance in planarian increases from about 390 kOhms for nonregenerating worms to 470 kOhm within 3 d for regenerating worms [33], we reasoned this operation could also modulate alterations in charge carriers. Some worms were immersed in ice water for the same duration and served as controls. Following the dissection or sham-treatment worms were randomly assigned to one of five concentrations of (commercial grade for human use) melatonin. They were: 1) Spring water only, or, spring water containing; 2) 8.6 × 10⁻⁸ M; 3) 8.6 × 10⁻⁷ M, 4) 8.6 × 10⁻⁶ M; or, 5) 8.6 × 10⁻⁵ M of melatonin. The specific coefficients were the result of convenience from dilutions derived from the primary solution and because it best approximated the predicted values [20]. Three worms (one from each condition: decapitation, tail excision, control) were housed together in a cylindrical jar (5 cm diameter) containing 25 cc of one of the melatonin solutions. Total number of worms was 90.
2.3. Complex Magnetic Field Generating Equipment
The magnetic fields were generated within a Helmholtz coil (30 ohms, 20 AWG wire) that has been described previously [29,30]. The pattern of the magnetic field was produced by converting a column of numbers between 0 and 257 to –5 V to + 5 V (127 = 0 polarity) through a cus tom constructed digital-to-analogue converter. These values were controlled by a Zenith ZF 148-42 (Intel 8008 16 bit CPU with 4.7 MHz or 8 MHz operation) computer and custom designed software (Complex-2).
Each of the 5072 numbers (points) that composed the “geomagnetic pattern” of the magnetic fields occurred for 69 msec in order to produce a 7 Hz square wave magnetic field pattern that was amplitude-modulated from 0 nT to the maximum value set by the experimenter for 5 min and 50 sec intervals. This interval was presented automatically (and verified) through a batch file once every hour between midnight and 0706 hr during the night following the initiation of the regeneration/melatonin treatments and continued for 6 consecutive nights. Pilot studies indicated that the behavioral effects produced by the interaction between melatonin in the aqueous environment and the specific magnetic field parameters only occurred for nocturnal (no ambient light) but not daytime exposures.
A figure of this wave pattern has been published previously [29,30]. Each interval increased in sequential steps seven times during the first 3 min and 20 s and seven times during the final 1 min and 42 sec. The duration of each plateau was 14 s during the first cluster and 7 s during the last cluster. Consequently the frequency of the amplitude modulation was between 36 mHz to 71 mHz. The concept was derived from the average value and characteristics of sudden geomagnetic impulses. The amplitude of the maximum peak of the intensity was controlled by computer software and could range between 0 (sham field) to 900 nT as measured by a Metex multimeter and a magnetic sensor in the center of the coil. Additional details have been published [34].
According to the table in Persinger’s original theoreticcal paper [20] containing the values predicted from the modification of the Jacobson equation, the application of 10–7 M melatonin to a biological system of about 5 mm to 1 cm (the range in length of planarian) would require a field strength in the range of 10–7 to 10–6 T. A field strength of 35 to 70 nT at 7 Hz according to the modified equation solving for m from f = [Bq/m] suggests an optimal mass that is equivalent to a proton. Although a stronger (200 nT) field would optimally synergize with 10–8 M melatonin, it would not satisfy the requirements for a proton mass unit. Consequently we selected 50 nT and 200 nT as our two (peak) field intensities.
2.4. Quality Control and Mobility Measurements
Because only one worm from each regeneration treatment was housed in each jar, the specific morphology was equivalent to individual markers which allowed repeated measure analyses. Each planarian was removed carefully from its jar with a pipette and placed in the observation field. It was a 21 cm by 21 cm flat container filled with 5 mm of fresh spring water (220 cc). The bottom of the container was divided into 0.5 cm × 0.5 cm squares. The numbers of lines traversed in 2 min was employed to infer mobility.
The equation predicted a robust effect. We reasoned that its strength should exceed the variability associated with the normal distribution of the range in worm length and the different experimenters performing the same procedure. To test the latter assumption a total of 10 undergraduate students participated in measuring the worms’ activity; the students were unaware of the experimental conditions, that is, the study was completely “blind”. In order to insure quality control each student was trained by the first author. Intermittent assessments to verify maintenance of the prescribed procedures were completed. To observe changes related to phases of regeneration and circadian activity rhythms, worms were observed at approximately local noon and 22 hr throughout the week-long regeneration/treatment period (total of 15 observations for each of the 90 worms). There were two measures. The first was the relative change which was a single subtraction of last measurement from the initial measurement and divided by the initial measurement. The second was the standard deviation of the activity based upon the net difference in numbers of lines crossed for the day-time measurements compared to the previous night-time measurements for the five days. We employed the second measure because sometimes increased variability of responses is the primary measure of differential sensitivities of organisms exposed to the “same” treatment.
2.5. Statistical Analyses
The primary design was a three-way analysis of variance with three between (3 regeneration, 5 melatonin concentrations, 2 field intensities) conditions. Because there were 30 groups and 90 worms the three-way interactions were suppressed (and the dfs returned to the error or between subject pool) to minimize spurious effects. Post hoc tests (Tukey) were set at p < 0.05. We calculated omega2 estimates for each main effect. It is the amount of variance in the measure that is accommodated by the manipulation and is an indicator of the total “strength” of the effect. All analyses involved PC SPSS software.
3. Results
Analysis of variance revealed a statistically significant interaction [F(4,51) = 4.02, p < 0.05; omega2 = 29] between melatonin concentration and field intensity. As can be seen in Figure 1, there was no change in activity for planarian maintained within different concentration of melatonin and exposed intermittently to the 200 nT fields (all of the standard errors of the means range overlapped). However the planarian exposed to the 50 nT field and the 10–7 to 10–8 M melatonin but not the water, 10–8 M or 10–5 M magnetic fields, showed a marked decrease in activity compared to all other groups of treatments. Post hoc analysis verified the source of the interaction was due primarily to the greater discrepancy in movement (by a factor of 2) between the 50 nT (10–8 T), 7 Hz intensity for planarian within the 10–7 M environment and the other groups.
The interactions between the condition of the planarian (decapitated, tail excised, or sham treatment) and field intensities approached statistical significance for variability in movement [F(2,85) = 2.40, p < 0.10]. Post hoc analysis indicated there was a discrepancy between the activity for the worms that had been decapitated (the tails) and exposed to either the 50 nT (lower) or 200 nT field while this intensity difference did not occur for worms that had been tail excised (heads) or sham-cut.
The variability (standard deviation) in the circadian change in movement is shown in Figure 2. The mean of the mean changes over the five days was 2.3 with a range of –15 to 16 units while the mean of the standard deviation was 12 (range 0 to 40). There was a statistically significant [F(4,85) = 2.72, p < 0.05] interaction between melatonin concentration and field strength. As predicted the most conspicuous difference between the 50 nT and 200 nT exposures occurred for planarian that were also living in water that contained 10–7 M of melatonin. Again there were no significant differences in variability in activity for worms exposed to any of the melatonin concentrations and the 200 nT fields.
4. Discussion and Conclusions
There have been many mechanisms by which weak, natural intensity, time-varying magnetic fields have been postulated to affect chemical reactions, molecular pathways, and biological systems. Most of these mechanisms involve variants of Faraday induction [3-5] or Larmor resonance [6-8] and have all been shown to be applicable and verifiable in specific contexts. They are also based upon concepts derived from force rather than energy, per se. The Jacobson equation [19,20] which included the mass of the molecule and the length of the boundary to which the field is applied (in these experiments, the organism) could reveal another perspective by which biomagnetic interactions could be studied.
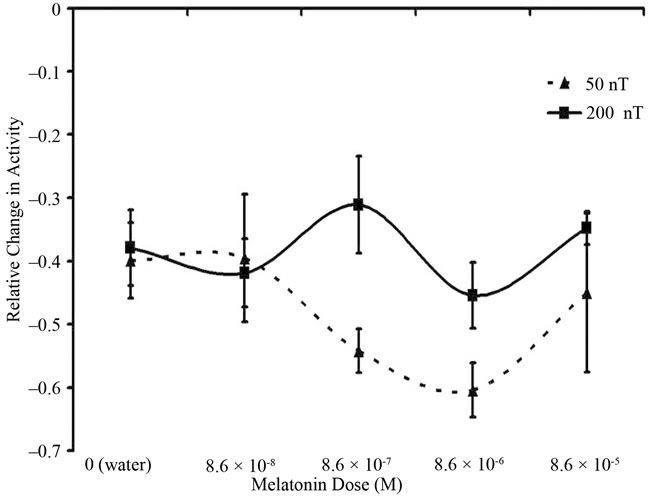
Figure 1. Relative change in activity between the beginning and end of the exposures for planarian that had been exposed to either the 50 nT or 200 nT, 7 Hz amplitudemodulated magnetic field configuration and simultaneously to one of five concentrations of melatonin. Vertical bars indicate SEMs.
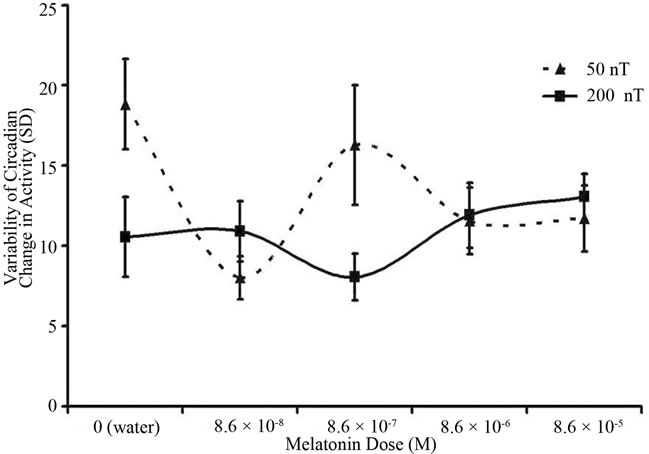
Figure 2. Average variability (as reflected by standard deviations) of circadian change in activity over five days for planaria exposed to either the 50 nT or 200 nT, 7 Hz amplitude-modulated magnetic field and simultaneously to one of five different concentrations of melatonin in the aqueous environment. Vertical bars indicated standard error of the mean (SEM).
In this experiment we found that the most significant “synergistic response” of planarian movement occurred with the predicted combination of melatonin within the 10–7 M range and the 10–8 T, 7 Hz range, amplitude modulated magnetic fields. Planarian exposed to this combination showed the greatest decrease of relative change in movement over time from baseline. Decreased activity upon the system is the usual effect of melatonin. Because each planarian was employed as its own control the possible artefact from batch or group differences was minimized. The strength of the effect, even though a specific length was assumed for the calculation of the optimal field intensity, was evident even with the expected attenuation by the range in the planarians’ lengths.
The employment of the variability measure in activity between nocturnal and diurnal activity was even more revealing and congruent with the resonance predictions. Variability in measurements within groups of organisms is often the first indicator of differential sensitivity of the population or its temporal responses. As noted in Figure 2, there were only two conditions associated with greater variability. They occurred only in the 50 nT field condition for the 10–7 M and the water only (the vehicle) condition. These peaks did not occur for the 200 nT fields. Because the natural or endogenous concentration of melatonin planarian during the night and day vary between 0.1 and 0.4 pM (equivalent to the 10–7 M range) we suggest that this specific enhancement of variability in planarian day-night activity in this condition was due to the effects of the 50 nT field upon these organismic concentrations.
The present results are congruent with the non-linear intensity and frequency effects within the biofrequency range reported by many other researchers. For example Cook et al. [29,30] found that the same 7 Hz, nocturlly-applied, amplitude-modulated field (generated by different equipment than the present study) at 50 nT attenuated a Lewis rat variant of multiple sclerosis whereas rats exposed to either 7 Hz-500 nT, 40 Hz-50 nT, or 40 Hz-500 nT exposures did not differ from sham-field controls. Malagoli et al. [35] found that 50 Hz magnetic fields activated an alternative “stress pathway” in invertebrates but required intensities above 400 µT. More natureally-patterned magnetic fields could require less intensity to produce similar effects.
There should be quantitative convergence between molarity, energy, and frequency that is consistent within the organism across levels of discourse. Assuming ~0.4 pmol of peak melatonin per planarian as shown in Itoh et al. [24] there are 2.4 × 10¹¹ molecules of this compound per organism. The magnetic energy from a change of 50 nT, calculated from B2/[2∙π∙uo] requires a multiplication by volume. Assuming a volume of 1.1 × 10⁻¹¹ m3 [25] for the ganglia (“brain”) for an average planarian, the energy would be 1.1 × 10⁻²¹ J or about 0.5 × 10⁻³² J per molecule. The equivalent frequency for this energy per molecule, obtained by dividing by Planck’s constant, is 7 Hz which is the both the fundamental frequency of the applied field and the resonance solution for a proton [20]. In addition, the energy for a ∆50 nT magnetic field within the volume of a planarian ganglion (1.1 × 10⁻¹¹ m3) is about 1.1 × 10⁻²¹ J. The equivalent frequency is 0.16 × 10¹³ Hz or a wavelength of about 200 µm which is well within the range of the length of the ganglion. Although such relationships must be experimentally verified, the convergence is congruent with the proposed mechanism.
5. Acknowledgements
We thank Professor Stan Koren for modifying the computer software and exposure equipment and to Lucas Tessaro for technical comments. Special thanks to the following students in the 2009 Neuropsychopharmacology class for their contributions: V. Charette, J. Ahonen, C. Keaney, S. Thompson, L. Meltz, N. Murugan, A. Forget, A. Clement, M. Rossini and M. MacDonald.
REFERENCES
- M. Cifra, J. Z. Fields and A. Farhadi, “Electromagnetic Cellular Interactions,” Progress in Biophysics and Molecular Biology, Vol. 105, No. 3, 2011, pp. 223-246. doi:10.1016/j.pbiomolbio.2010.07.003
- V. Bini and A. Rubin, “Magnetobiology: The kT Paradox and Possible Solutions,” Electromagnetic Biology and Medicine, Vol. 26, No. 1, 2007, pp. 45-62. doi:10.1080/15368370701205677
- W. R. Adey, “Tissue Interactions with Nonionizing Electromagnetic Fields,” Physiological Reviews, Vol. 61, No. 2, 1981, pp. 435-513.
- S. Engstrom and R. Fitzsimmons, “Five Hypotheses to Examine the Nature of Magnetic Field Transduction in Biological Systems,” Bioelectromagnetism, Vol. 20, 1999, pp. 423-430. doi:10.1002/(SICI)1521-186X(199910)20:7<423::AID-BEM3>3.0.CO;2-W
- J. C. Weaver, T. E. Vaughn and G. T. Martin, “Biological Effects Due to Weak Electric and Magnetic Fields: The Temperature Variation Hypothesis,” Biophysics Journal, Vol. 76, No. 6, 1999, pp. 3026-3030. doi:10.1016/S0006-3495(99)77455-2
- H. W. Ludwig, “A Hypothesis Concerning the Absorption Mechanisms of Atmospherics in the Nervous System,” International Journal of Biometeorology, Vol. 12, No. 2, 1968, pp. 93-98.
- A. R. Liboff, “Cyclotron Resonance in Membrane Transport,” In: B. Norden and C. Ramel, Eds., Interaction Mechanisms of Low Level Electromagnetic Fields and Systems, Oxford Press, Oxford, 1992, pp. 130-147.
- V. V. Lednev, “Possible Mechanisms for the Influence of Weak Magnetic Fields on Biological Systems,” Bioelectromagnetism, Vol. 12, No. 2, 1991, pp. 71-75. doi:10.1002/bem.2250120202
- M. A. Persinger, “On the Nature of Space-Time in the Perception of Phenomena in Science,” Perceptual and Motor Skills, Vol. 88, 1999, pp. 1210-1216. doi:10.2466/PMS.88.3.1210-1216
- A. L. Buchachenko, D. A. Kuznetov and V. L. Berdinsky, “New Mechanisms of Biological Effects of Electromagnetic Fields,” Biophysics, Vol. 51, No. 3, 2006, pp. 545-552. doi:10.1134/S0006350906030249
- A. A. Pilla, D. J. Muehsam, M. S. Markov and B. F. Sisken, “EM Signals and Ion/Ligand Binding Kinetics: Prediction of Bioeffective Waveform Parameters,” Biolectrochemistry and Bioenergetics, Vol. 48, No. 1, 1999, pp. 27-34. doi:10.1016/S0302-4598(98)00148-2
- J. M. Mullins, T. A. Litovitz, M. Penafiel, A. Desta and D. Krause, “Intermittent Noise Affects EMF-Induced ODC Activity,” Bioelectrochemistry and Bioenergetics, Vol. 44, No. 2, 1998, pp. 237-242. doi:10.1016/S0302-4598(97)00073-1
- D. J. Pangopoulous, A. Karabarbounis and L. H. Margaritis, “Mechanisms for the Action of Electromagnetic Fields on Cells,” Biochemical and Biophysical Research Communications, Vol. 298, No. 1, 2002, pp. 95-102. doi:10.1016/S0006-291X(02)02393-8
- M. Blank and L. Soo, “Enhancement of Cytochrome Oxidase Activity in 60 Hz Magnetic Fields,” Bioelectrochemistry and Bioenergetics, Vol. 46, No. 1, 1998, pp. 139-143. doi:10.1016/S0302-4598(98)00126-3
- T. E. Vaughn and J. C. Weaver, “Molecular Change in Signal-To-Noise Ratio Criteria for Interpreting Experiments Involving Exposure to Biological Systems to Weakly Interacting Electromagnetic Fields,” Bioelectromagnetism, Vol. 26, No. 4, 2005, pp. 305-322. doi:10.1002/bem.20094
- T. Alvager and M. M. Moga, “Magnetohydrodynamic Wave Resonance and the Evocation of Epileptiform Activity by Millitesla Magnetic Fields,” International Journal of Neuroscience, Vol. 90, No. 1-2, 1997, pp. 99-104. doi:10.3109/00207459709000629
- T. E. Decoursey, “Voltage-Gated Proton Channels and Other Proton Transfer Pathways,” Physiology Reviews, Vol. 83, No. 2, 2002, pp. 475-579.
- G. Preparta, “QED Coherence in Matter,” World Scientific, New York, 1995.
- J. I. Jacobson, “Pineal-Hypothalalmic Tract Mediation of Picotesla Magnetic Fields in the Treatment of Neurological Disorders,” Pan Nerva Medicine, Vol. 36, 1994, pp. 201-205.
- M. A. Persinger, “A Potential Multiple Resonance Mechanism by which Weak Magnetic Fields Affect Molecules and Medical Problems: The Example of Melatonin and ‘Multiple Sclerosis’,” Medical Hypotheses, Vol. 66, No. 4, 2006, pp. 811-815. doi:10.1016/j.mehy.2005.09.044
- M. A. Persinger, S. A. Koren and G. F. Lafreniere, “A Neuroquantological Approach to How Human Thought Might Affect the Universe,” Neuroquantology, Vol. 6, 2008, pp. 262-271.
- R. Hardeland, “New Actions of Melatonin and Their Relevance to Biometeorology,” International Journal of Biometeorology, Vol. 41, 1997, pp. 47-47. doi:10.1007/s004840050053
- E. R. Butarelli, C. Pellicano and F. Pontieri, “Neuropharmacology and Behavior in Planarians: Translations to Mammals,” Comparative Biochemistry and Physiology Part C, Vol. 147, 2008, pp. 398-408.
- M. T. Itoh, T. Shinozawa and Y. Sumi, “Circadian Rhythms of Melatonin-Synthesizing Enzyme Activities and Melatonin Levels in Planarians,” Brain Research, Vol. 830, No. 1, 1999, pp. 165-173. doi:10.1016/S0006-8993(99)01418-3
- K. Okamato, K. Takeuchi and K. Agata, “Neural Projection in Planarian Brain by Fluorescent Dye Tracing,” Zoological Science, Vol. 22, 2005, pp. 535-546. doi:10.2108/zsj.22.535
- M. A. Persinger, “10−20 J as the Neuromolecular Quanta in Medicinal Chemistry: An Alternative to the Myriad of Molecular Pathways,” Current Medicinal Chemistry, Vol. 17, 2010, pp. 3094-3098. doi:10.2174/092986710791959701
- F. E. Cole and E. R. Graf, “Precambrian ELF and Abiogenesis,” In: M. A. Persinger, Ed., ELF and VLF Electromagnetic Field Effects, Plenum Press, New York, 1974, pp. 243-275. doi:10.1007/978-1-4684-9004-6_9
- J. C. Kang, M. Ahn, Y. C. Kim, C. Moon, Y. Lee, M. B. Wie, Y. Lee Jr. and T. Shin, “Melatonin Ameliorates Autoimmune Encephalomyelitis through Suppression of Intercellular Adhesion Molecule-1,” Journal of Veterinarian Sciences, Vol. 2, 2001, pp. 85-89.
- L. L. Cook, and M. A. Persinger, “Suppression of Experimental Allergic Encephalomyelitis Is Specific to the Frequency and Intensity of Nocturnally Applied, Intermittent Magnetic Fields,” Neuroscience Letters, Vol. 292, 2000, pp. 171-174. doi:10.1016/S0304-3940(00)01454-3
- L. L. Cook, M. A. Persinger and S. A. Koren, “Differential Effects of Low Frequency, Low Intensity Nocturnal Magnetic Fields upon Infiltration of Mononuclear Cells and Numbers of Mast Cells in Lewis Rats,” Toxicology Letters, Vol. 118, No. 1-2, 2000, pp. 9-19. doi:10.1016/S0378-4274(00)00259-9
- R. Geigert, H. Schimming, W. Koerner, C. Gruednker and V. Hanf, “Induction of Tamoxifen Resistance in Breast Cancer Cells by ELF Electromagnetic Fields,” Biochemical and Biophysical Research Communications, Vol. 336, 2005, pp. 1144-1149. doi:10.1016/j.bbrc.2005.08.243
- N. Gang and M. A. Persinger, “Planarian Activity Differences When Maintained in Water Pre-Treated with Magnetic Fields: A Non-Linear Effect,” Electromagnetic Biology and Medicine, Vol. 30, 2011, pp. 198-204. doi:10.3109/15368378.2011.587928
- R. P. Bell and B. Shirely, “Changes in Resistance Across Planarians during Regeneration,” Proceedings of the Oklahoma Academy of Sciences, Vol. 58, 1978, pp. 1-3.
- M. A. Persinger, C. A. O’Donovan, B. E. McKay and S. A. Koren, “Sudden Death in Rats Exposed to Nocturnal Magnetic Fields That Simulate the Shape and Intensity of Sudden Geomagnetic Activity,” International Journal of Biometeorology, Vol. 49, No. 4, 2005, pp. 256-261. doi:10.1007/s00484-004-0234-2
- D. Malagoli, F. Gobba and E. Ottaviani, “Effects of 50- Hz Magnetic Fields on Signalling Pathways of fMLPInduced Changes in Invertebrate, Immunocytes: The Activation of the Alternative ‘Stress Pathway’,” Biochemica and Biophysica Acta, Vol. 1620, 2003, pp. 185-190. doi:10.1016/S0304-4165(02)00531-7