Open Journal of Biophysics
Vol.2 No.2(2012), Article ID:18921,10 pages DOI:10.4236/ojbiphy.2012.22007
Investigation of the Effect of Ambient Temperature and Geomagnetic Activity on the Vascular Parameters of Healthy Volunteers
1Establishment of the Russian Academy of Sciences, Space Research Institute (IKI RAS), Moscow, Russia
2Scientific Medical Center JSC “Russian Railways”, Moscow, Russia
3Establishment of the Russian Academy of Sciences, Institute of Theoretical and Experimental Biophysics (ITEB RAS), Pushchino, Moscow, Russia
Email: breus36@mail.ru, yugurf@yandex.ru, zench@mail.ru
Received January 7, 2012; revised February 15, 2012; accepted February 24, 2012
Keywords: Vascular Parameters; Geomagnetic Disturbances; Meteorological Factors
ABSTRACT
Aim of this paper is to reveal whether the geomagnetic activity (GMA) and meteorological factors (MFs) affect vascular parameters of healthy volunteers. As a trial study we used new device “Tonocard,” and new vascular parameters for study—a pulse wave velocity (PWV) and an endothelial function (EnF) in addition to blood pressure measurements. These parameters never investigated before in such aspects. As far as novelty of device itself and investigated parameters we limited ourselves by monitoring only four healthy volunteers (without cardiovascular pathology). To analyze the sensitivity of their aforementioned medical indices to GMA and MFs two independent mathematical approaches were used, one of whom is based on traditional methods of mathematical statistics and the other on the theory of pattern recognition Dependence of physiological characteristics on the atmospheric temperature, revealed by both applied mathematical approaches, showed complex non-linear character of biological replies: the reaction has a different form in different temperature ranges and is manifested in the form of synchronization of slow variations of physiological and atmospheric parameters (trends) with a period of several days, while the daily variations were virtually independent. The systolic blood pressure (SBP), PWV and a difference between two specially selected values of PWV (DPWV) are approximately equally depending on atmospheric temperature, which accounts for an average of 26% to 28% of their variations. Sensitivity to the GMA for this test was found only for PWV.
1. Introduction
The influence of weather factors—atmospheric pressure and temperature, and the geomagnetic activity on the development of cardiological pathologies has been intensively studied over last two-three decades (see examples: [1-5]). In Moscow over the recent years investigations have been conducted on the evaluation of the influence of temperature conditions and the quality of atmospheric air on the indices of mortality in the population [6].
Investigations conducted in 12 cities of the USA have shown that hospitalization of patients with heart diseases and especially patients with myocardial infarction at an age of 65 and older monotonically increases simultaneously with the growth of temperature in cities with hot and cold climate [7]. At the same time a group of European researchers analyzing the influence of summer and winter extreme temperatures on the growth of morbidity of patients with cardiovascular and cerebral pathology in 12 cities does not confirm the presence of any effects in the short term perspective [8].
In our earlier studies reactions of healthy people to the GMA were analyzed, based on Holter monitoring of heart rate (HR) and blood pressure (BP) [9-11] and a general nonspecific adaptive stress-response (increasing of HR, stabilization of HR variability and increasing number of arrhythmic heart contractions) was observed in the periods of magnetic storms. This reaction followed by the specific response to the magnetic storms associated with regulation of a vascular tone (similar to meteotropic responses) [12].
Apparently human reaction on variations of GMA and meteorological factors (MF) could manifest itself in a different way. The BP and HR perhaps are important medical parameters in this effect development; however they are not the only.
For this reason, we decided to study a number of other indicators of the state of cardiovascular system, which could be potentially sensitive to the effects of GMA and MFs.
The earlier studies established that reaction of human organism on GMA was following by blood coagulation, rise in blood viscosity and deterioration of microcirculation parameters [13]. The revealed deterioration of a capillary blood flow, apparently, is caused by deterioration of endothelium function. The endothelium is a singlelayered layer of cells covering an internal surface of blood and lymphatic vessels, which continuously produce biologically active substances, regulating a vascular tone, behavior of blood cells in a vascular channels and many other important functions without which the human body couldn’t exist normally [14]. These cells are called endothelial cells and their function named an endothelial function EnF.
Another very important parameter for cardiovascular system of human organism is arterial stiffness. Arterial stiffness has independent predictive value for cardiovascular events. Pulse wave velocity (a speed of successive arterial vessel walls contractions) (PWV) is a measure of arterial stiffness. As it is established in a large number of studies, the aortic wall stiffness defined by the PWV, in most cases leads to growth of arterial pressure because it raises loading on the left ventricle of heart. Aortic pulse wave velocity is an independent predictor of coronary heart disease and stroke in apparently healthy subjects (Studies by European cohorts [14-17]).
Thus the main vascular parameters which we decided to study are the pulse wave velocity (PWV), endothelial function (EnF) and blood pressure (BP).
As the equipment for these trial studies a new device “Tonocard” was used. It is specifically designed by AMDT LTD (Russia) to perform noninvasive measurements of aforementioned arterial vascular parameters.
Preliminary testing of “Tonocard” in clinical studies (75 participants) revealed tiny processes in vascular parameters reaction at early stages of arterial hypertension [18].
The PWV and the EnF parameters never investigated before in aspect of influence of meteorological and geomagnetic factors on them. As far as novelty of device itself and parameters under investigation we limited ourselves as the first step by monitoring only four healthy volunteers (without cardiovascular pathology). In result of our trial investigation we started now to collect data of seven additional volunteers in the Central Clinical Hospital JSC “Russian Railways”, Moscow, Russia.
The aim of this study is to reveal whether the geomagnetic activity and meteorological factors affect the pulse wave velocity, endothelial function, and blood pressure of individual humans.
2. Material and Methods
Our study is based on data of four healthy volunteers—3 of them are physicians—members of staff of the Central Clinical Hospital N1 JSC “Russian Railway” and one of them is a scientist from the Space Research Institute (see Table 1). All of them are non-smoker, not allergic and having normal body mass.
Data were collected during almost four years monitoring (December 2006 - October 2010) mainly in the morning hours from 9.00 till 11.00. Measurements had casual character and depend basically on an opportunity to make them. However practically for each except No 4 of monitored volunteers we have data of permanent daily measurements over approximately at least month. The device “Tonocard” includes specially developed highsensitivity sensors, placed in the projection of brachial artery and arteries of a wrist (radial and ulnar). All measurements have been executed on a hand (Figure 1).
The hand settled down at a level of heart. One cuff settled down at a level of a shoulder, another at a level of a wrist. Pressure from cuffs was transferred to sensitive gauges inside the device. The received data with the help of the electronic circuit were transformed to an electric signal The distance between brachial artery and arteries of a wrist (L) was measured and registered by computer. Time (∆t) for which pulse wave (successive arterial vessel walls contractions) pass this distance is determining automatically. The meaning of PWV was determined as ratio L/∆t and usually includes 5 - 7 successive readings. For endothelial function determination we used the technique, which provokes the release of nitric oxide (NO) by endothelium, resulting in vasodilatation of arteries that can be qualify as an index of endothelial function. For measurement we applied proximal (brachial) and distal (wrist) cuffs connected with sensitive sensors contained by “Tonocard”. Then during 20 - 30 sec the device automatically records pulse wave amplitudes from arteries of wrist (approximately 25 - 35 pulse waves). After this the brachial cuff is inflating up to 170 - 190 mm Hg (in dependence of level of systolic blood pressure of subject, the pressure in a distal cuff must exceed its average level not more than on 30 - 40 mm Hg). This pres-
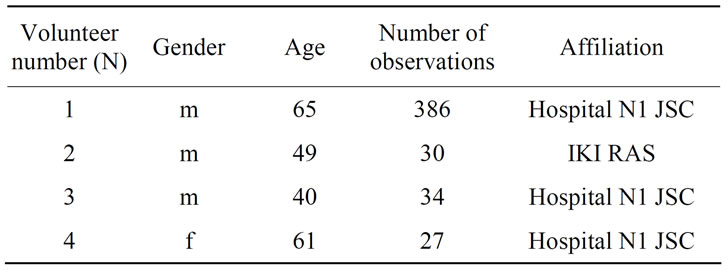
Table 1. Characteristics of volunteers (age is given in beginning of measurements).
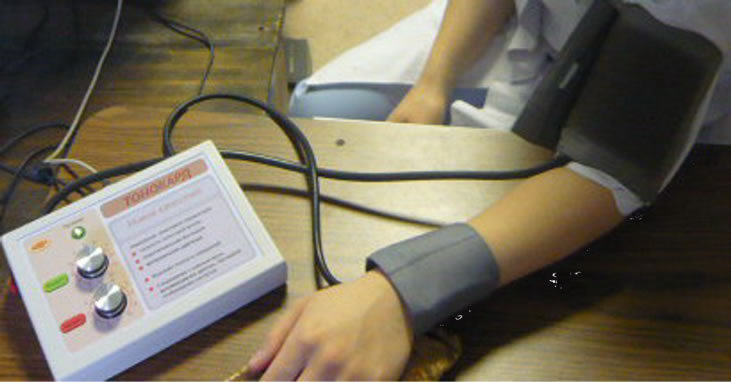
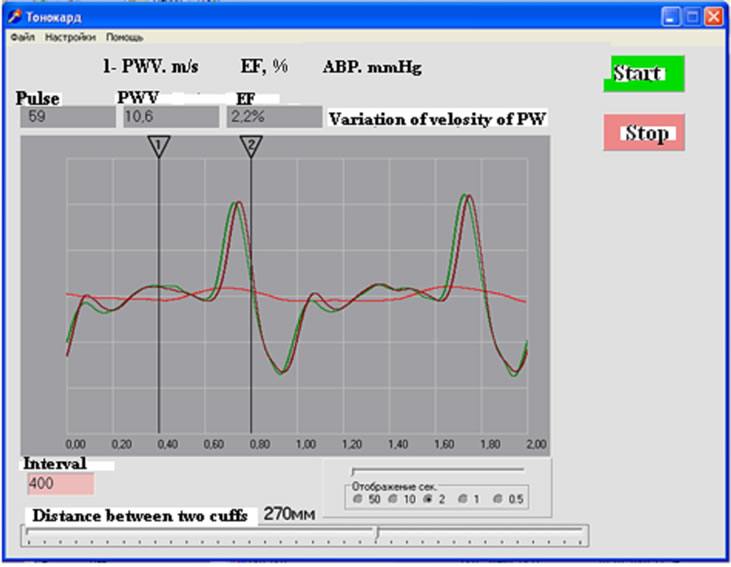
Figure 1. Overview of “Tonocard” and procedure of measurements and registration on computer.
sure is automatically maintaining in brachial cuff during 3 min compressing. After that brachial cuff is deflating and then automatically is going on the measurement of the pulse wave amplitude of the wrist’s arteries. Special computer program is comparing obtained results of pulse wave’s amplitude with initial one in percentage. The Dampl characterizes the endothelial function. In norm the endothelial function for the middle-aged people, determined by “Tonocard” is 60% [18]. The higher is this amplitude the better is endothelial function.
Simultaneously with measurements of EnF we determined DPWV as difference between initial value of PWV and its value measured after 3 min test with compressing of brachial artery. This parameter characterizes the ability of vascular wall endothelium to produce NO, and on the other hand reflects a degree of its elasticity and peripheral resistance of small arteries. Our preliminary study revealed significant deterioration of the DPWV at hypertensive patients. The higher is modulus of DPWV the higher is degree of elasticity of endothelium and its ability to produce NO, i.e. vasodilatation of small arteries.
Two blood pressure measurements were realized using other arm after 15 - 20 sec the endothelial function test. This semi-automated technique gives a possibility to reduce participation of an operator to minimum.
Thus we shall study dynamic (daily variations) of four biological parameters: systolic blood pressure (SBP), pulse wave velocity (PWV), DPWV and Dampl and their dependence from meteorological and geomagnetic factors.
Data on daily values of level of planetary geomagnetic activity (GMA), expressed by the Kp-index (the sum of eight three-hour values) and daily average values of Apindex has been received from the Internet site ftp://ftp.ngdc.noaa.gov/STP/GEOMAGNETIC_DATA/INDICES/KP_AP.
Values of meteorological parameters—atmospheric temperatures (T) and pressure (P) in Moscow are received from site http://meteo.infospace.ru. Few omissions of three-hour values of meteorological parameters have been filled by means of procedure of linear interpolation then daily average values of the atmospheric pressure and temperature have been calculated.
For this trial study two mathematical approaches have been applied in order to get significant results on sensitivity of a hemodynamics to combined influence of the GMA and the MFs: we applied traditional statistical analyses (TSA) [5] like correlation analyses, analyses of variance and superposed epochs and DNNGO (Dynamic Nearest Neighborhood with Gain Optimization).
TSA was used for estimation of personal sensitivity to the GMA and the MFs on the basis of fairly short time series of results of individual observations (30 - 100 values). Statistical algorithm was formed by taking into account the peculiarities of the physiological response and the statistical properties of the experimental data (shortness of series, unsteadiness, and a lot of omissions) and aimed to construct multi-dimensional picture of the individual physiological response.
As has previously been repeatedly shown the physiological response of the human organism can be delayed with respect to variations of external factors on up to three days, so the cross-correlation function was calculated in the range of shifts ±8 days. If significant correlations were found in the range from –1 to +3 days among them, the one of them that has maximum modulus, was choose and corresponding time shift was considered as a “time of development of reaction”. Linear (Pearson, rp) or rank (Spearman, rs) correlation coefficient was calculated for given estimates of the statistical characteristics of time series according to the Jarque-Bera test.
Reaction of organism to the action of external factors is not linear, so the identification of a linear relationship (correlation analysis) does not always show the presence of the effect. Therefore the method of superposed epochs as well as the method of variance analysis can be used. The first method shows an evolution in time of the average values of the external parameters in the vicinity of the days of increased values of physiological parameter, the second gives an estimation of average amplitude of change of the physiological parameter when external factor’s parameters were above and below some threshold value. The whole array of physiological data is divided into two samples by the criterion of the corresponding values of an external factor (above and below a certain threshold). In case the significance of differences in sampling distributions obtained at the level of p < 0.05 by Wilcoxon test, the difference of the medians of the distributions A = m2 – m1 is regarded as the amplitude of the changes under the influence of this external factor.
The application of pattern recognition to DNNGO method offered by [19] is based on the theory of local approximation [20,21] and Neiman principles of statistical hypotheses validation [22]. In this study, this method has been used to calculate the relative percentage of cases of excess the average level by each physiological parameter as a result of specified action of combinations of environmental factors such as atmospheric pressure (P), temperature (T), and Kp-index of geomagnetic activity separately (one-dimensional analysis) or their pair combinations (two-dimensional analysis). The fundamental principle of this method is to find a critical region, where the expectation of the excess by the response of an average value is maximal. The optimization of the control parameters of the algorithm was carried out by genetic—branching algorithms for finding a global minimum. The relative total excess by the studied physiological parameter of its average value when the characteristics enter into the critical region in relation to the total excess by the physiological parameter of its average value in all the cases available in the database was taken as the efficacy of the given combination of environmental parameters (biotropicity).
The DNNGO method provides a variant of nonlinear dependence that is optimized in the cross-validation context. This means that testing on the available database yields the smallest average error of recovery of the explained variable, e.g., systolic arterial blood pressure (SBP) or PWV, under the condition that its measured value is not available for the algorithm in the process. Thus, we can avoid the situation when the quality of recovery is checked on the data that have been already involved in the recovery process.
The second feature of DNNGO is the possibility of analyzing the contribution that a given combination of explanatory variables makes to the dynamics of the explained variables based on counting the average successfully predicted excess by the explained variable of its average value relative to the same value, which is calculated on the part of the database where there was such an excess. This method allows us to recover the biotropicity of the GMA and MFs within a nonlinear approach. In contrast with TSA method DNNGO indented to reveal dependencies of common type without suggestions on interline models (linear, polynomial etc.). However, DNNGO can deal with sufficiently long database, because local methods of dependence recovery and crossvalidation required long time series. This why this method have been applied mainly to analysis of data of volunteer N 1.
Unfortunately, time series lengths of other three volunteers are insufficient for DNNGO application. Besides, time series for DPWV and Dampl of volunteer 4 contain only 10 points, that why their dependence from atmospheric factors and GMA can not be estimated even by TSA method.
3. Results and Discussion
3.1. The Relationship between the Physiological Parameters and Separate External Factors (One-Dimensional Analysis)
Results of the analysis of sensitivity of the measured physiological parameters to action of the separate external factors, received by both methods—TSA and DNNGO —have shown coincident results concerning presence of dependence and its sign. We determine some external factor (or combinations of factors) as biotropic if percentage of dispersion for the physiological parameter can be explained by the given factor.
3.1.1. Dependence of SBP, PWV and DPWV for Volunteer N 1 on Atmospheric Temperature T
Results of dependence on atmospheric temperature for SPB, PWV and DPWV, obtained by DNNGO, are shown in the left column of Figures 2(a), (c), (e).
In order to check by TSA these dependences the data sets of SPB, PWV and DPWV have been divided into three samples corresponding different temperature ranges Into each temperature range coefficients of linear regression (y = a + b × x, as well as standard error (s) and significance (F) of b were calculated). Results are shown at Figures 2(b), (d), (f) and in Table 2.
The systolic blood pressure (SBP) depending on temperature is generally negative (Figures 2(a), (b)). Character of dependence is nonlinear, level of SBP authentically goes down for T > 15˚C and for temperature interval Т < 5˚C. In the interval –5˚C < T < 15˚C an authentic dependence the SBP on temperature isn’t present.
The PWV dependence on temperature T recovered by DNNGO is shown at Figure 2(c). The PWV increases with increasing temperature up to –15˚C to –18˚C, with a further increase of T the temperature dependence disappears. The temperature dependence for the PWV obtained by TSA (Figure 2(d)) is quite similar.
In case of DPWV reflecting changes in PWV after
 (a)
(a) (b)
(b)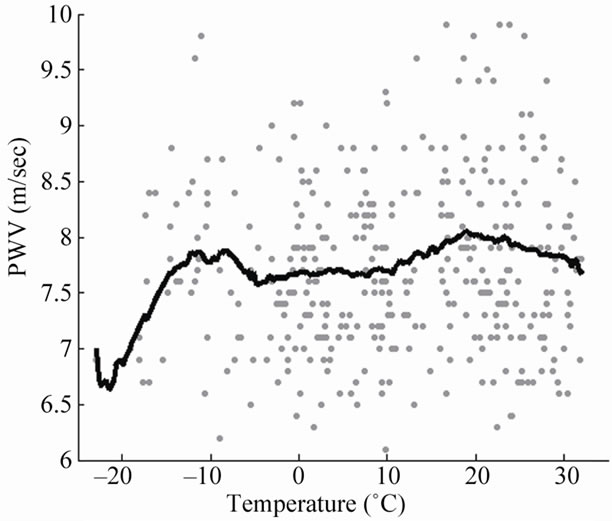 (c)
(c) (d)
(d)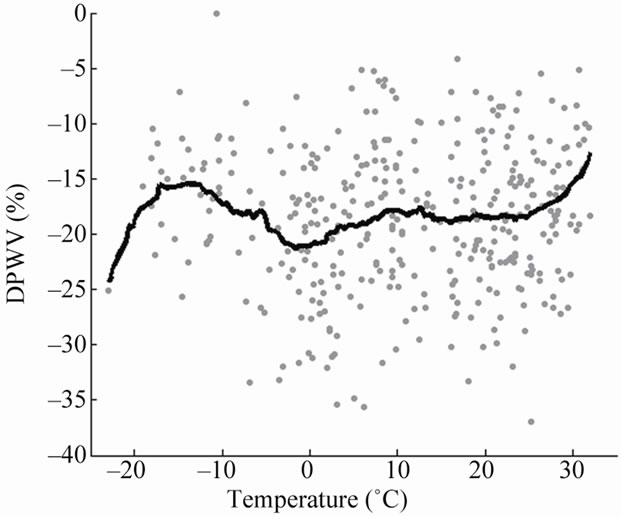 (e)
(e)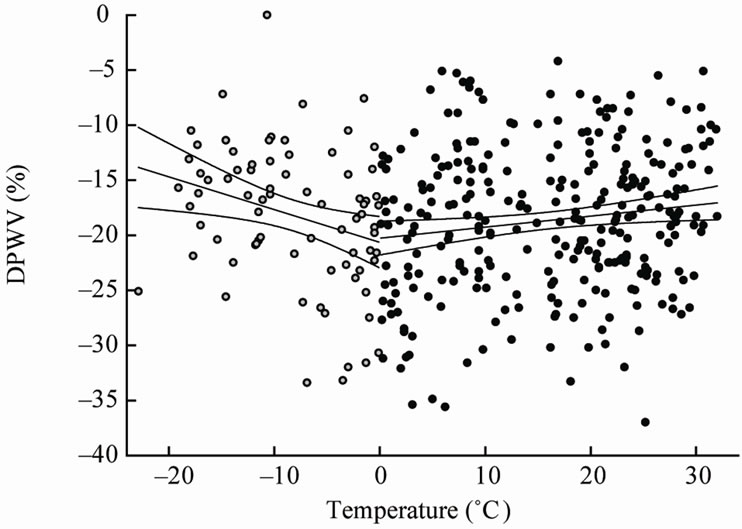 (f)
(f)
Figure 2. The SBP, PWV and DPWV dependences on temperature T obtained using DNNGO (left column) and TSA (right column) for volunteer 1. For TSA lines of linear regression and their 95% confidential levels are shown.
hyperemia (Figures 2(e), (f)) we have biphasic dependence by TSA (Figure 2(f)) and more complex curve by DNNGO (Figure 2(e)), but the main tendencies, obtained by two methods (decrease at T < 0˚C and increase at T > 0˚C) coincide.
From Table 2 and Figure 2 it is visible that results of the TSA are in a good agreement with the conclusions received by DNNGO method.
The more accurate definition of T-dependence of physiological parameters by TSA leads to the situation when calculation of correlation coefficients within smaller temperature ranges becomes incorrect owing to considerable dispersion of physiological parameters.
3.1.2. Dependence of SBP, PWV, DPWV and Dampl for Volunteers N 2 - 4 on Atmospheric Temperature T
Results by TSA on sensitivity of physiological parameters of another three volunteers to temperature variations are presented in Table 3. Unfortunately, time series lengths of these volunteers are insufficient for DNNGO application. Besides, time series for DPWV and Dampl for volunteer 4 contain only 10 points, that why their dependence from atmospheric factors and GMA can not be estimated even by TSA method.
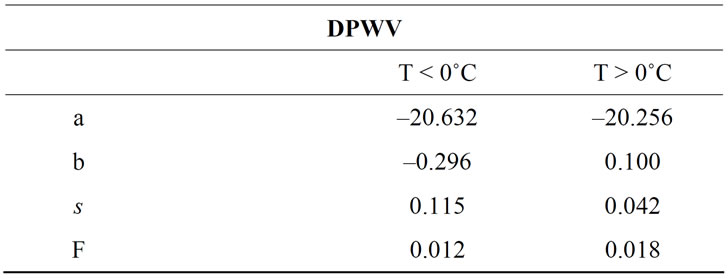
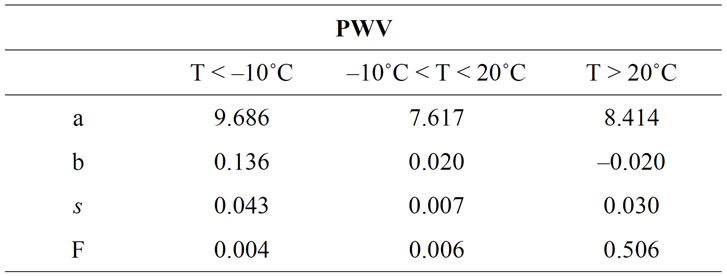
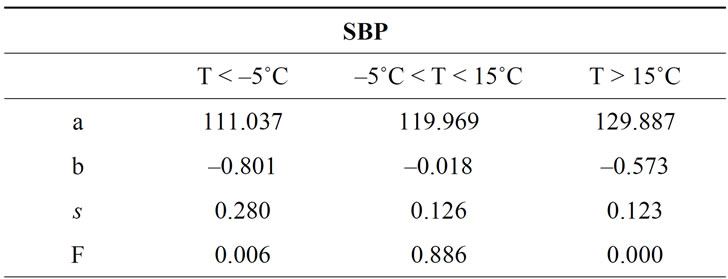
Table 2. Results of correlation analysis of SBP, PWV and DPWV and Т for volunteer 1 in different temperature ranges (for results from Figures 2(b), (d), (f)). Confidence values (p < 0.05).
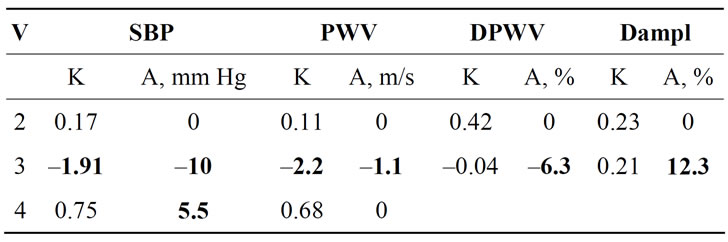
Table 3. Parameters of measure of correlation connection (K) and amplitudes of change (A) of physiological parameters during changes the temperature for volunteers 2 - 4. Amplitude values are shown only for cases when the significance of differences in the distributions by Wilcoxon test was p < 0.05.
Table 3 shows that the dependence of physiological parameters on temperature variations there is only for volunteer 3, and the direction of changes of SBP has the same sign as that one for volunteer 1. Significant correlation of the SBP with the values of atmospheric temperature (negative in 90% cases) was also detected earlier in about half of the examined healthy volunteers and patients with arterial hypertension living in different climatic zones (230 people in total) [23] .
For possibility of comparison of character and degree of their dependence on external factors we introduced a parameter K, reflecting a measure of correlation connection: K = sign(r) × (–log10(p)), where r is a correlation coefficient, р—its confidence.  > –log10(0.05) = 1.3 corresponds to correlation coefficients which are significant at level p < 0.05,
  > –log10(0.01) = 2 means that p < 0.01 an so on.
The direction of variation of PWV for volunteer 3 is opposite to that observed for volunteer 1 (Figures 2(c), (d), 3(b)). However, it is known that the individual response of blood pressure of different persons to changes of external factors may have a different sign, so the task of clarifying the causes of a certain type of reaction requires analysis of larger number of volunteers. At this stage we can only conclude that the reaction rates on temperature variations in PWV is not a unique property of volunteer 1.
Reaction rates of DPWV and Dampl found only for volunteer 3. They are less pronounced: the correlation coefficient has a low value ( < 1.3, Table 3). This result is also consistent with the results obtained for volunteer 1.
3.1.3. Dependence of Physiological Parameters of Volunteer 1 on GMA Activity by TSA
Level of GMA in the given work was estimated by using two very close in geophysical sense indices –Kp and Ap. It was done for the purpose of the comparative analysis of these indexes applicability to a problem of an estimation of level of individual magnetosensitivity. As selective distributions of the Ap-index don’t usually obey Gauss distribution even for short time series, in the given part of work, Spearman correlation coefficient have been calculated irrespective of statistical properties of another time series. Data set of each physiological parameter has been divided into the intervals corresponding to calendar seasons of year, and for each interval an estimation of statistical connection of SBP, PWV and DPWV with GMA-level has been performed separately.
Results are shown in Table 4 where for each experimental samples (SBP, PWV and DPWV) a measure the degree of correlation K with the Kp-index, an amplitude A (difference of medians of physiological parameter’s samplings observed at low and high levels of Kp-index)

Table 4. Results obtained by TSA analysis for physiological parameters volunteer 1 and daily Kp-index during different seasons
and the statistical significance p(A) of medians distinctions according to Wilcoxon test are given. A values are given for cases of p(A) < 0.05.
Table 4 shows that from three physiological parameters the most sensitive to changes of GMA level is PWV. Significant reaction of PWV on Kp-index was found out in five cases from seven by the correlation analysis, and in all seven cases by a method of the dispersive analysis. For the SBP dependence on the Kp-index is found out in two cases, for DPWV—only in one.
Results of comparison of application of Kp and Ap indices for an estimation of magnetosensitivity of SBP, PWV and DPWV for the volunteer 1 are shown in Figure 3.
It is visible that measure of degree of correlation K, calculated for the SBP and the PWV with Kp and Ap indices, appear or the closest, or simply coincided in all

Figure 3. Results of estimations of magnetosensitivity of parameters SBP and PWV for volunteer 1 in different seasons of years using Kp and Ap-indices of GMA.
14-tin considered cases (two physiological parameters during 7 seasons). The conclusions received by using both indices as a measure of GMA level are identical within the accuracy of the method. Results of dispersive analysis also have appeared completely coinciding in the sense of obtained conclusions: list of seasons with significant changes of physiological parameters under the influence of GMA, sign of reaction, their amplitude and level of significance.
It is interesting that during different seasons it was found out differently directed significant dependences of PWV of volunteer 1 on the Kp-(Ap)-index (Figure 3).
It appears, negative correlation between PWV and Kp is characteristic for the periods of the lowered geomagnetic background, positive—for the periods of the raised level (Figure 4). The given result received for various seasons of data of volunteer 1, was confirmed by the result of the volunteer 2 (triangle in Figure 4) who spent measurements during a compact time interval (JanuaryFebruary, 2009), therefore the concept “the average level
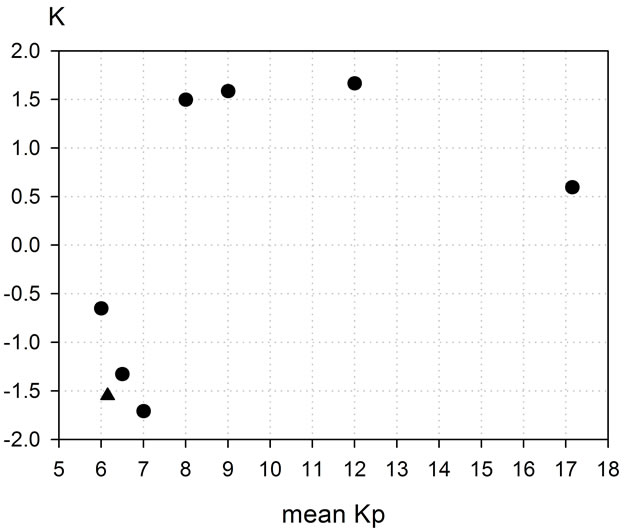
Figure 4. The dependence of the correlation parameter K between PWV and Kp-index during different seasons on the average level of GMA during the observation period. Diamonds—for volunteer 1 in different seasons; triangle—for volunteer 2 (winter 2009).
of Kp during measurements” is applicable to his results. These results are also consistent with our earlier findings that the level of perfusion (blood filling the tissue) is directly proportional to the Kp-index only during periods when the average level of GMA is above a certain threshold [24].
Increased values of PWV are usually considered as an indicator of deterioration of a functional condition of cardiovascular system. We selected from data set the dates when increased values of PWV were registered and for these dates the average course of the Kp-index in a vicinity ±8 days was constructed. In order to check a stability of the found out effect as increased values of PWV we considered three samples accordingly including 20% of the greatest values (percentile 0.8, PWV > 8.5 m/s), 15% (percentile 0.85, PWV > 8.7 m/s) and 10% of the highest values (percentile 0.9, PWV > 8.85 m/s).
For each of three samples of increased values of PWV the mean values (medians) of corresponding Kp-index with shifts ±8 days have been constructed (Figure 5). From this figure it is visible that function of Kp with shift has maximum in zero day, moreover, this function is almost identical for three samples of increased values of PWV. In all three cases the distributions of Kp-indices observed in zero day and in –8  –2 and 4
  8 days are different at level p < 0.01 according to Wilcoxon test. This result means that in vicinity of days with increased values of PWV the growth of GMA level was predominantly observed.
3.1.4. Dependence of Physiological Parameters of Volunteers 2 - 4 on GMA Activity by TSA
Comparison of the results obtained above for volunteer 1 and Table 5 shows that the SBP dependence on Kp-index was detected in three cases: for volunteer 1 (for two seasons, while the full sample correlation is not signifi-

Figure 5. Variation of average values (medians) of Kp-index distributions in vicinity of days of increased values of PWV registration for volunteer 1.
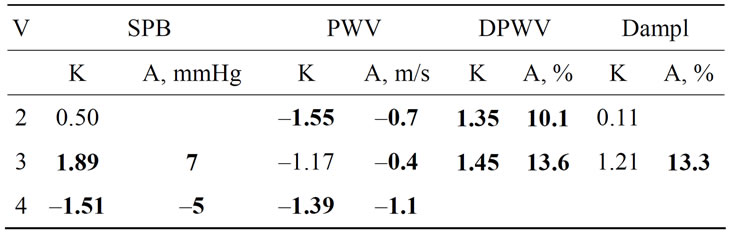
Table 5. Parameters of measure of correlation connection (K) and amplitudes of change (A) of physiological parameters at changes of GMA level (Kp-index) for volunteers 2 - 4. Amplitude values are shown only for cases where the significance of differences in the distributions of Wilcoxon test p < 0.05.
cant), as well as for volunteers 3 and 4. Signs of reaction are different.
The dependence of PWV on Kp-index was found for all four tested volunteers. For volunteers 2, 3 and 4 the signs of reaction are the same: PWV values decrease with an increase the level of GMA. Over a longer period of observation a volunteer 1 showed that the reaction of this physiological parameter may be alternating in time, depending on the average level of GMA. In particular, the signs of a reaction of the volunteer 1 during the winter of 2009 and the volunteer 2 who carried out the observations in this period are the same.
Thus, in both number of cases it was found a significant correlation, and the relative amplitude changes in physiological parameters due to variations in the level of GMA. The parameters PWV and DPWV for all four surveyed volunteers are more sensitive to variations in GMA than the level of blood pressure (SBP).
3.2. An Evaluation of the Combined Effect of Several Factors (Two-Dimensional Analysis) (DNGO)
The character of the nonlinear dependence physiological parameters on T recovered by DNNGO (Figure 2) allows us to estimate not only the strength, but also the nature of the discovered relationship, depending on whether: it is possible to describe the trends or outliers adequately.
We can see that, in the first case, the restored dependence takes the form of slower waves, while in the second case it takes the form of fast oscillations. As it is well known, the dynamics of Kp indices has the nature of fast oscillations. A perturbation lasts for one day, and a storm lasts for a maximum from two to three days. In the same time, as it has been shown by [23], arterial blood pressure dependence on atmospheric temperature for hypertensive persons has character of slow waves with the period about 4 - 7 days, despite of these patients undergo a hypertensive therapy.
4. Conclusions
A series of observations of such vascular parameters as SPB, PWV and characteristics of EnF (DPWV and Dampl) allowed us to carry out a detailed comparative analysis of their sensitivity to meteorological and geomagnetic factors.
Dependence of physiological characteristics on the atmospheric temperature, revealed by both applied mathematical approaches (DNNGO and TSA), showed complex non-linear character of biological replies: the reaction has a different form in different temperature ranges and is manifested in the form of synchronization of slow variations of physiological and atmospheric parameters (trends) with a period of several days, while the daily variations were virtually independent.
The SBP, PWV and DPWV are approximately equally depending on atmospheric temperature, which accounts for an average of 26% to 28% of their variations.
Sensitivity to the GMA for this test was found only for PWV. In contrast to the response to MFs, which was stable in the separate analysis in different years of observation, the PWV dependence on the GMA changed its character for 2009 when geomagnetic disturbances were practically absent. The reaction of PWV to the GMA was manifested mostly as a growth with increase of Kp values, what means an increase of rigidity of the vessel walls and their tone. In 2009, when an average Kp-index was extremely low for long periods (“magnetic silence”), values of PWV were normal or decreased.
Thus, noninvasive methods of daily monitoring not only level of the BP, but also other characteristics of cardiovascular system such as the vascular tone parameters, allows revealing more complex changes of an arterial vascular regulation in respond to action of external factors.
5. Acknowledgements
Authors thank the Presidium of Russian Academy of Sciences for support of this work by grant—“Fundamental Sciences to Medicine”.
REFERENCES
- T. Breus, G. Cornelissen, F. Halberg and A. E. Levitin, “Temporal Associations of Life with Solar and Geophysical Activity,” Annales Geophysicae, Vol. 13, 1995, pp. 1211-1222. doi:10.1007/s00585-995-1211-8
- E. Stoupel, J. Petrauskiene, E. Abramson, R. Kaledie, P. Izrailevich and J. Sulkes, “Relationship between Death from Stroke and Ischemic Heart Disease—Environmental Implications,” Journal of Basic and Clinical Physiology and Pharmacology, Vol. 10, No. 2, 1999, pp.135-139. doi:10.1515/JBCPP.1999.10.2.135
- S. Palmer, M. Rycroft and M. Cermack, “Solar and Geomagnetic Activity, Extremely Low Frequency Magnetic and Electric Fields and Human Health at the Earth’s Surface,” Surveys in Geophysics, Vol. 27, 2006, p. 557. doi:10.1007/s10712-006-9010-7
- V. A. Ozheredov, T. K. Breus, Yu. I. Gurfinkel, D. A. Revich and T. A. Mitrofanova, “Influence of Some Weather Factors and Geomagnetic Activity on the Development of Severe Cardiological Pathologies,” Biophysics, Vol. 55, No. 1, 2010, pp. 110-119. doi:10.1134/S0006350910010185
- T. A. Zenchenko, L. V. Poskotinova, A. G. Rekhtina and R. M. Zaslavskaya, “Relation between Microcirculation Parameters and Pc3 Geomagnetic Pulsations,” Biophysics, Vol. 55, No. 4, 2010, pp. 646-651. doi:10.1134/S000635091004024X
- B. A. Revich and D. A. Shaposhnikov, “Climate Conditions, Quality of Atmospheric Air and Mortality of Population in Moscow in 2000-2006,” In: B. A. Revich, Ed., Climate, Quality of Atmospheric Air and Health of Muscovites, Adamant, Moscow, 2006, pp. 102-140 (in Russian).
- J. Schwartz, M. Jonathan and A. Jonathan, “Hospital Admissions for Heart Disease: The Effects of Temperature and Humidity,” Epidemiology, Vol. 15, No. 6, 2004, p. 755. doi:10.1097/01.ede.0000134875.15919.0f
- P. Michelozzi, G. Accetta, M. De Sario, D. D’Ippoliti, C. Marino, M. Baccini, A. Biggeri, H. Ross Anderson, K. Katsouyanni, F. Ballester, L. Bisanti, E. Cadum, B. Forsberg, F. Forastiere, P. G. Goodman, A. Hojs, U. Kirchmayer, S. Medina, A. Paldy, C. Schindler, J. Sunyer, C. A. Perucci and on Behalf of the PHEWE Collaborative Group, “High Temperature and Hospitalizations for Cardiovascular and Respiratory Causes in 12 European Cities,” American Journal of Respiratory and Critical Care Medicine, Vol. 179, No. 5, 2009, pp. 383-389. doi:10.1164/rccm.200802-217OC
- T. K. Breus, R. M. Baevsky, G. A. Nikulina and A. G. Chernikova, “Geomagnetic Activity Effects on Humans in Nonstationary Extremely Conditions and Comparison with Laboratory Observations,” Biophysics, Vol. 43, No. 5, 1998, pp. 767-775.
- T. K. Breus, R. M. Baevskii, I. I. Funtova and A. G. Chernikova, “Effect of Geomagnetic Field Disturbances on the Adaptive Stress Reaction of Cosmonauts,” Cosmic Research, Vol. 46, No. 4, 2008, pp. 367-372. doi:10.1134/S0010952508040138
- G. Cornelissen, F. Halberg, T. K. Breus, E. V. Syutkina, R. M. Baevskii, A. Weydahl, Y. Watanabe, K. Otsuka, J. Siegelova, B. Fiser and E. E. Bakken, “Non-Photic Solar Associations of Heart Rate Variability and Myocardial Infarction,” Journal of Atmospheric and Solar-Terrestrial Physics, Vol. 64, 2002, pp. 707-728.
- T. K. Breus, V. A. Ozheredov, E. V. Syuitkina and A. N Rogoza, “Some Aspects of the Biological Effects of Space Weather,” Journal of Atmospheric and SolarTerrestrial Physics, Vol. 70, 2008, pp. 436-441.
- Yu. I. Gurfinkel, V. V. Lubimov, V. N. Oraevskii, L. L. Parfemova and A. S. Yuriev, “Effect of Geomagnetic Disturbances on Capillary Blood Flow in Patients Suffering from Ischemic Heart Disease,” Biophysics, Vol. 40, No. 4, 1995, pp. 777-783.
- J. N. Cohn, “Arterial Stiffness, Vascular Disease, and Risk of Cardiovascular Events,” Circulation, Vol. 113, 2006, pp. 601-603. doi:10.1161/CIRCULATIONAHA.105.600866
- F. U. Mattace-Raso, T. J. van der Cammen, A. Hofman, N. M. van Popele, M. L. Bos, M. A. Schalekamp, R. Asmar, R. S. Reneman, A. P. Hoeks, M. M. Breteler and J. C. Witteman, “Arterial Stiffness and Risk of Coronary Heart Disease and Stroke: The Rotterdam Study,” Circulation, Vol. 113, 2006, pp. 657-663. doi:10.1161/CIRCULATIONAHA.105.555235
- T. Willum Hansen, J. A. Staessen, C. Torp-Pedersen, S. Rasmussen, L. Thijs, H. Ibsen and J. Jeppesen, “Prognostic Value of Aortic Pulse Wave Velocity as Index of Arterial Stiffness in the General Population,” Circulation, Vol. 113, 2006, pp. 664-670. doi:10.1161/CIRCULATIONAHA.105.579342
- G. E. McVeigh, P. B. Allen, D. R. Morgan, C. G. Hanratty and B. Silke, “Nitric Oxide Modulation of Blood Vessel Tone Identified by Arterial Waveform Analysis,” Clinical Science, Vol. 100, 2001, pp. 387-393. doi:10.1042/CS20000227
- Yu. I. Gurfinkel, N. V. Katse, L. M. Parfenova, I. Yu. Ivanova and V. A. Orlov, “Comparative Study of Pulse Wave Velocity and Endothelial Function at Healthy Subjects and at Patients with a Cardiovascular Pathology,” Russian Journal of Cardiology, Vol. 76, No. 2, 2009, pp. 38-43.
- V. A. Ozheredov, “Investigation of Space and Terrestrial Weather Effects on Human Organism on the Basis of Optimization Algorithms,” Ph.D. Dissertation (IKI RAS), Central Governmental Library in Moscow, 2010, 193 p.
- A. Yu. Loskutov, J. L. Kotlyakov, I. A. Istomin and D. I. Zhuravlev, “Problems of Nonlinear Dynamics III: Local Methods of Time Series Forecast,” Vestnik of Moscow State University, Physics and Astrophysics Series, No. 6, 2002, pp. 3-21.
- J. McNames, J. A. K. Suykens and J. Vandewalle, “Winning Entry of the K. U. Leuven, Time Series Prediction Competition,” International Journal of Bifurcation and Chaos, Vol. 9, No. 8, 1999, pp. 1485-1500. doi:10.1142/S0218127499001048
- E. L. Leman, “Checking of Statistical Hypothesis,” NAUKA, 1978, 408 p.
- T. A. Zenchenko, T. K. Breus, E. V. Tsagareishvili, J. V. Oschepkova and A. N. Rogoza, “Typology of Reactions on the Space and Terrestrial Weather Variations for Patients Suffering From Hypertension and for Healthy People,” In: M. Jordanova and F. Lievens, Eds., Global Telemedicine and eHealth Updates: Knowledge Resources, Medtech Pub Co, New Glouchester, Vol. 2, 2009, pp. 49-410.
- T. A. Zenchenko, “Method of Analysis of Time Series Data for the Complex Estimation of Meteoand MagnetoSensitivity of Human Organism,” Human Ecology (in Russian), No. 2, 2010, pp. 3-11.