Open Journal of Composite Materials
Vol.3 No.2A(2013), Article ID:30686,12 pages DOI:10.4236/ojcm.2013.32A004
Anatase Titanium Dioxide Coated Single Wall Carbon Nanotubes Manufactured by Sonochemical-Hydrothermal Technique
![]()
1Department of Environmental Sciences and Interdisciplinary Studies, Texas Southern University, Houston, USA; 2Department of Chemistry, Texas Southern University, Houston, USA; 3Department of Health Sciences, Texas Southern University, Houston, USA.
Email: *thomas_rl@tsu.edu
Copyright © 2013 Paul Clemens et al. This is an open access article distributed under the Creative Commons Attribution License, which permits unrestricted use, distribution, and reproduction in any medium, provided the original work is properly cited.
Received February 26th, 2013; revised March 28th, 2013; accepted April 18th, 2013
Keywords: SWCNT; Sonochemical; Hydrothermal; Nanoparticle; Single Wall Carbon Nanotube; TiO2
ABSTRACT
A novel, cost effective, sonochemical-hydrothermal technique was used for the deposition of nanosized anatase titanium dioxide (TiO2) onto single wall carbon nanotubes (SWCNTs). This technique is described and the characterization of the synthesized TiO2-SWCNTs is reported. The characterization techniques employed include scanning electron microscopy (SEM), Raman spectroscopy, and X-ray diffraction (XRD). From the characterization the size and morphology of the synthesized TiO2 nanoparticles (deposited on the SWCNTs) are reported. Furthermore, it is demonstrated that the created TiO2 nanoparticles are chemically attached to the SWCNTs. Also, an important correlation between calculated TiO2 crystal size and the red shifts in the lowest Raman TiO2 (E.g.) predominate peak is reported. The synthesized TiO2-SWCNTs have potential for large scale production and application in a variety of new technologies such as clean energy power generation devices, electrical storage devices, photocatalysts, and sensors.
1. Introduction
The benefits of coating nanosized titanium dioxide (TiO2) onto the surface of carbon nanotubes (CNTs) is of great scientific interest as nanoparticles often exhibit different physical and chemical properties, as the size of the material becomes smaller and smaller, relative to their bulk material counterparts. This interesting shift in particle properties is largely due to the large surface area and surface to volume ratio of the material, which dominates the contributions made by the small bulk of the material [1]. Some of the unique size-dependent properties of nanomaterials include quantum confinement in semiconductor particles (movement of electrons and holes in semiconductor materials) and transport properties related to phonons and photons [2-5]. Properties also vary as the shapes of the nanomaterials differ [6,7]. It is because of the access to this new realm of physical and chemical properties that substantial research efforts in nanoscience and nanotechnology have been dedicated [8-10].
Titanium dioxide coated carbon nanotubes (TiO2-CNTs) are currently being developed and considered for many applications, where nanoparticle (TiO2) are presently used, such as sensors, photovoltaics, and photocatalyts. The beneficial pairing of nanoparticle TiO2 with CNTs, or more particularly the pairing of TiO2 with single-wall carbon nanotubes (SWCNTs), is the enhancement of the many unique properties of unmodified nanosized TiO2. SWCNTs possess excellent mechanical properties, large surface areas, one dimensional electron transport properties, and allow for surface chemical modifications to control the type of bonds that can be formed with TiO2. Additionally, the TiO2-SWCNT interface results in a unique quantum effect to provide trap states for electrons. This is an useful technique, known as the Schottky barrier, where there is a space–charge separation region that functions to increase recombination times for electron–hole pairs. [11] Essentially, by this method, the formation of a Schottky barrier results in the TiO2 having an excess positive charge and the SWCNT having an excessive negative charge. Thus, the nanosized TiO2 preferentially captures generated free electrons, via redox mechanisms, from the surrounding environment (i.e. transfer of electrons from electrolyte solution in a solar cell, or the transfer of electrons from the oxidation of an organic species in a photocatalytic oxidation cell). Furthermore, SWCNTs have a large electron-storage capacity of one electron for every 32 carbon atoms [12]. Therefore, they easily accept photon-excited electrons in from TiO2, thus hindering the recombination. For applications that require UV light (such as photovotalic and photocatalytic) it is proposed that CNTs may also act as a photosensitizer for the TiO2 [13]. Since UV light represents only 5% of the total sunlight spectrum, being able to capture a larger portion of the spectrum is advantageous. It has also been reported that the carbon-oxygen-titanium bond extends the light absorption to longer wavelengths, thus also leading the potential improvements in efficiency.
Various methods of synthesizing TiO2-CNTs have been reported. Generally, most of these processes are either time consuming, cumbersome, expensive, lack the control for the deposition TiO2, and/or produce inferior results. A list of some of these processes include sol-gel [14-18], sol [19,20], hydrothermal [21,22], solvothermal [23], electrochemical oxidation [24], electrochemical deposition [25,26], electrophoretic co-deposition of TiO2- CNT films and deposition of TiO2 onto CNT [27-29], alternative methods of sonochemical [30,31], chemical vapor deposition [32-36], and heterogeneous coagulation [37-40].
The advantages of using the novel sonochemicalhydrothermal technique to prepare titanium dioxidecoated carbon nanotubes (TiO2-CNTs) include low cost and readily available: 1) manufacturing equipment (sonicator, autoclave, and furnace); and 2) chemical precursors (aqueous titanium(III) sulfate and carbon nanotubes). Additionally, the technique is easy and relatively quick, producing chemically attached, uniformly dispersed, TiO2 encapsulated CNTs.
2. Experimental Procedures and Testing Apparatus
2.1. Synthesis of TiO2-SWCNTs
The synthesis of the TiO2-SWCNTs started by loading 10 mg of SWCNTs into a 50 mL conical bottom polypropylene centrifuge tube. Next, 20 ml of 0.38 M titanium(III) sulfate solution was added. The centrifuge tube with the SWCNTs and solution was then placed in a test tube rack under a sonicator probe horn that is mounted on a ring stand. The sonicator used is a Qsonica ultrasonic cell disruptor, model Q125 by Misonix, equipped with a 1/8" diameter probe and operating at a frequency of 20 kHz. The probe tip was immersed into the solution and a power of 1 W/mL was utilized. Samples were exposed for set amount of times to achieve desired amount of TiO2 deposition. After sonification was complete the tube containing the synthesized TiO2-SWCNT in titanium(III) solution was centrifuged at 3500 RPM for 1 hour. The tube was then removed from the centrifuge and the liquid supernatant was decanted from the TiO2- SWCNTs that were dropped to the bottom of the container. The TiO2-SWCNTs were then washed by adding 20 mL of deionized water and exposing to ultrasound sonication for a duration of 3 minutes at a power of 1 W/mL to re-suspend the TiO2-SWCNTs. The tube was then re-centrifuged at 3500 for 1 h, the liquid decanted and replaced with clean deionized water, and then resuspended by sonication for 3 minutes at a power of 1 W/mL. This wash procedure was repeated 2 more times. The TiO2-SWCNTs were stored in water in the centrifuge tubes until ready for characterization.
It was determined by Raman analysis that an amorphous form of TiO2 was deposited on the surface of the SWCNTs via this sonochemical process. It is of interest to convert amorphous (poorly crystallized) forms of deposited TiO2 to their corresponding ordered anatase crystal structure. For this conversion, a hydrothermal calcination process was used. Here, 10 mg of the TiO2-SWCNT reaction product and 10 mL of deionized water were placed in 23 mL Teflon® lined, high pressure stainless steel digestion bomb, utilized as an autoclave. The autoclave was loaded into a furnace for 8 h at 250 degrees C to achieve hydrothermal calcination of the TiO2-SWCNT product. Upon completion the finished autoclaved samples were cooled to ambient and stored in the deionized water.
2.2. Scanning Electron Microscopy (SEM)
The morphology of pristine SWCNTs and TiO2-SWCNTs (2 h sonication) were characterized by scanning electron microscopy (S 4800 SEM, Hitachi Co., Tokyo, Japan). The pristine SWCNT sample for this analysis was prepared by ultrasonic dispersion in isopropanol followed by deposition onto a conductive porous silver membrane. The TiO2-SWCNTs (stored in water from the synthesis step) were prepared for analysis by homogeneously dispersing in water followed by deposition onto a conductive porous silver membrane. A small sample was cut from this prepared composite and adhered via conductive tape to the microscope stage. Once the sample was staged it was then loaded into the microscope for analysis.
2.3. Raman Spectroscopy
Sample spectra were obtained using a Thermo Scientific Nicolet Almega XR Dispersive Raman Spectrometer equipped with an Olympus BX-51 research microscope. Raman spectra analysis was conducted on samples from 100 to 4000 cm−1 with the laser operating at 532 nm at 100% of 150 mW with the beam going through the microscope equipped with a MPlain 10X BD objective.
2.4. X-Ray Diffraction (XRD)
X-ray diffraction (XRD) data was collected by using a Rigaku Miniflex, with CuKα radiation of 40 kV/4 mA, λ = 1.5406 Å. For pristine SWCNTs, the sample was prepared by deposition of SWCNTs on a silver membrane filter as described above for the SEM analysis. A small sample was cut from this prepared composite and the scan was ran from 2θ = 10˚ to 40˚. For the remaining samples (TiO2-SWCNTs), measured as dry powders, preparation consisted filling the powder sample dish and loading into the diffractometer. The collected scans were obtained from a range of 2θ = 20˚ to 75˚.
3. Results and Discussion
3.1. Characterization of Pristine SWCNT
The first point of reference is Figure 1 that depicts the SEM image of dispersed SWCNTs deposited on a silver membrane filter at 150 k magnification.
From the SEM image it is demonstrated that the SWCNTs show a superstructure that exhibits a high degree of entanglement between the bundles of tubes. This can be accounted for by the report that SWCNTs allow for remarkable Van der Walls interactions due to their smooth, uniform surfaces in close proximities. Thus, the majority of the tubes are bundled via direct van der Waals attractions along their entire lengths [41]. These SEMs are in good agreement with similar reports published in the literature [42-48].
The Raman spectrum for the SWCNTs is shown in Figure 2.
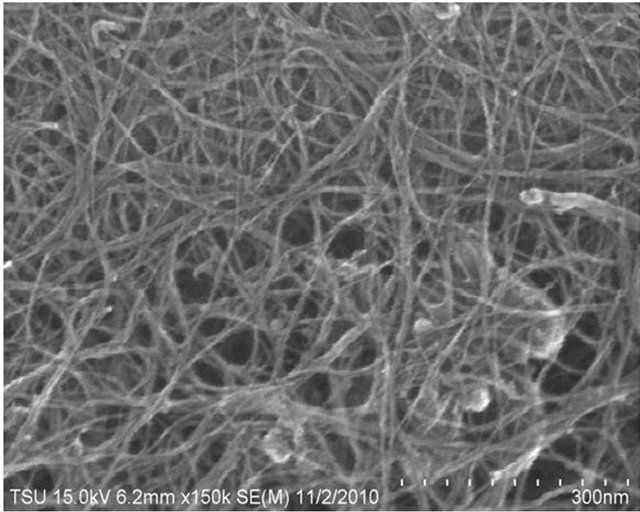
Figure 1. SEM image of pristine SWCNT deposited on a silver membrane filter at 150 k magnification.
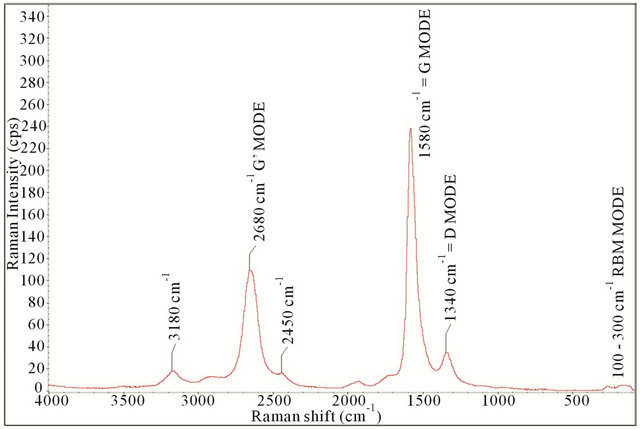
Figure 2. Raman spectrum of pristine SWCNTs.
As reported by Eklund, five peaks centered at around 1340 cm−1 (D mode), 1580 cm−1 (G mode), 2450 cm−1, 2680 cm−1 (G’ mode), and 3180 cm−1 are due to SWCNTs [49]. These five peaks are clearly visible and labeled in the spectrum. Here the three predominate modes include the D, G, and G’ modes. The D mode (1340 cm−1) originates from structural defects and is present in all graphite-like carbons. The G mode (1580 cm−1) corresponds to planar vibrations of carbon. The position of the G band confirms that the sample is mainly composed of single wall carbon nanotubes [49]. The G’ mode (2680 cm−1) is the second overtone of the D mode, which makes the name misleading. It is given because it is usually the second strongest mode in graphite. It is reported that the diameter of the SWCNT influences the position of the G’ mode, thus a rough estimate of tube diameter can be deduced (this information is not reported in this study) [50]. Two additional modes worth noting include the radial breathing mode and the bundling mode. The radial breathing mode is the result of the expansion and contraction that occurs across the radial cross section in the nanotubes, typically occurring in the 100 to 350 cm−1 range [51,52]. A special form of the radial breathing mode, the bundling mode, is reported to originate from the collective vibration in a bundle of SWCNTs [53]. It is apparent from Figure 2 that there is a percentage of the SWCNTs that are bundled.
XRD was performed for SWCNTs deposited on a silver membrane filter as shown in Figure 3.
A single peak centered at 2θ = 38.36˚ is identified as silver from the membrane filter support and agrees with published literature [54]. There are no peaks for SWCNTs because crystal plains are non-existent. It is worth noting, from the lack of MWCNT spectral lines, that the CNTs evaluated are confirmed to be of single wall configuration [55-57]. MWCNTs are reported to have a peak at 2θ = 26.06˚, corresponding to the interplanner spacing of 0.342 nm between the tubes [58]. This
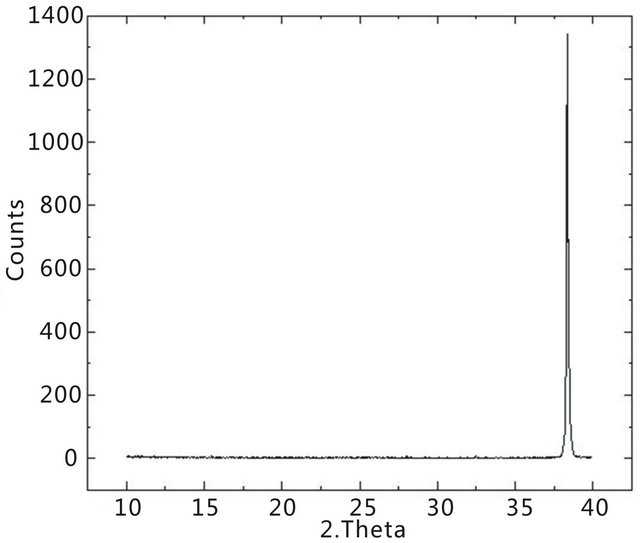
Figure 3. XRD spectrum of SWCNTs deposited on a silver membrane filter.
spectrum is used for comparison against TiO2-SWCNTs spectrums.
3.2. Characterization of P25
The Raman spectra for P25 (a commercially produced nanosized TiO2 from Evonik) is shown in Figure 4.
The six Raman active modes, A1g + 2B1g + 3Eg, for anatase TiO2 that have been reported in the literature are detected at 144 cm−1 (E.g.), 197 cm−1 (E.g.), 399 cm−1 (B1g), 513 cm−1 (A1g), 519 cm−1 (B1g), and 639 cm−1 (E.g.),[59] and the peaks at 250, 450, and 620 cm−1 are due to the Ti-O-Ti bond of rutile spectrum [60]. The characteristic bands for brookite (not found in this study) are reported at 128, 135, 153, 172, 195, 214, 247, 288, 322, 366, 396, 412, 454, 461, 502, 545, 585, and 636 cm−1 [61]. In the spectra for P25, five anatase crystal peaks were detected at 144 cm−1, 197 cm−1, 399 cm−1 (B1g), and 639 cm−1. One rutile peak can be seen at 450 cm−1. The positions and intensities of the Raman active modes correspond well with the percent of anatase phase of TiO2 relative to the percent of rutile. The spectrum agrees with the P25 spectrum published by Parussulo. [62] The full width at half maximum (FWHM) of the strongest peak (144 cm−1) is 27.0 cm−1 correlating to the manufactures reported 21 nm crystallite size.
XRD of P25 nanoparticle was ran from 2θ = 20˚ to 75˚. Anatase TiO2 has diffraction peaks at 2θ = 25.18˚ (strongest peak), 37.78˚, 48.00˚, 53.89˚, 54.99˚, 62.57˚, 68.68˚, 70.15˚, and 75.01˚, corresponding to the reflections from 101, 004, 200, 105, 211, 204, 116, 220, and 215 crystal planes [63]. The strongest peaks for rutile and brookite are at 2θ = 27.5˚ for the 110 crystal plane and 2θ = 30.8˚ for the 121 crystal plane of rutile and brookite respectively. [64] The spectrum is shown in Figure 5.
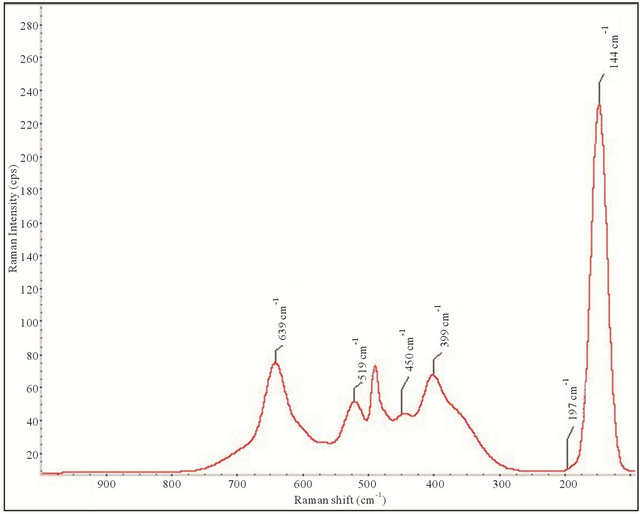
Figure 4. Raman spectrum for P25.
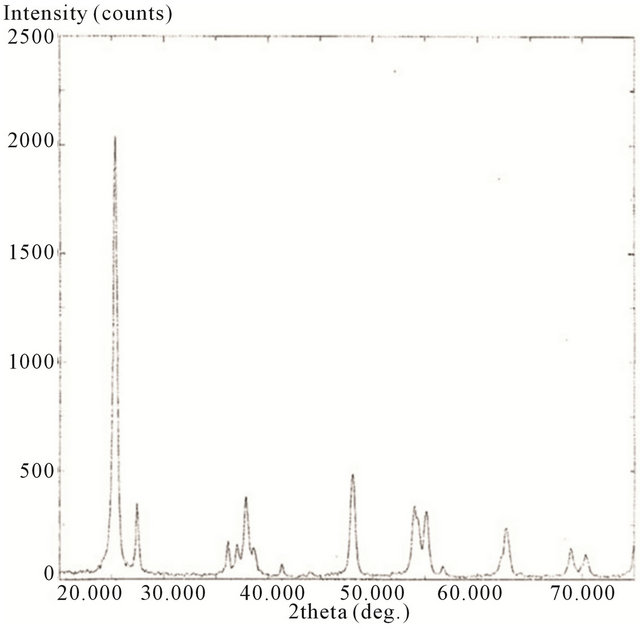
Figure 5. XRD spectrum of P25.
Here, the spectrum shows predominately anatase TiO2 with the necessary diffraction peaks at 2θ = 25.18˚ (strongest peak), 37.78˚, 48.00˚, 53.89˚, 54.99˚, 62.57˚, 68.68˚, 70.15˚, and 75.01˚. The remaining peeks are due to the rutile structure. The integrated intensities of the strongest peak of both anatase (Ia,101 at 25.4˚) and rutile (Ir,110 27.5˚) were used to calculate the percentage of rutile and anatase according to the formulas: Wr(%) = Ir/(0.8844xIa + Ir) × 100 and Wa(%) = 100 − Wr(%) [65]. The values indicate a composition of 78.8 % anatase and 21.2% rutile. Additionally, the average crystal diameter was calculated from the largest peak by the Scherrer’s equation which is B = Kλ/βcosθ where B is the crystalline size, in nm; l is the wavelength for the radiation used, which is 1.54056A for Cu; β is the full width at half maximum intensity (FWHM); θ is the angle for the XRD maximum peak and the shape factor, K is 0.93 [66]. This value is 20.3 nm and agrees well with the published value of 21 nm.
3.3. Characterization of Sonochemical Synthesized TiO2-SWCNTs
This portion of the study was conducted in order to characterize and determine a profile for increasing sonication exposure times for the deposition of TiO2 onto SWCNTs. Sonochemical deposition times of 10 minute, 20 minute, 30 minute, and 2 h were performed and investigated.
Figure 6 shows the SEM for TiO2 deposited on SWCNT at a deposition time of 2 hours.
From the micrograph microscopy image it is clear that the entangled superstructure and, clearly demostrates the nanosized TiO2 that has been successfully decorated on the SWCNTs. It is noted that homogeneous deposition of both agglomerates of small TiO2 particles and isolated grains appear to be deposited on the SWCNTs. This is in agreement with findings reported by Yao [67].
Figures 7-10 depict the Raman spectrum of the manu-
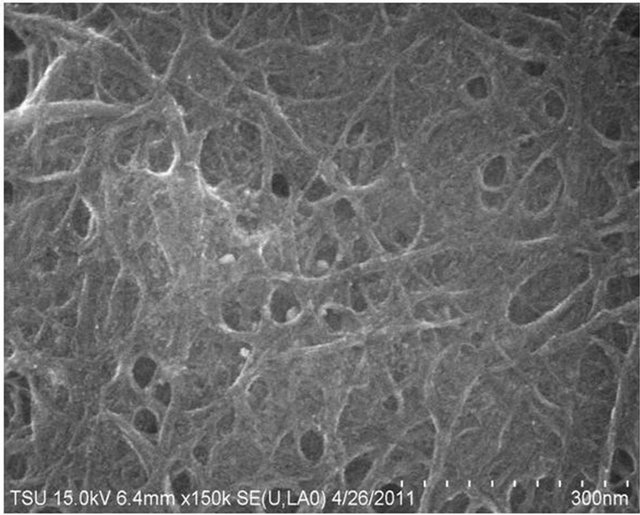
Figure 6. SEM image of 2 h sonochemical deposition of TiO2 on SWCNT at 150 k magnification.
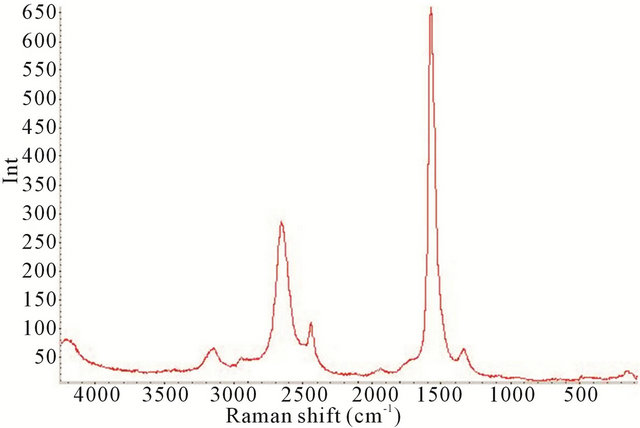
Figure 7. Raman spectrum of the synthesized TiO2-SWCNTs at deposition time of 10 minute exposure to sonication with no hydrothermal treatment (Y-axis is Raman intensity, CPS).
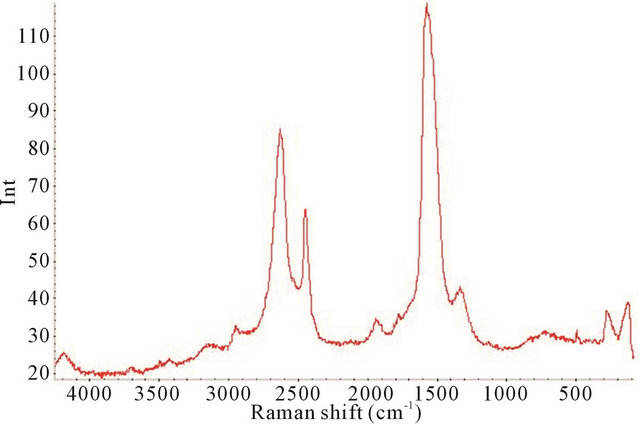
Figure 8. Raman spectrum of the synthesized TiO2-SWCNTs at deposition time of 20 minute exposure to sonication with no hydrothermal treatment (Y-axis is Raman intensity, CPS).
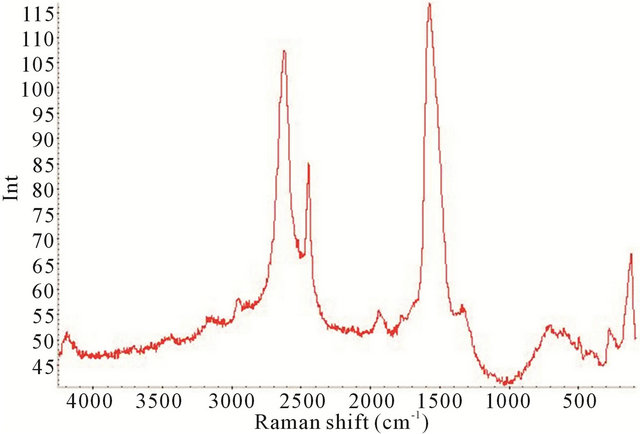
Figure 9. Raman spectrum of the synthesized TiO2-SWCNTs at deposition time of 30 minute exposure to sonication with no hydrothermal treatment (Y-axis is Raman intensity, CPS).
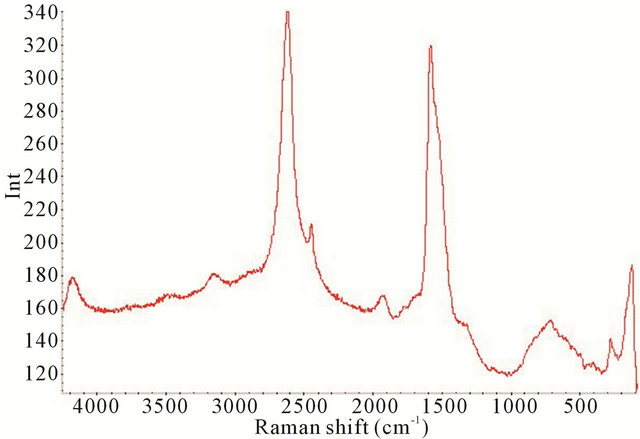
Figure 10. Raman spectrum of the synthesized TiO2-SWCNTs at deposition time of 2 h exposure to sonication with no hydrothermal treatment (Y-axis is Raman intensity, CPS).
factured TiO2-SWCNTs from 90 cm−1 to 4000 cm−1, at deposition times of 10 minute, 20 minute, 30 minute, and 2 h exposures to sonication.
All the Raman spectra reveal the SWCNTs peaks but are absence of crystalline TiO2, as noted by comparison with Figure 4. In the TiO2 portion of the spectrums, below 650 cm−1, the absence of the crystalline TiO2 confirms the amorphous characteristic of the deposited material. It is apparent that amorphous TiO2 was predominant in all the samples. This is further confirmed by Figure 11 where the XRD of the 2 h sample is presented.
Here the spectrum shows no discernible peaks that would be expected for a crystalline material, as noted by comparison with the XRD spectrum for P25 as seen in Figure 5.
3.4. Characterization of Hydrothermal Treated TiO2-SWCNTs
Figures 12-15 depict the Raman spectrum of the synthesized TiO2-SWCNTs from 90 cm−1 to 4000 cm−1, at
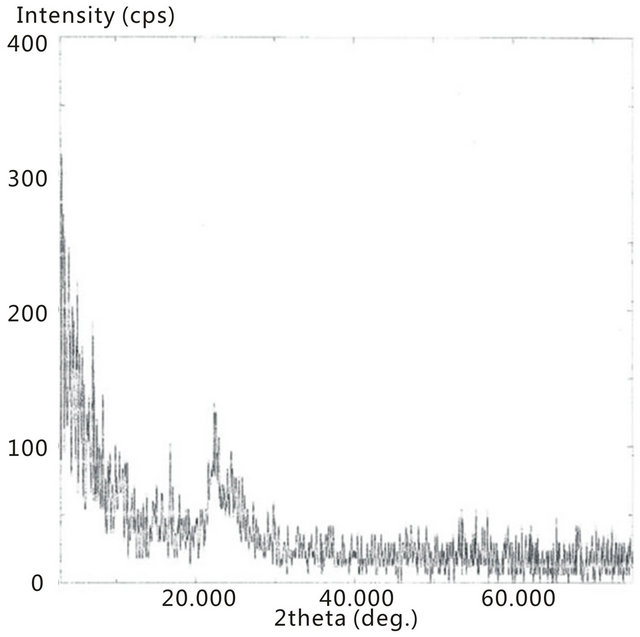
Figure 11. XRD spectra of the synthesized TiO2-SWCNTs at deposition time of 2 h exposure to sonication, with no hydrothermal treatment.
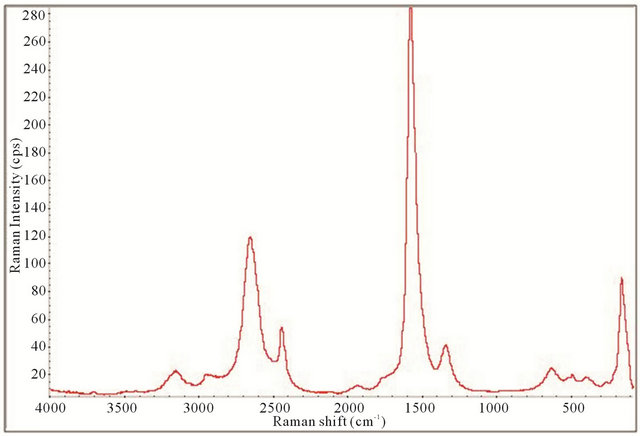
Figure 12. Raman spectrum of the synthesized TiO2-SWCNTs at deposition time of 10 minute exposure to sonication with hydrothermal calcination treatment.
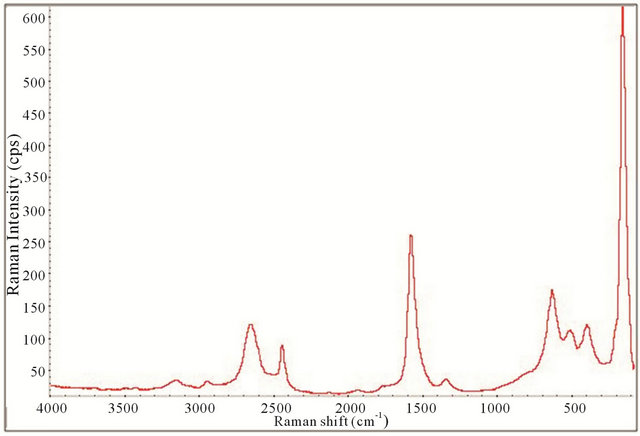
Figure 13. Raman spectrum of the synthesized TiO2-SWCNTs at deposition time of 20 minute exposure to sonication with hydrothermal calcination treatment.
deposition times of 10 minute, 20 minute, 30 minute, and 2 h exposures to sonication, followed by hydrothermal
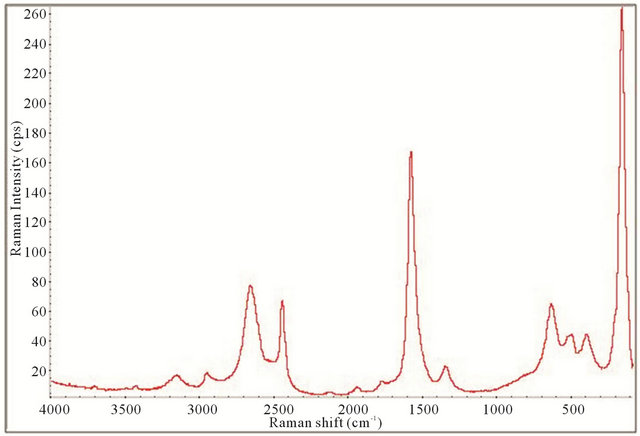
Figure 14. Raman spectrum of the synthesized TiO2-SWCNTs at deposition time of 30 minute exposure to sonication with hydrothermal calcination treatment.
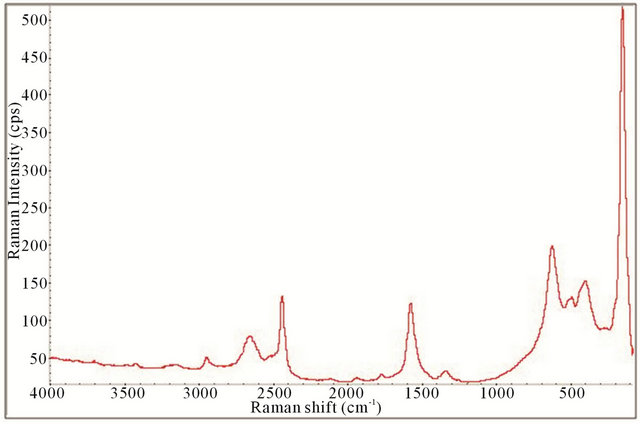
Figure 15. Raman spectrum of the synthesized TiO2-SWCNTs at deposition time of 2 h exposure to sonication with hydrothermal calcination treatment.
calcination treatment.
All the Raman spectra displayed the necessary peaks for anatase TiO2 crystals and SWCNTs showing they are both present in the samples. This is illustrated by comparison with the spectrum obtained for P25 as shown in Figure 4. Figures 12-15 also allude to a trend where the peaks appear more robust and defined as the length of deposition time increases. It appears that exclusively anatase was made in all the samples with the exception of the 10 minute specimen. For the 10 minute sample rutile TiO2 appears to also be present along with the anatase. A clearer illustration is portrayed in Figure 16 where is of interest to note the anatase peaks at 160.68 cm−1 (E.g.), 212.51 cm−1 (E.g.), 399.85 cm−1 (B1g), 513.27 cm−1 (A1g), and 631.58 cm−1 (E.g.) and vaguely depicted rutile peaks at 260.56 cm−1, 447.04 cm−1, and 612.82 cm−1. The strongest, well resolved 160.68 cm−1 (E.g.) mode is due to the external vibrations of the anatase structure, indicating that long-range order was formed [68].
This is also the case for the other measured TiO2-SWCNT
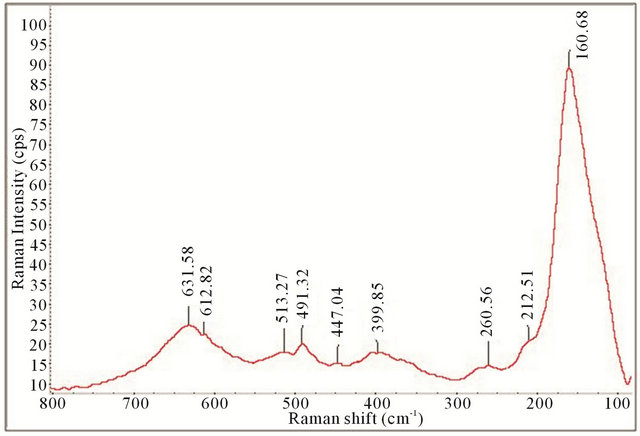
Figure 16. Raman spectrum of 90 cm−1 to 800 cm−1 for synthesized TiO2-SWCNTs at deposition time of 10 minute exposure to sonication with hydrothermal calcination treatment.
samples.
All the samples show spectral peaks that are broadened and/or shifted with respect to P25, with the 10 minute sample showing the largest shift. For the 10 minute sample, the largest shift differences are noted at the highest and lowest E.g. mode. The highest mode has blue shifted (peak at 631.58 cm−1) while the lowest mode (E.g.) has red shifted by approximately Δ16 cm−1 (from 147.20 cm−1 for P25 anatase to 160.68 cm−1). A similar shift was reported by Bersani et al. who attributed it to phonon confinement caused by the decrease in the crystal size of the anatase TiO2 [69]. These shifts are apparent in nanoparticles that have a diameter smaller than 15 nm and are indicative of reduction of crystal sizes [70]. For comparison, Figure 17 show an overlay of the observed red shift, for the lowest mode (E.g.), for the samples evaluated.
Here the compiled Raman spectrum from 90 cm−1 to 220 cm−1 for the synthesized TiO2-SWCNTs at deposition times of 10 minute, 20 minute, 30 minute, and 2 h exposures to sonication with hydrothermal calcination treatment is shown. The spectrum is normalized for the large TiO2 (E.g.) peaks clustered around 147 cm−1 to 161 cm−1 with the spectrum of p25 added for reference. With the grain size of P25 equal to a measured 20.4 nm, it is clear that the samples have relatively smaller sized TiO2 particles. The decrease in size trend corresponds to a decrease in sonication exposure time. In addition to the shift in peaks, an increase in band asymmetry and broadening are observed as the length of sonification time decreases. The broadening of the peaks is reported to result from strain gradients in systems where TiO2 is being chemically anchored to CNTs. These strain effects can extend several nm into materials [71]. To illustrate the relative broadening of the peaks, a measure of full
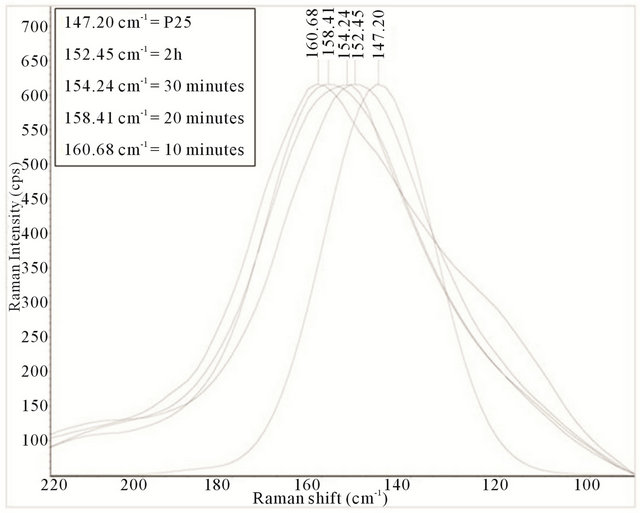
Figure 17. Compiled Raman spectrum illustrating the observed red shift, for the lowest mode (E.g.), for the samples evaluated.
width at half maximum (FWHM) for the samples at the lowest E.g. mode is: 10 minute = 49.1 cm−1, 20 minute = 41.8 cm−1, 30 minute = 41.2 cm−1, 2 h = 39.2 cm−1, P25 = 25.4 cm−1.
The XRD spectra for the hydrothermally treated samples, including 10 minute, 20 minute, 30 minute, and 2 h are presented in Figures 18-21.
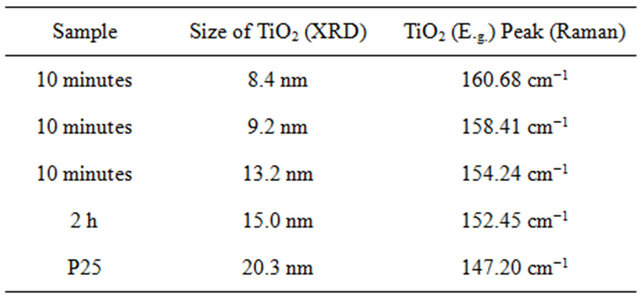
Here the scans were ran from 2θ = 20˚ to 75˚. The spectrums show the characteristics of predominately anatase TiO2 with diffraction peaks at 2θ = 25.18˚ (strongest peak), 37.78˚, 48.00˚, 53.89˚, 54.99˚, 62.57˚, 68.68˚, 70.15˚, and 75.01˚. The average crystal diameter for each sample was calculated from the largest peak by the Scherrer’s equation as described previously. These values are reported in Table 1.
It is clear from the data that the size of TiO2 decreases as the length of deposition time is reduced. The size of the deposited TiO2 versus the observed Raman red opshift, for the lowest mode (E.g.), for the samples evaluated, is also depicted in Table 1. Here a significant correlation is realized where the decreasing crystal size of deposited TiO2 is linked to the observed Raman red shift for the lowest E.g. mode measured for the TiO2.
4. Summary and Conclusions
In this report a novel sonochemical technique and subsequent hydrothermal annealing process, utilized to synthesize crystalline anatase TiO2-SWCNTs was disclosed. This method is low cost and uses readily available equipment and chemical precursors. Additionally, the process is easy and relatively quick, producing chemically attached, uniformly dispersed, TiO2 encapsulated CNTs. These main advantages of the sonochemicalhydrothermal technique generally provide a superior
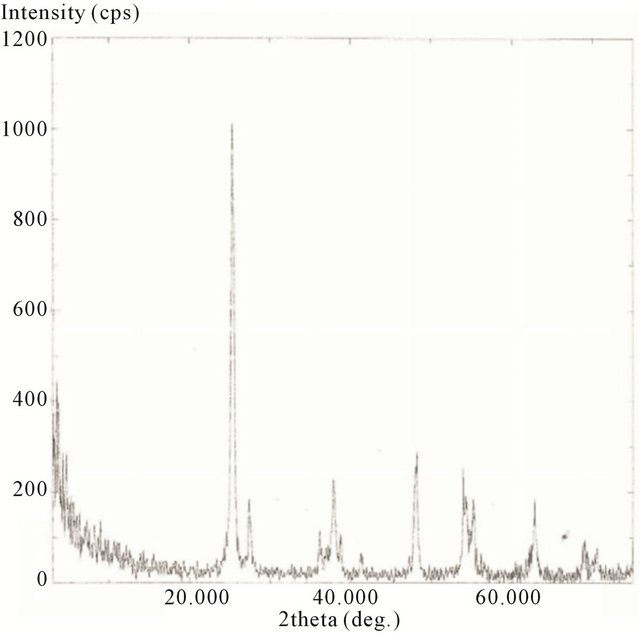
Figure 18. XRD spectrum of calcinated (hydrothermally treated) TiO2 on SWCNTs—10 minute sonication exposure sample.
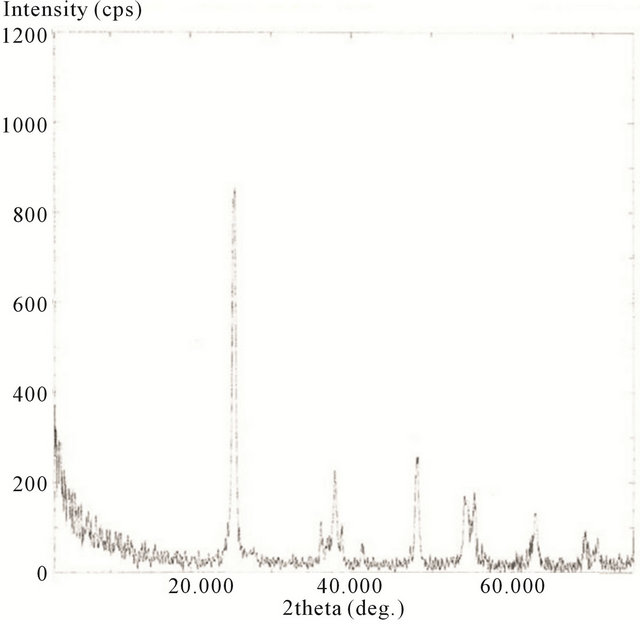
Figure 19. XRD spectrum of calcinated (hydrothermally treated) TiO2 on SWCNTs—20 minute sonication exposure sample.
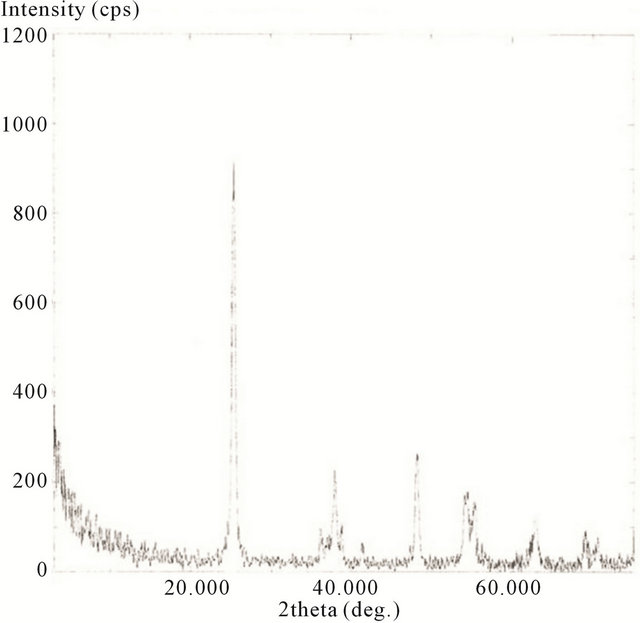
Figure 20. XRD spectrum of calcinated (hydrothermally treated) TiO2 on SWCNTs—30 minute sonication exposure sample.
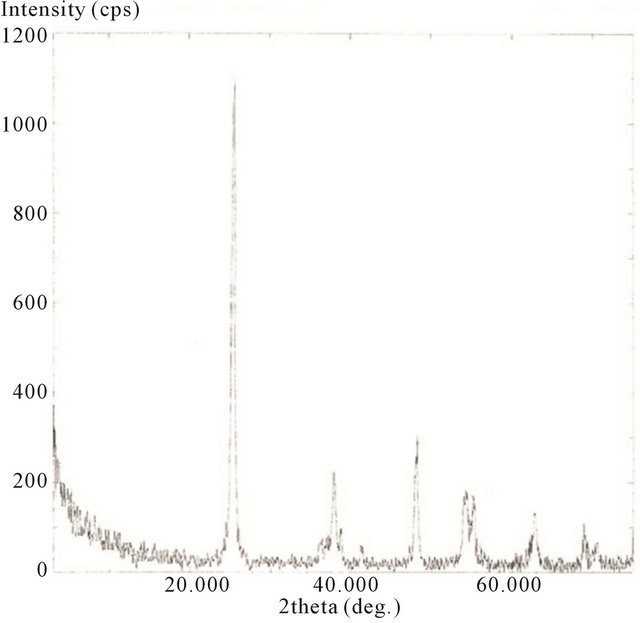
Figure 21. XRD spectrum of calcinated (hydrothermally treated) TiO2 on SWCNTs—2 h sonication exposure sample.
Table 1. TiO2 calculated particle size and specific surface area as determined from XRD correlated with lowest TiO2 E.g. Raman peak.
synthetic route as compared with other processes that are either time consuming, cumbersome, expensive, lack the control for the deposition TiO2, and/or produce inferior results. The TiO2-SWCNTs were characterized by scanning electron microscopy, Raman spectroscopy, and X-ray diffraction. From the characterization the size, ranging from 8.4 to 20.3 nm, anatase and rutile morphology of the synthesized TiO2 nanoparticles were reported. Furthermore, it was postulated that the created TiO2 nanoparticles are chemically attach to SWCNTs. This is supported by the Raman spectra where in addition to the observed red shift in lowest TiO2 E.g. Raman peak, an increase in band asymmetry and broadening are also observed. An important correlation between calculated TiO2 crystal size and the red shifts in the lowest Raman TiO2 (E.g.) predominate peak was reported. The synthesized TiO2-SWCNTs have potential for application in a variety of new technologies such as clean energy power generation devices, electrical storage devices, photocatalysts, and sensors.
5. Acknowledgements
This work was partially supported by AFRL/Clarkson Aerospace Corp Minority Leaders Program, TSU 10- S567-012-02C2. The authors would also like to thank Dr. Tineke Berends, at Houston Community College, for use of the XRD and her assistance with collection of the XRD data.
REFERENCES
- G. A. Alivisatos, “Perspectives on Physical Chemistry of Semiconductor Nanocrystals,” Journal of Physical Chemistry, Vol. 100, No. 31, 1996, pp. 13226-13239. doi:10.1021/jp9535506
- A. Alivisatos, “Semiconductor Clusters, Nanocrystals, and Quantum Dots,” Science, Vol. 271, No. 5251, 1996, pp. 933-937. doi:10.1126/science.271.5251.933
- C. Burda, X. Chen, R. Narayanan and M. A. El-Sayed, “Chemistry and Properties of Nanocrystals of Different Shapes,” Chemical Reviews, Vol. 105, No. 4, 2005, pp. 1025-1102. doi:10.1021/cr030063a
- C. B. Murray, C. R. Kagan and M. G. Bawendi, “Synthesis and Characterization of Monodisperse Nanocrystals and Close-Packed Nanocrystal Assemblies,” Annual Review of Materials Science, Vol. 30, No. 1. 2000, pp. 545- 610. doi:10.1146/annurev.matsci.30.1.545
- Y. Yin and A. P. Alivisatos, “Colloidal Nanocrystal Synthesis and the Organic-Inorganic Interface,” Nature, Vol. 437, No. 7059, 2005, pp. 664-670. doi:10.1038/nature04165
- P. C. Ray, “Size and Shape Dependent Second Order Nonlinear Optical Properties of Nanomaterials and Their Application in Biological and Chemical Sensing,” Chemical Reviews, Vol. 110, No. 9, 2010, pp. 5332-5365. doi:10.1021/cr900335q
- S. Mostafa, F. Behafarid, J. R. Croy, L. K. Ono, L. Li, J. C. Yang, A. I. Frenkel, et al., “Shape-Dependent Catalytic Properties of Pt Nanoparticles,” Journal of the American Chemical Society, Vol. 132, No. 44, 2010, pp. 15714-15719. doi:10.1021/ja106679z
- M. R. Hoffmann, S. T. Martin, W. Choi and D. W. Bahnemann, “Environmental Applications of Semiconductor Photocatalysis,” Chemical Reviews, Vol. 95, No. 1, 1995, pp. 69-96. doi:10.1021/cr00033a004
- J. Jancar, J. F. Douglas, F. W. Starr, S. K. Kumar, P. Cassagnau, A. J. Lesser, S. S. Sternstein, et al., “Current Issues in Research on Structure-Property Relationships in Polymer Nanocomposites,” Polymer, Vol. 51, No. 15, 2010, pp. 3321-3343. doi:10.1016/j.polymer.2010.04.074
- M. Coccia, U. Finardi and D. Margon, “Current Trends in Nanotechnology Research across Worldwide Geo-Economic Players,” The Journal of Technology Transfer, Vol. 37, No. 5, 2012, pp. 777-787. doi:10.1007/s10961-011-9219-6
- A. L. Linsebigler, G. Lu and J. T. Yates, “Photocatalysis on TiO2 Surfaces: Principles, Mechanisms, and Selected Results,” Chemical Reviews, Vol. 95, No. 3, 1995, pp. 735-758. doi:10.1021/cr00035a013
- A. Kongkanand and P. V. Kamat, “Electron Storage in Single Wall Carbon Nanotubes. Fermi Level Equilibration in Semiconductor-SWCNT Suspensions,” ACS Nano, Vol. 1, No. 1, 2007, pp. 13-21. doi:10.1021/nn700036f
- W. Wang, P. Serp, P. Kalck and J. L. Faria, “Visible Light Photodegradation of Phenol on MWNT-TiO2 Composite Catalysts Prepared by a Modified Sol-Gel Method,” Journal of Molecular Catalysis A: Chemical, Vol. 235, No. 1-2, 2005, pp. 194-199. doi:10.1016/j.molcata.2005.02.027
- S. Wang, L. Ji, B. Wu, Q. Gong, Y. Zhu and J. Liang, “Influence of Surface Treatment on Preparing Nanosized TiO2 Supported on Carbon Nanotubes,” Applied Surface Science, Vol. 255, No. 5, 2008, pp. 3263-3266. doi:10.1016/j.apsusc.2008.09.031
- D. Eder and A. H. Windle, “Carbon-Inorganic Hybrid Materials: The Carbon-Nanotube/TiO2 Interface,” Advanced Materials, Vol. 20, No. 9, 2008, pp. 1787-1793. doi:10.1002/adma.200702835
- T. Y. Lee, P. S. Alegaonkar and J. B. Yoo, “Fabrication of Dye Sensitized Solar Cell Using TiO2 Coated Carbon Nanotubes,” Thin Solid Films, Vol. 515, No. 12, 2007, pp. 5131-5135. doi:10.1016/j.tsf.2006.10.056
- C. G. Silva and J. L. Faria, “Photocatalytic Oxidation of Benzene Derivatives in Aqueous Suspensions: Synergic Effect Induced by the Introduction of Carbon Nanotubes in a TiO2 Matrix,” Applied Catalysis B Environmental, Vol. 101, No. 1-2, 2010, pp. 81-89. doi:10.1016/j.apcatb.2010.09.010
- S. Santangelo, G. Messina, G. Faggio, A. Donato, L. De Luca, N. Donato, A. Bonavita, et al., “Micro-Raman Analysis of Titanium Oxide/Carbon Nanotubes-Based Nanocomposites for Hydrogen Sensing Applications,” Journal of Solid State Chemistry, Vol. 183, No. 10, 2010, pp. 2451-2455. doi:10.1016/j.jssc.2010.08.018
- V. Krishna, S. Pumprueg, S. Lee, J. Zhao, W. Sigmund, B. Koopman and B. Moudgil, “Photocatalytic Disinfection with Titanium Dioxide Coated Multi-Wall Carbon Nanotubes,” Process Safety and Environmental Protection, Vol. 83, No. 4, 2005, pp. 393-397. doi:10.1205/psep.04387
- M. Zhang, N. Zhang, J. Chu, J. Sun and Q. Li, “Synthesis of TiO2/Muti-Walled Carbon Nanotubes Composite,” High-Performance Ceramics VI, Vol. 434-435, 2010, pp. 546-548.
- S. Muduli, W. Lee, V. Dhas, S. Mujawar, M. Dubey, K. Vijayamohanan, S.-H. Han, et al., “Enhanced Conversion Efficiency in Dye-Sensitized Solar Cells based on Hydrothermally Synthesized TiO2-MWCNT Nanocomposites,” ACS Applied Materials Interfaces, Vol. 1, No. 9, 2009, pp. 2030-2035. doi:10.1021/am900396m
- A. Jitianu, T. Cacciaguerra, R. Benoit, S. Delpeux, F. Beguin and S. Bonnamy, “Synthesis and Characterization of Carbon Nanotubes-TiO2 Nanocomposites,” Carbon, Vol. 42, No. 5-6, 2004, pp. 1147-1151. doi:10.1016/j.carbon.2003.12.041
- L. Tian, L. Ye, K. Deng and L. Zan, “TiO2/Carbon Nanotube Hybrid Nanostructures: Solvothermal Synthesis and Their Visible Light Photocatalytic Activity,” Journal of Solid State Chemistry, Vol. 184, No. 6, 2011, pp. 1465- 1471. doi:10.1016/j.jssc.2011.04.014
- O. Frank, M. Kalbac, L. Kavan, M. Zukalova, J. Prochazka, M. Klementova and L. Dunsch, “Structural Properties and Electrochemical Behavior of CNT-TiO2 Nanocrystal Heterostructures,” Physica Status Solidi B, Vol. 244, No. 11, 2007, pp. 4040-4045. doi:10.1002/pssb.200776158
- L.-C. Jiang and W.-D. Zhang, “Electrodeposition of TiO2 Nanoparticles on Multiwalled Carbon Nanotube Arrays for Hydrogen Peroxide Sensing,” Electroanalysis, Vol. 21, No. 8, 2009, pp. 988-993. doi:10.1002/elan.200804502
- Y. Zhao, Y. Hu, Y. Li, H. Zhang, S. Zhang, L. Qu, G. Shi, et al., “Super-Long Aligned TiO2/Carbon Nanotube Arrays,” Nanotechnology, Vol. 21, No. 50, 2010, pp. 505702- 50578. doi:10.1088/0957-4484/21/50/505702
- W. Jarernboon, S. Pimanpang, S. Maensiri, E. Swatsitang and V. Amornkitbamrung, “Effects of Multiwall Carbon Nanotubes in Reducing Microcrack Formation on Electrophoretically Deposited TiO2 Film,” Journal of Alloys and Compounds, Vol. 476, No. 1-2, 2009, pp. 840-846. doi:10.1016/j.jallcom.2008.09.157
- J. Cho, S. Schaab, J. A. Roether and A. R. Boccaccini, “Nanostructured Carbon Nanotube/TiO2 Composite Coatings Using Electrophoretic Deposition (EPD),” Journal of Nanoparticle Research, Vol. 10, No. 1, 2007, pp. 99- 105. doi:10.1007/s11051-007-9230-x
- Y. Yang, L. Qu, L. Dai, T. S. Kang and M. Durstock, “Electrophoresis Coating of Titanium Dioxide on Aligned Carbon Nanotubes for Controlled Syntheses of Photoelectronic Nanomaterials,” Advanced Materials, Vol. 19, No. 9, 2007, pp. 1239-1243. doi:10.1002/adma.200602181
- X. Li, J. Niu, J. Zhang, H. Li and Z. Liu, “Labeling the Defects of Single-Walled Carbon Nanotubes Using Titanium Dioxide Nanoparticles,” The Journal of Physical Chemistry B, Vol. 107, No. 11, 2003, pp. 2453-2458. doi:10.1021/jp026887y.
- P. P. George, V. G. Pol, A. Gedanken, A. Gabashivili, M. Cai, A. M. Mance, L. Feng, et al., “Selective Coating of Anatase and Rutile TiO2 on Carbon via Ultrasound Irradiation: Mitigating Fuel Cell Catalyst Degradation,” Journal Of Fuel Cell Science And Technology, Vol. 5, No. 4, 2008, pp. 041012-041020. doi:10.1115/1.2890105
- J. Liu, Y.-T. Kuo, K. J. Klabunde, C. Rochford, J. Wu and J. Li, “Novel Dye-Sensitized Solar Cell Architecture Using TiO2-Coated Vertically Aligned Carbon Nanofiber Arrays,” ACS Applied Materials Interfaces, Vol. 1, No. 8, 2009, pp. 1645-1649. doi:10.1021/am900316f
- S. Orlanducci, V. Sessa, M. Terranova, G. Battiston, S. Battiston and R. Gerbasi, “Nanocrystalline TiO2 on Single Walled Carbon Nanotube Arrays: Towards the Assembly of Organized C/TiO2 Nanosystems,” Carbon, Vol. 44, No. 13, 2006, pp. 2839-2843. doi:10.1016/j.carbon.2006.03.018
- X. Meng, “On Developing Novel Energy-Related Nanostructured Materials By Atomic Layer Deposition,” Ph.D. Dissertation, The University of Western Ontario, London, Ontario, 2011.
- H. Yu, X. Quan, S. Chen and H. Zhao, “TiO2-Multiwalled Carbon Nanotube Heterojunction Arrays and Their Charge Separation Capability,” The Journal of Physical Chemistry C, Vol. 111, No. 35, 2007, pp. 12987-12991. doi:10.1021/jp0728454
- W. Fan, L. Gao and J. Sun, “Anatase TiO2-Coated MultiWall Carbon Nanotubes with the Vapor Phase Method,” Journal of the American Ceramic Society, Vol. 89, No. 2, 2006, pp. 731-733. doi:10.1111/j.1551-2916.2005.00755.x
- W. Feng, Y. Feng, Z. Wu, A. Fujii, M. Ozaki and K. Yoshino, “Optical and Electrical Characterizations of Nanocomposite Film of Titania Adsorbed onto Oxidized Multiwalled Carbon Nanotubes,” Physics, Vol. 17, No. 27, 2005, pp. 4361-4368.
- S.-R. Jang, R. Vittal and K.-J. Kim, “Incorporation of Functionalized Single-Wall Carbon Nanotubes in DyeSensitized TiO2 Solar Cells,” Langmuir the Acs Journal Of Surfaces And Colloids, Vol. 20, No. 22, 2004, pp. 9807-9810. doi:10.1021/la049022f
- Y. Yao, G. Li, S. Ciston, R. M. Lueptow and K. A. Gray, “Photoreactive TiO2/Carbon Nanotube Composites: Synthesis and Reactivity,” Environmental Science Technology, Vol. 42, No. 13, 2008, pp. 4952-4957. doi:10.1021/es800191n
- K. Lee, C. Hu, H. Chen and K. Ho, “Incorporating Carbon Nanotube in a Low-Temperature Fabrication Process for Dye-Sensitized TiO2 Solar Cells,” Solar Energy Materials and Solar Cells, Vol. 92, No. 12, 2008, pp. 1628- 1633. doi:10.1016/j.solmat.2008.07.012
- M. OʼConnell, P. Boul, L. M. Ericson, C. Huffman, Y. Wang, E. Haroz, C. Kuper, et al., “Reversible WaterSolubilization of Single-Walled Carbon Nanotubes by Polymer Wrapping,” Chemical Physics Letters, Vol. 342, No. 3-4, 2001, pp. 265-271.
- South West Nano Technologies, “CG200 Data Sheet,” 2009. http://www.swentnano.com/tech/docs/Final_CG_200_Data_Sheet.pdf
- I. W. Chiang, B. E. Brinson, R. E. Smalley, J. L. Margrave and R. H. Hauge, “Purification and Characterization of Single-Wall Carbon Nanotubes,” The Journal of Physical Chemistry B, Vol. 105, No. 6, 2001, pp. 1157- 1161. doi:10.1021/jp003453z
- B. J. Landi, R. P. Raffaelle, S. L. Castro and S. G. Bailey, “Single-Wall Carbon Nanotube-Polymer Solar Cells,” Progress in Photovoltaics Research and Applications, Vol. 13, No. 2, 2005, pp. 165-172. doi:10.1002/pip.604
- J. Liu, A. G. Rinzler, H. Dai, J. H. Hafner, R. K. Bradley, P. J. Boul, A. Lu, et al., “Fullerene Pipes,” Science, Vol. 280, No. 5367, 1998, pp. 1253-1256. doi:10.1126/science.280.5367.1253
- A. G. Rinzler, J. Liu, H. Dai, P. Nikolaev, C. B. Huffman, F. J. Rodríguez-Macías, P. J. Boul, et al., “Large-Scale Purification of Single-Wall Carbon Nanotubes: Process, Product, and Characterization,” Applied Physics A Materials Science Processing, Vol. 67, No. 1, 1998, pp. 29-37. doi:10.1007/s003390050734
- J. E. Trancik, S. C. Barton and J. Hone, “Transparent and Catalytic Carbon Nanotube Films,” Nano Letters, Vol. 8, No. 4, 2008, pp. 982-987. doi:10.1021/nl071945i
- J. L. Zimmerman, R. K. Bradley, C. B. Huffman, R. H. Hauge and J. L. Margrave, “Gas-Phase Purification of Single-Wall Carbon Nanotubes,” Carbon Nanotubes, Vol. 34, No. 5, 2000, pp. 1361-1366.
- P. C. Eklund, J. M. Holden and R. A. Jishi, “Vibrational Modes of Carbon Nanotubes; Spectroscopy and Theory,” Carbon, Vol. 33, No. 7, 1995, pp. 959-972. doi:10.1016/0008-6223(95)00035-C
- K. Lakoubovskii, N. Minami, T. Ueno, S. Kazaoui and H. Kataura, “Optical Characterization of Double-Wall Carbon Nanotubes: Evidence for Inner Tube Shielding,” Journal of Physical Chemistry B, Vol. 112, No. 30, 2008, pp. 11194-11198.
- C. Fantini, A. Jorio, M. Souza, M. S. Strano, M. S. Dresselhaus and M. A. Pimenta, “Optical Transition Energies for Carbon Nanotubes from Resonant Raman Spectroscopy: Environment and Temperature Effects,” Physical Review Letters, Vol. 93, No. 14, 2004, pp. 147406-147409. doi:10.1103/PhysRevLett.93.147406
- A. Souza Filho, S. Chou, G. Samsonidze, G. Dresselhaus, M. Dresselhaus, L. An, J. Liu, et al., “Stokes and AntiStokes Raman Spectra of Small-Diameter Isolated Carbon Nanotubes,” Physical Review B, Vol. 69, No. 11, 2004, pp. 1-8. doi:10.1103/PhysRevB.69.115428
- H. Kataura, Y. Maniwa, S. Masubuchi, S. Kazama, X. Zhao, Y. Ando, Y. Ohtsuka, S. Suzuki, Y. Achiba and R. Saito, “Bundle Effects of Single-Wall Carbon Nanotubes,” AIP Conference Proceedings, Vol. 544, 2000, pp. 262-265. doi:10.1063/1.1342514
- RRUFF, “Silver R070463,” 2005. http://rruff.info/silver/display=default/R070463
- D. Eder and A. H. Windle, “Carbon-Inorganic Hybrid Materials: The Carbon-Nanotube/TiO2 Interface,” Advanced Materials, Vol. 20, No. 9, 2008, pp. 1787-1793. doi:10.1002/adma.200702835
- Y. Xie, S. H. Heo, S. H. Yoo, G. Ali and S. O. Cho, “Synthesis and Photocatalytic Activity of Anatase TiO2 Nanoparticles-Coated Carbon Nanotubes,” Nanoscale Research Letters, Vol. 5, No. 3, 2009, pp. 603-607. doi:10.1007/s11671-009-9513-5
- N. Darsono, D.-H. Yoon and J. Kim, “Milling and Dispersion of Multi-Walled Carbon Nanotubes in Texanol,” Applied Surface Science, Vol. 254, No. 11, 2008, pp. 3412-3419. doi:10.1016/j.apsusc.2007.11.028
- D. Zhang, L. Shi, J. Fang, K. Dai and X. Li, “Preparation and Desalination Performance of Multiwall Carbon Nanotubes,” Materials Chemistry and Physics, Vol. 97, No. 2-3, 2006, pp. 415-419. doi:10.1016/j.matchemphys.2005.08.036
- T. Ohsaka, “Temperature Dependence of the Raman Spectrum in Anatase TiO2,” Journal of the Physical Society of Japan, Vol. 48, No. 5, 1980, pp. 1661-1668. doi:10.1143/JPSJ.48.1661
- [61] M. Mikami, S. Nakamura, O. Kitao and H. Arakawa, “Lattice Dynamics and Dielectric Properties of TiO2 Anatase: A First-Principles Study,” Physical Review B, Vol. 66, No. 15, 2002, pp. 1-6. doi:10.1103/PhysRevB.66.155213
- [62] G. A. Tompsett, G. A. Bowmaker, R. P. Cooney, J. B. Metson, K. A. Rodgers and J. M. Seakins, “The Raman Spectrum of Brookite, TiO2 (Pbca, Z = 8),” Journal of Raman Spectroscopy, Vol. 26, No. 1, 1995, pp. 57-62. doi:10.1002/jrs.1250260110
- [63] A. L. A. Parussulo, J. A. Bonacin, S. H. Toma, K. Araki and H. E. Toma, “Unravelling the Chemical Morphology of a Mesoporous Titanium Dioxide Interface by Confocal Raman Microscopy: New Clues for Improving the Efficiency of Dye Solar Cells and Photocatalysts,” Langmuir The Acs Journal Of Surfaces And Colloids, Vol. 25, No. 19, 2009, pp. 11269-11271. doi:10.1021/la902551k
- [64] W. Shao, F. Gu, C. Li and M. Lu, “Interfacial Confined Formation of Mesoporous Spherical TiO2 Nanostructures with Improved Photoelectric Conversion Efficiency,” Inorganic Chemistry, Vol. 49, No. 12, 2010, pp. 5453-5459.
- [65] K. Porkodi and S. D. Arokiamary, “Synthesis and Spectroscopic Characterization of Nanostructured Anatase Titania: A Photocatalyst,” Materials Characterization, Vol. 58, No. 6, 2007, pp. 495-503. doi:10.1016/j.matchar.2006.04.019
- [66] M. A. Lillo-Ródenas, N. Bouazza, A. Berenguer-Murcia, J. J. Linares-Salinas, P. Soto and A. Linares-Solano, “Photocatalytic Oxidation of Propene at Low Concentration,” Applied Catalysis B: Environmental, Vol. 71, No. 3-4, 2007, pp. 298-309. doi:10.1016/j.apcatb.2006.10.004
- [67] N. Bouazza, M. Ouzzine, M. A. Lillo-Ródenas, D. Eder and A. Linares-Solano, “TiO2 Nanotubes and CNT-TiO2 Hybrid Materials for the Photocatalytic Oxidation of Propene at Low Concentration,” Applied Catalysis B Environmental, Vol. 92, No. 3-4, 2009, pp. 377-383. doi:10.1016/j.apcatb.2009.08.017
- [68] Y. Yao, G. Li, S. Ciston, R. M. Lueptow and K. A. Gray, “Photoreactive TiO2/Carbon Nanotube Composites: Synthesis and Reactivity,” Environmental Science and Technology, Vol. 42, No. 13, 2008, pp. 4952-4957. doi:10.1021/es800191n
- [69] W. F. Zhang, M. S. Zhang, Z. Yin and Q. Chen, “Photoluminescence in Anatase Titanium Dioxide Nanocrystals,” Applied Physics B Lasers and Optics, Vol. 70, No. 2, 2000, pp. 261-265. doi:10.1007/s003400050043
- [70] D. Bersani, P. P. Lottici and X.-Z. Ding, “Phonon Confinement Effects in the Raman Scattering by TiO2 Nanocrystals,” Applied Physics Letters, Vol. 72, No. 1, 1998, pp. 73-75. doi:10.1063/1.120648
- [71] S. Santangelo, G. Messina, G. Faggio, A. Donato, L. De Luca, N. Donato, A. Bonavita, et al., “Micro-Raman Analysis of Titanium Oxide/Carbon Nanotubes-Based Nanocomposites for Hydrogen Sensing Applications,” Journal of Solid State Chemistry, Vol. 183, No. 10, pp. 2451- 2455. doi:10.1016/j.jssc.2010.08.018
- [72] S. Muduli, W. Lee, V. Dhas, S. Mujawar, M. Dubey, K. Vijayamohanan, S.-H. Han, et al., “Enhanced Conversion Efficiency in Dye-Sensitized Solar Cells based on Hydrothermally Synthesized TiO2-MWCNT Nanocomposites,” ACS Applied Materials Interfaces, Vol. 1, No. 9, 2009, pp. 2030-2035. doi:10.1021/am900396m
NOTES
*Corresponding author.