Open Journal of Medicinal Chemistry
Vol.3 No.1(2013), Article ID:29485,5 pages DOI:10.4236/ojmc.2013.31004
A Sensitive Reversed-Phase High-Performance Liquid Chromatography Method for the Quantitative Determination of Milk Xanthine Oxidase Activity
Fisheries College of Jimei University, Engineering Research Center of Eel Modern Industrial Technology, Ministry of Education, Xiamen, China
Email: zhqinli@jmu.edu.cn
Received January 13, 2013; revised February 15, 2013; accepted February 26, 2013
Keywords: Xanthine Oxidase (XO); Enzyme Activity Assay; Reversed-Phase High Performance Liquid Chromatography (RP-HPLC)
ABSTRACT
A new reversed-phase high performance liquid chromatography method was developed to quantitate the activity of xanthine oxidase involved in milk fat globule membrane with xanthine as the substrate and the separation of product (uric acid). The increment of uric acid in the reaction system was used to calculate the total activity of XO. The optimized assay conditions, linearity of detection, recovery of uric acid and chromatogram were developed in text, indicating this method is simple, rapid and efficient. It is an alternative potential method for the determination of the activity of XO in milk.
1. Introduction
The molybdoenzyme xanthine oxidase (XO, EC1.2.3.22) has been studied intensively over the last 60 years [1], that occurs as a major protein component of the milk fat globule membrane surrounding lipid droplets, from which it is readily available, even on a gram scale. The enzyme has broad substrate specificity including purines, petridines, heterocyclic molecules and aldehydes. XO comprises four distinct redox active centers: the Mo active site, two spectroscopically distinct [2Fe-2S] clusters and a flavin adenine dinucleotide (FAD) cofactor, and is capable of reducing oxygen to generate the reactive oxygen species (ROS), superoxide and hydrogen peroxide [2]. In vivo it mainly catalyzes the oxidation of hypoxanthine to xanthine and of xanthine to uric acid, producing the oxidants  or H2O2. The generation of these oxygen species has been implicated as a key oxidative enzyme in the pathogenesis of tissue injury associated with many diseases, such as hepatitis, inflammation, ischemiareperfusion, carcinogenesis and aging [3]. Serum levels of XO rise in individuals with viral hepatitis or toxic liver injury, indicating that plasma enzyme activity is a sensitive marker of acute hepatocellular damage or other oxidant-mediated tissue damage [4-6]. In addition, XO can be used as a detection reagent for quantitating superoxide dismutase, serum inorganic phosphorus, and nucleoside etc.
The activity of this enzyme usually are estimated using Nitro blue tetrazolium (NBT), p-Methoxybenzenesulfonyl(MBS), 2,3,6-Trimethylbenzenesulfonyl(MTS), pMethylbenzylsulfonyl(PMS) and 2-NH2-4-OH-pteridine as electron acceptors, and the products of chromogenic or fluorogenic derivatives are quantified. Some articles have described the development of analytical procedure for the determination of XO activity [7-10]. However, in general the acceptance of NBT or MTS-PMS as useful chromogenic reagents has been low water-solubility, and spectrophotometric detection of Uric acid as the product of XO reaction is interfered by other compounds with ultraviolet absorption in reaction system. Measurement methods of xanthine oxidase activity are not included in routine laboratory analyses, mainly because of the lack of good stability and fidelity in complicated samples, especially in microbe cell extracts. We have now developed a new sensitive method for the measurement of xanthine oxidase activity in complex system with RP-HPLC by a UV detector.
2. Materials and Methods
2.1. Materials
Standard milk xanthine oxidase (XO, 0.67 U/mg) and uric acid (UA) powder was obtained from Sigma Sigma Chemical Co. (St. Louis, MO). Xanthine powder was came from Fluka. All other organic reagents,inorganic salts, HCl and NaOH were of chromatographic pure grade, and purchased from Sinopharm Chemical Reagent Co., Ltd. Water was HPLC Grade purified by NANO pure®, Barnstead system (Dubuque, IA).
2.2. Apparatus and Technique
The HPLC system consisted of an Agilent 1100 HPLC apparatus (Hewlett-Packard, Palo Alto, Amarica), a ultraviolet HPLC monitor, a automatic sampler, chromatographic work station, and vacuum deairing chromatopac. The mobilephase was 20 mM ammonium dihydrogen phosphate buffer (pH 7.5), the flow-rate was 1.0 ml/min and the detection wavelength were 290 nm, A octadecylsilyl (ODS) C18 column (250 mm × 4.6 mm I.D., 5 μm) (VARIAN MICROSORB-MV 100-5) was used at room temperature. The injection volume was 20 μL. A linear calibration curve for uric acid was obtained between 0.05 mM and 2.0 mM.
2.3. Sample Preparation and Enzyme Extraction
For milk xanthine oxidase, cells, corresponding to about 100mg cell wet mass, were harvested by centrifugation for 15 min at 12,000 g and 4˚C, and then redissolved in Tris-HCl buffer (50 mmol/L, pH7.6). Crude enzyme extracted with supersonic crushing at 250W for 15 min in icebath, and then centrifugated for 10 min at 15,000 g and 4˚C (CR22GII, Hitachi, Tokyo, Japan). Cell samples were also collected before and 20 min after xanthine added in resting cell suspension. These samples were also assayed for xanthine oxidase activity.
2.4. Analytical Procedure
All solutions were prepared using HPLC Grade water. The primary standard stock solutions of uric acid (UA) at 10 mM was prepared in phosphate buffer, and the standard stock solution of xanthine (XA) at 24 mM was prepared in 0.1 N NaOH after weight correction for purity. Moreover the analytical solutions still included 7 M HCL, 5 M K2CO3 and 50 mM Tris-HCl buffer at pH 8.4, by adding 50 μM oxonic acid solution (inhibitor of uricase).
The solutions, reagents, standards and samples were brought to room temperature before being assayed. Prepare the following reaction mixture in a cuvette, composed of 0.9 mL Tris-HCl buffer as above, 30 μL XA solution whose final standard concentration was 0.72 mM, and 50 μL XO crude enzyme in turns, and then thermostated at 37˚C for 20 minutes. The enzyme reaction was terminated eventually by the addition of 15 μL of 7 M HCL. The resulting mixture was vigorously shaken with an agitator and then centrifuged for 10 min at 15,000 g. The samples were transferred to Amicon Centrifree® filters and centrifuged for 30 min in a fixed angle centrifuge. Cell proteins and other impurity were retained by the filter while the analytes passed through the filter. The filtrates were transferred to autosampler vials. A portion (300 μL) of the supernatant was neutralized with 5 μL of 5M K2CO3, and 20 μL of the neutralized supernatant were injected onto the HPLC. Xanthine oxidase activity was measured in duplicate and expressed as micromoles of uric acid produced per minute per milliliter (μmol/ min/ml).
3. Results
3.1. Determination of HPLC Conditions for Separation of Uric Acid and Xantihne in Xanthine Oxidase Reaction Mixtures
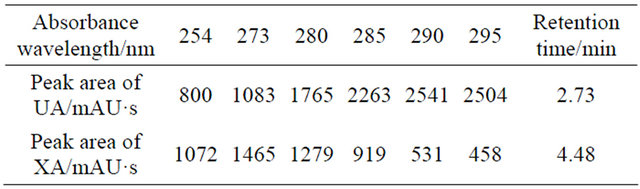
A system suitability solution was prepared in non-matrix solution at concentrations of UA and XA at 0.20 and 0.15 mM, respectively, in 20 mM NH4H2PO4. It was used for checking the suitability of the system before each batch. Working standards were prepared by adding the appropriate volumes of UA/XA standard solution into volumetric flasks and diluting with 20 mM NH4H2PO4. Because the analytes were endogenous compounds, variable concentrations were found in control cell supersonic crushing supernatant liquid from individuals not dosed with the xanthine oxidase inhibitor. Standards were prepared in analyte-free phosphate solution. Solutions at six different concentrations from 0.01/0.1 to 2/15 mM of UA/XA and were stored at −20˚C for up to several weeks. It shows the different absorbance peak area of UA and XA at different UV detector wavelength in Table 1. The optimal detect wavelength of UA and XA observed in our results were 290 and 273 nm respectively on Agilent 1100 HPLC work station, and the retention times of UA and XA were 2.7 and 4.5 min respectively eluted by 20 mM NH4H2PO4 buffer at pH 8.0 on VARIAN ODS C18 column.
Preliminary optimization of separation conditions for UA and XA in XO reaction mixtures was developed as follow. Samples containing 0.20 mM UA, 0.15 mM XA and neutralized supernatant of XO crude enzyme were incubated at 37˚C with 50 mM Tris-HCl buffer (pH 8.4) for 20 min. Prepare five different mobile phase, methanol—90% H2O2, acetonitrile—90% H2O2, methanol— 90% KH2PO4 buffer (20 mM, pH 7.5), methanol—90% ammonium dihydrogen citric acid buffer (20 mM, pH 7.5)Table 1. The HPLC absorbance of UA and XA standard solution in the XO reaction system.
and methanol-90% NH4H2PO4 buffer (20 mM, pH 8.0). The corresponding reaction mixtures including UA and XA were separated on HPLC C18 column eluted by different above-mentioned mobile phase (data not shown). The peak of UA was eluted first, and then XA followed. The separation rate of UA/XA was 0.78, 0.43, 1.09, 1.19 and 1.85 respectively, indicating that the suitable mobile phase is methanol-90% NH4H2PO4 buffer (20 mM, pH 8.0), which UA and XA can achieve valid separation. Then the same samples were eluted using different mobile phase with several proportion of methanol and NH4H2PO4 buffer (data not shown). On HPLC chromatogram the retention times of UA and XA display the best eluant is 100% NH4H2PO4 buffer. Further XO reaction mixtures were assayed with RP-HPLC by mobile phase on the basis of 100% NH4H2PO4 buffer with various kinds of pH5.0, 6.0, 7.0, 7.5, 8.0, 8.5 (data not shown), indicating that the optimal pH of the NH4H2PO4 buffer is 7.5.
3.2. Linearity of Detection, Recovery of Uric Acid and HPLC-Drawn Chromatogram
A calibration curve prepared with various concentrations of UA in NH4H2PO4 aqueous solution was linear up to 2.0 mM. The lower detection limit for UA was 10 μM and the relative standard deviation for retention time and peak area was below 1.02% and 1.15% respectively at all concentrations between 0.05 and 2.0 mM. The regression line was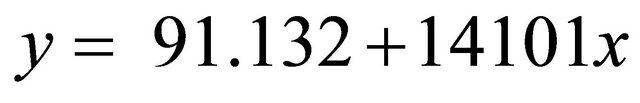 , where y is concentration of UA (mM) and x is peak area, and the correlation coefficient was 0.996. The UA recovery was 98% at all concentrations. The high recovery value indicated that none of the analytes were significantly bound to XO proteins, or adsorbed to the ultrafiltration filter or test tube walls. A representative chromatogram is shown in Figure 1. Sample containing 2.0 mM UA, 5.0 mM XA and neutralized supernatant of XO deactivated crude enzyme were incubated at 37˚C with 50 mM Tris-HCl buffer (pH 8.4) for 20 min. The peaks of UA and XA were observed at 3.1 and 6.3 min, respectively.
3.3. Optimization of Conditions for the Measurement of Xanthine Oxidase Activity
Studies were performed to optimize the conditions for accurate measurement of intracellular XO activity. The effects of temperature and pH on the reaction were investigated and results were summarized in Tables 2 and 3. As regards the effect of temperature, that absorbance peak area of UA in reaction system at first increased with increasing temperature was observed. At temperature of 37˚C, a maximal UA absorbance peak appeared. Afterwards the absorbance peak area of UA decreased with further increasing temperature. The effect of pH on the
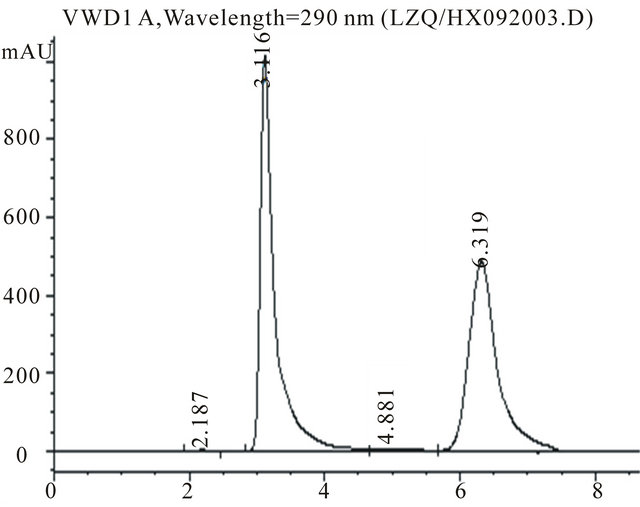
Figure 1. Representative HPLC chromatogram of UA and XA in XO crude enzyme reaction mixture. (Peaks 1 and 2 are UA and XA, respectively. The concentration of UA and XA in the reaction mixture was 2.0 and 5.0 mM respectively.)
Table 2. The effect of temperature on the XO reaction system.
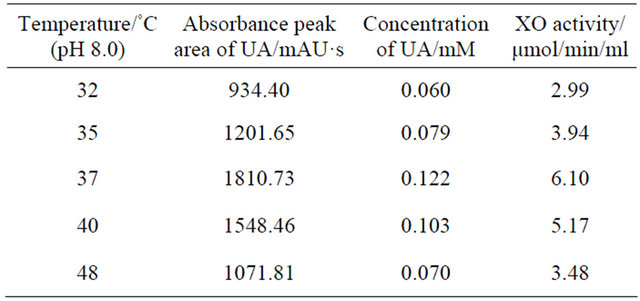
Table 3. The effect of pH on the XO reaction system.
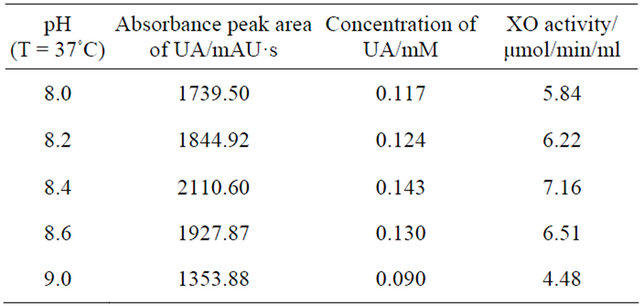
reaction system was similar with temperature. The maximal UA absorbance peak appeared only when pH value was 8.4. Smaller or larger than this value all resulted in a drop of the UA absorbance peak. The average recovery of XO activity was 96%.
The relation of the speed of enzymatic reaction of XO and the concentration of substrate (xanthine) was investigated, through different concentration of XA which was 0.06, 0.12, 0.24, 0.32, 0.48, 0.60, 0.80, 1.0, 1.2, 1.6, 2.0 and 2.4 mM respectively, and the permanent activity of XO was about 6.5 U/ml. On the basis of LineweaverBurk double-reciprocal plot, the linear equation was obtained, (1/V) = 1.355 ´ (1/S) + 42.299,whose relative coefficient was 0.9977. Furthermore Michaelis constant (Km) of XO was calculated and was 0.032 mM. According to this experimental result, 0.72 mM XA is suitable to be used as the concentration of substrate for the determination of XO activity.
The XO reaction system, terminated at 4, 8, 12, 16, 20, 22, 24, 26, 28 and 30 min respectively as the procedure mentioned at analytical procedure as above, were assayed with RP-HPLC and the area of UA peak were recorded(data not shown). The value of absorption at first increased with the increase of reaction time and reached equilibrium at time of 20 min (Figure 2), which was represented with Cmax. The relation of UA concentration against time could be described with first class kinetic equation, which was shown in Figure 3. This kinetic equation is ln(Cmax − Ct) = −0.1636t − 1.7803, with correlation coefficient R = 0.9956 .
4. Discussion
To date, the activity of xanthine oxidase has been determined by HPLC method for measuring the conversion of pterin to isoxanthopterin in human plasma [11-15], radiometric [16], fluorometric [17,18] and ELISA [19] methods in serum. The serum/plasma activities were reported to be very low. An enzymatic method using pterin as substrate was reported for cell culture [20]. However, xanthine, hypoxanthine and uric acid in plasma/serum may competitively inhibit the production of isoxanthopterin by xanthine oxidase, and these methods used a relatively long incubation time with an artificial substrate. We develop a sensitive RP-HPLC method using xanthine as a substrate directly and shortening the incubative reaction time to measuring the activity of xanthine oxidase in milk. We have also shown that relative high concentrations of xanthine, hypoxanthine and uric acid in the reaction mixture can not inhibit the activity of xanthine oxidase in milk. The method was simple and robust with
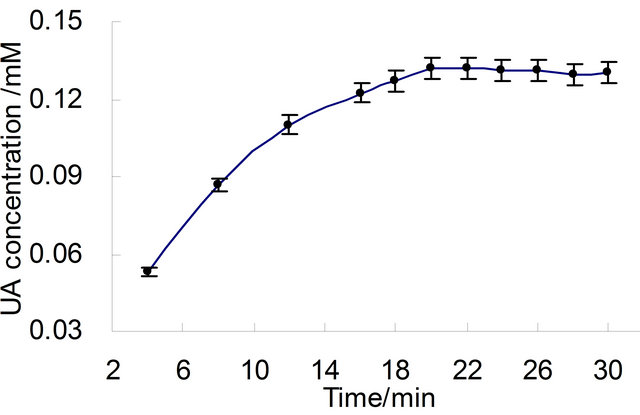
Figure 2. Curve of UA concentration versus time in reaction mixtures (reaction conditions: T = 37˚C, pH 8.4).
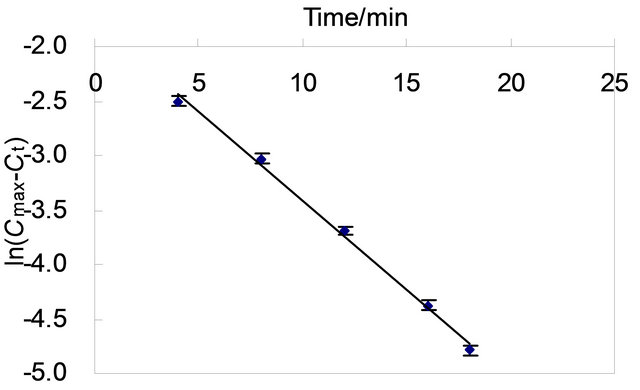
Figure 3. Kinetic curve of the XO reaction.
good accuracy and precision for the measurement of xanthine oxidase activity.
5. Acknowledgements
We appreciate the financial support of the Nature Science Foundation of Fujian in China (2012J06008), the National Training Programs of Innovation and Entrepreneurship for Undergraduates (Z81231), the Key Program of Xiamen City (3502Z20110014, 3502Z20123027), the Innovation Team Found of Jimei University (2010A003), the Scientific Research Start Fund for Doctors of Jimei University (ZQ2008015), and the Found for Outstanding Young Teachers in Jimei University (2008C001).
REFERENCES
- R. Harrison, “Structure and Function of Xanthine Oxidoreductase [J],” Free Radical Biology & Medicine, Vol. 33, No. 6, 2002, pp. 774-797. doi:10.1016/S0891-5849(02)00956-5
- S. A. Sanders, R. Eisenthal and R. Harrison, “NADH Oxidase Activity of Human Xanthine Oxidoreductase— Generation of Superoxide Anion [J],” European Journal of Biochemistry, Vol. 245, No. 3, 1997, pp. 541-548. doi:10.1111/j.1432-1033.1997.00541.x
- F. Borges, E. Fernandes and F. Roleira, “Progress towards the Discovery of Xanthine Oxidase Inhibitors [J],” Current Medicinal Chemistry, Vol. 9, No. 2, 2002, pp. 195-217. doi:10.2174/0929867023371229
- S. H. Giler, O. Sperling, S. Brosh, et al., “Serum Xanthine Oxidase in Jaundice [J],” Clinica Chimica Acta, Vol. 63, No. 1, 1975, pp. 37-40. doi:10.1016/0009-8981(75)90375-7
- S. H. Giler, Y. Eshel and J. Pinkhas, et al., “Elevation of Serum Xanthine Oxidase Activity Following Halothane Anesthesia in Man [J],” Experientia, Vol. 33, No. 10, 1977, pp. 1356-1358. doi:10.1007/BF01920178
- S. Tan, R. Radi and F. Gaudier, et al., “Physiological Levels of Uric Acid Inhibit Xanthine Oxidase in Human Plasma [J],” Pediatric Research, Vol. 34, No. 5, 1993, pp. 303-307. doi:10.1203/00006450-199309000-00013
- A. H. Cory, T. C. Owen, J. A. Barltrop, et al., “Use of an aqueous Soluble Tetrazolium/Formazan Assay for Cell Growth Assays in Culture [J],” Cancer Communications, Vol. 3, No. 7, 1991, pp. 207-212.
- R. Fried, “Xanthine Dehydrogenase [J],” Analytical Biochemistry, Vol. 16, No. 3, 1966, pp. 427-432. doi:10.1016/0003-2697(66)90224-7
- G. G. Guilbault, D. N. Kramer and P. L. Cannon, “Electrochemical Determination of Organophosphorus Compounds and Analysis of Xamhine Oxidase and Sulfydryl Inhibitor [J],” Analytical Chemistry, Vol. 36, No. 7, 1964, pp. 606-614. doi:10.1021/ac60209a015
- A. Weinstein, G. Mendes and G. Litwack, “Isotopic Method for Tyrosine Transaminase Activity [J],” Analytical Biochemistry, Vol. 21, No. 1, 1967, pp. 86-97. doi:10.1016/0003-2697(67)90086-3
- T. Sasaoka, N. Kaneda and T. Nagatsu, “Highly Sensitive Assay for Xanthine Oxidase Activity by High-Performance Liquid Chromatography with Fluorescence Detection [J],” Journal of Chromatography B, Vol. 424, No. 2, 1988, pp. 392-397.
- T. Yamamoto, Y. Moriwaki and S. Takahashi, et al., “Determination of Human Plasma Xanthine Oxidase Activity by High-Performance Liquid Chromatography [J],” Journal of Chromatography B, Vol. 681, No. 2, 1996, pp. 395-400. doi:10.1016/0378-4347(96)00071-0
- Y. Xia and J. L. Zweier, “Substrate Control of Free Radical Generation from Xanthine Oxidase in the Postischemic Heart [J],” Journal of Biological Chemistry, Vol. 270, No. 32, 1995, pp. 18797-18803. doi:10.1074/jbc.270.32.18797
- Y. Xia, G. Khatchikian and J. L. Zweier, “Adenosine Deaminase Inhibition Prevents Free Radical-Mediated Injury in the Postischemic Heart [J],” Journal of Biological Chemistry, Vol. 271, No. 17, 1996, pp. 10096-10102. doi:10.1074/jbc.271.17.10096
- G. Buonocore, S. Perrone and M. Longini, et al., “Total Hydroperoxide and Advanced Oxidation Protein Products in Preterm Hypoxic Babies [J],” Pediatric Research, Vol. 47, No. 2, 2000, pp. 221-224. doi:10.1203/00006450-200002000-00012
- U. Al-Khalidi, S. Nasrallah, A. K. Khachadurian, et al., “A Sensitive Method for the Determination of Xanthine Oxidase Activity [J],” Clinica Chimica Acta, Vol. 11, No. 1, 1965, pp. 72-77. doi:10.1016/0009-8981(65)90091-4
- A. McHale, H. Grimes and M. P. Coughlan, “Human Serum Xanthine Oxidase: Fluorometric Assay Applicable to the Investigation of Liver Disorders [J],” International Journal of Biochemistry, Vol. 10, No. 4, 1979, pp. 317- 319. doi:10.1016/0020-711X(79)90096-X
- J. S. Beckman, D. A. Parks, J. D. Pearson, et al., “A Sensitive Fluorometric Assay for Measuring Xanthine Dehydrogenase and Oxidase in Tissues [J],” Free Radical Biology and Medicine, Vol. 6, No. 6, 1989, pp. 607-615. doi:10.1016/0891-5849(89)90068-3
- M. G. Battelli, A. Abbondanza, S. Musiani, et al., “Determination of Xanthine Oxidase in Human Serum by a Competitive Enzyme-Linked Immunosorbent Assay [J],” Clinica Chimica Acta, Vol. 281, No. 1-2, 1999, pp. 147- 158. doi:10.1016/S0009-8981(98)00220-4
- A. Atlante, D. Valenti, S. Gagliardi, et al., “A Sensitive Method to Assay The Xanthine Oxidase Activity in Primary Cultures of Cerebellar Granule Cells [J],” Brain Research Protocols, Vol. 6, No. 1-2, 2000, pp. 1-5. doi:10.1016/S1385-299X(00)00030-1