Open Journal of Radiology
Vol. 2 No. 3 (2012) , Article ID: 23311 , 4 pages DOI:10.4236/ojrad.2012.23014
Analysis of Degenerative Discs in Lumbar Spondylolisthesis Using MRI T2 Mapping
Department of Orthopedic Surgery, School of Medicine, Sapporo Medical University, Sapporo, Japan
Email: takebaya@sapmed.ac.jp
Received June 30, 2012; revised July 28, 2012; accepted August 7, 2012
Keywords: Degenerative Spondylolisthesis; Intervertebral Disc; T2 Mapping
ABSTRACT
Background: Spinal instability, including lumbar degenerative spondylolisthesis (DS), mainly results from degeneration of intervertebral discs (IVD) and the facet joints (FJ). Characterization of the relationship between IVD degeneration in cases of lumbar degenerative spondylolisthesis (DS), and T2 values may be useful for accurate noninvasive evaluation and subsequent treatment. Thus, the goal of this study was to measure T2 values of IVDs in cases with (DS) and without (NS) spondylolisthesis, and to characterize changes of IVDs in DS. Methods: A total of 40 subjects who presented with L4 spondylolisthesis comprised the DS group. Another 40 subjects who did not have lumbar spondylolisthesis, constituted the NS group. T2 values of IVDs were measured and compared in these groups. Results: T2 values for IVDs tended to be lower in the DS group than in the NS group, and these values were significantly different (p < 0.01) within the anterior annulus fibrosus (AF). No significant differences in T2 values between Meyerding grades I and II were observed in any areas of IVDs. Conclusions: It is speculated that in the early stages, the degeneration of the anterior AF develops and is related to the onset of lumbar spondylolisthesis, while in later stages, degeneration of facet joints influences the progression of spondylolisthesis.
1. Introduction
Imaging plays an important role in the diagnosis of lumbar degenerative disease, and magnetic resonance imaging (MRI) is the most important imaging modality for the diagnosis of intervertebral disc (IVD) lesions. Decreased signal intensity of an IVD on T2-weighted image reflects aging and degeneration, and this signal change makes the evaluation of disc degeneration possible [1-3].
Among MRI techniques, T2 mapping can quantify water content and can thus be used for detecting early cartilage pathology and tracking response to therapy [4].
Spinal instability, including lumbar degenerative spondylolisthesis (DS), mainly results from degeneration of IVDs as an anterior supporting mechanism and degeneration of the facet joints (FJs) as the posterior supporting mechanism [5-7]. Thus, degeneration in either structure is considered a causative factor of low back pain. In IVDs, the annulus fibrosus (AF) surrounds the translucent nucleus pulposus (NP) in the center of the disc, which is firmly connected to the epiphysis by an end plate formed of hyaline cartilage [8]. However, in degenerated IVDs, stability is compromised because of the failure of these tight connections between adjacent vertebral bodies.
Water and proteoglycan content both decrease during IVD degeneration [9,10]. These changes can be detected by variations in MRI T2 values because these values correspond to the water content [9,11]. Characterization of the relationship between IVD degeneration in cases of lumbar DS, and T2 values may be useful for accurate noninvasive evaluation and subsequent treatment. Thus, the goal of this study was to measure T2 values of IVDs in cases with (DS) and without (NS) spondylolisthesis, and to characterize changes of IVDs in DS.
2. Materials and Methods
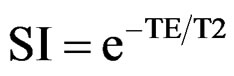
Written informed consent was obtained from all participating subjects, and all protocols were approved by the ethics committee of the institution where the study was conducted. All DS and NS subjects underwent MRI of the lumbar spine in our hospital after presenting with low back pain as well as lower limb numbness, tingling, and pain, with associated lumbar spondylosis. Exclusion criteria were previous history of lumbar surgery or obvious disc herniation without lumbar spondylolisthesis. A total of 40 subjects who presented with L4 spondylolisthesis (16 males and 24 females; average age, 67.5 ± 10.3 years; age range, 46 - 81 years) comprised the DS group. Another 40 subjects matched with the DS group subjects for gender and age (18 males and 22 females; average age, 65.1 ± 11.6 years; age range, 42 - 83 years) who did not have lumbar spondylolisthesis, constituted the NS group. Studies were performed using a GE Signa HDx 1.5-T scanner with a spine coil (GE Healthcare, Milwaukee, WI, USA). T2-weighted sagittal cross-sectional images (TR: 4000 ms, TE: 102 ms, received band width (RBW): ±31.25 kHz, field of view (FOV): 24 cm, matrix: 384 ×288, slice thickness/gap: 4 mm/1 mm, number of excitations (NEX): 4, total scan time: 3 min, 4 s) of the lumbar vertebrae were obtained, and T2 values were measured using optimized 8-echo multi-spin echo sagittal crosssectional images of the midline lumbar vertebra (TR/first echo TE, last echo TE, 1000/14.8, 118.6, RBW: ±15.63 kHz, FOV: 22 cm, matrix: 320 ×256, slice thickness/gap: 4 mm/4 mm, 5 slices, NEX: 2, total scan time: 8 min, 34 s). T2 maps of the images were obtained using an Advantage Workstation (version 4.4, Functool, GE Healthcare), and T2 values of the L4/5 IVD were measured in midline sagittal images. In order to keep the influence of stimulated echoes to a minimum, the first echo of the multi-spin echoes was excluded. A T2 map was created to measure TE signal intensity (SI) for each pixel using the following formula:
Each IVD was divided into 5 equal areas. The front fifth was designated as the anterior AF, the middle fifth as the NP, and the last fifth as the posterior AF. A region of interest (ROI) was set to enclose the designated area and average T2 values were measured (Figure 1). The original second echo images (IVD 2nd TE: 29.6 ms) were used to create the T2 map when enclosing these areas in the ROI. The measurement level was at L4/5 for both the DS and NS groups (40 discs in each group). MedCalc (version 10.2.0.0, MedCalc Software, Mariakerke, Belgium) was used for analysis and comparisons. The Mann-Whitney U test was used to compare the groups, and p < 0.05 was considered statistically significant. Furthermore, in the DS group, the subjects were classified according to the Meyerding classification on plain lateral X-rays, and the relationship between T2 values and the degree of slip in the anterior AF, NP, and posterior AF was also investigated.
3. Results
Measurements of T2 values in IVDs (L4/5) in the DS and NS groups are shown in Figure 2. T2 values for the DS and NS groups were 54.6 ± 5.2 and 66.2 ± 10.3, respectively, for the anterior AF, 63.5 ± 7.3 and 66.2 ± 14.2, respectively, for NP, and 60.0 ± 4.5 and 64.6 ± 12.3, respectively, for the posterior AF. T2 values for IVDs tended to be lower in the DS group than in the NS group,
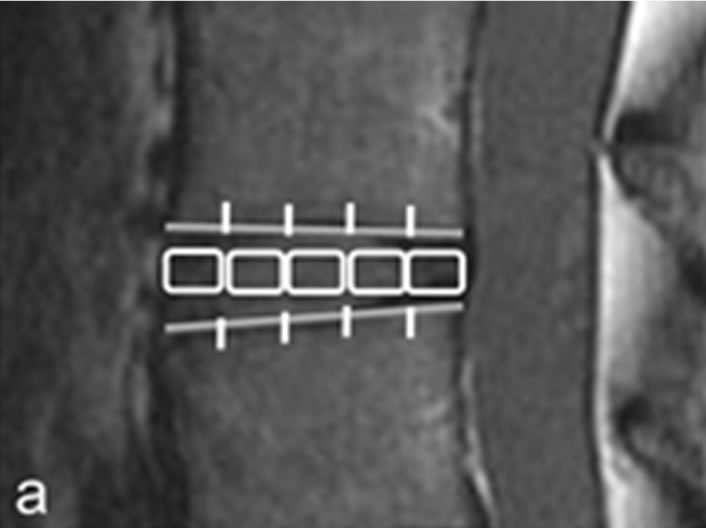
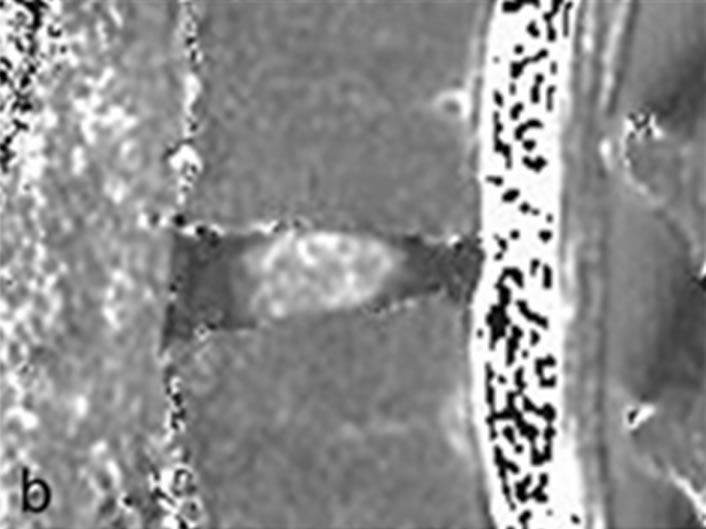
Figure 1. Measurement of intervertebral disc. (a) Second echo image on original image of T2 mapping. Disks were divided into 5 equal areas, designating the front fifth or the anterior annulus fibrosus, the middle fifth of the nucleus pulposus, and the last fifth of the posterior annulus fibrosus; (b) T2 mapping. In the same ROI as in (a), we measured the mean values.
and these values were significantly different (p < 0.01) within the anterior AF.
Subjects were classified according to the Meyerding classification in the DS group as follows: grade I (n = 26) and grade II (n = 14). In the current study, there were no cases of ≥grade III DS. T2 values of IVDs according to the Meyerding classification are shown in Figure 3. No significant differences in T2 values between grades I and II were observed in any areas of IVDs.
4. Discussion
IVDs are important for the function of the lumbar spinal column, and their degeneration is a cause of impaired function [12-14]. Furthermore, IVD degeneration precedes FJ degeneration, [12] but the causal relationship between lumbar DS and degeneration of IVDs is not well understood.
The present study compared the T2 values of IVDs in DS and NS groups. A significant decrease in T2 values of IVDs was observed in the DS group only in the anterior AF, which indicated increased progression of degeneration in the group. Meanwhile there were no significant changes in T2 values in either the posterior AF or NP. The T2 values of IVDs have been reported to be subject to daily fluctuations in water content. However, these fluctuations are small in degenerative discs [15,16]. Regardless, in this study, all MRI examinations were performed in the afternoon to minimize any effect of diurnal

Figure 2. T2 values of the intervertebral disc in DS and NS groups. Although T2 values were significantly different within the anterior annulus fibrosus, no significant differences of T2 values were NP and posterior annulus fibrosus.
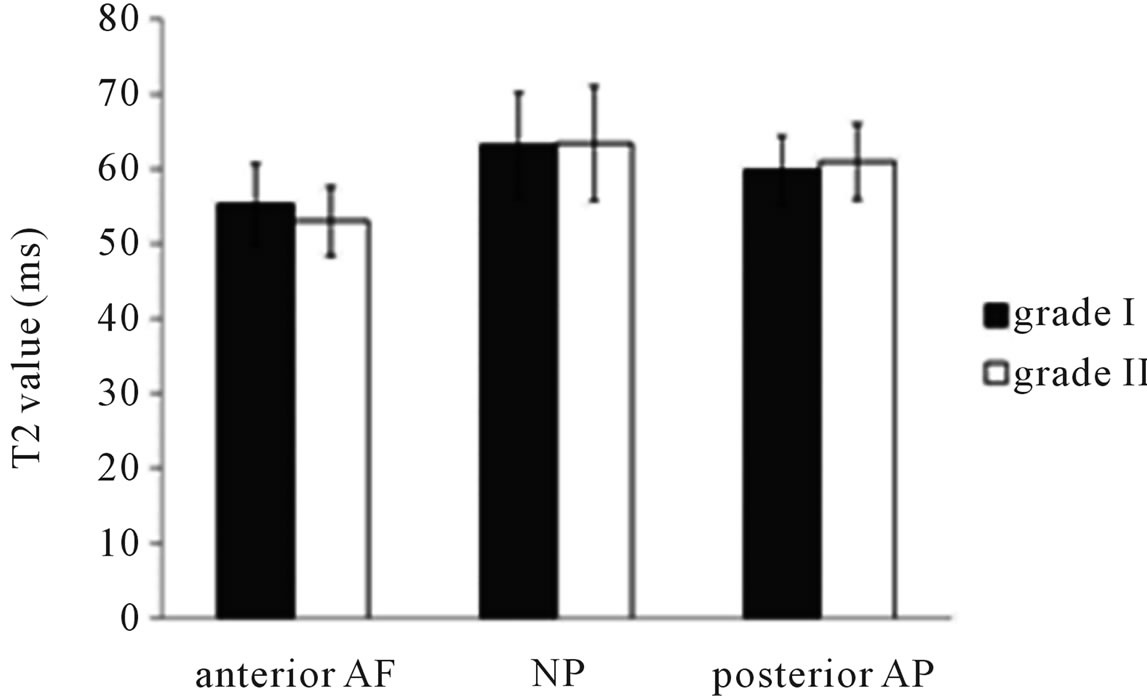
Figure 3. T2 value of intervertebral disc with Meyerding classification in DS group. Compared with grade I and II, demonstrated no significantly different in intervertebral disc.
variation in water content. Therefore, we consider that T2 values of IVDs measured in this study should provide reliable data.
Previous studies have reported that more sagittal alignment of FJs leads to anterior gliding because of a decreased resistance to anterior shear forces [17-19]. In this situation, more mechanical stress is loaded onto the anterior part of IVDs, which may lead to degeneration of the anterior AF. Collectively, it has been suggested that the degeneration of the anterior AF precedes or triggers lumbar DS. Thus it could be speculated that degeneration of other IVD components, including the posterior AF and NP, do not play a causative role in the development of lumbar DS.
Since signal strength in MRI is related to water and proteoglycan content, the degeneration of NP can be classified on the basis of visual evaluation. In addition, the Pfirrmann classification using T2-weighted images is a reliable evaluation system, and we have previously reported the validity of this classification [20]. On the other hand, it is difficult to visually evaluate AF with T2-weighted image. However, this strategy using T2 values enabled us to quantify the degeneration of AF, and we found that T2 values of AF may be a prognostic factor for lumbar DS.
In the current study, T2 values in the anterior AF did not significantly differ in Meyerding grades. It is speculated that in the early stages of lumbar spondylolisthesis, the degeneration of the anterior AF develops and is related to the onset. Meanwhile, Jayakumar et al. [7] reported that spondylolisthesis progresses when a locking mechanism formed by FJs has failed. It may allow the hypothesis that in lumbar spondylolisthesis, degeneration of FJs as well as IVDs influences the progression of spondylolisthesis. In order to verify these hypotheses, a prospective study of chronological changes in T2 values during the evolution of lumbar DS is needed. This will help to characterize the relationship between anterior AF degeneration and FJ degeneration in lumbar DS.
This study had some limitations. Firstly, realistic imaging times and signal-to-noise ratios make it difficult to improve spatial resolution using a 1.5-T device. Secondly, since IVD is a 3D-structure material, the investigation of IVD degeneration should rationally be analyzed with three-dimension as the whole IVD.
In summary, this study evaluated the extent of IVD degeneration and compared this with T2 values in DS and NS groups. T2 values decreased in the anterior AF of IVDs in the DS group. Further study is needed to elucidate how these changes relate to the development of lumbar DS.
REFERENCES
- C. W. Pfirrmann, A. Metzdorf, M. Zanetti, J. Hodler and N. Boos, “Magnetic Resonance Classification of Lumbar Intervertebral Disc Degeneration,” Spine, Vol. 26, No. 17, 2001, pp. 1873-1878.
- M. T. Modic, T. J. Masaryk, J. S. Ross and J. R. Carter, “Imaging of Degenerative Disk Disease,” Radiology, Vol. 168, No. 1, 1988, pp. 177-186.
- R. H. Pearce, J. P. Thompson, G. M. Bebault and B. Flak, “Magnetic Resonance Imaging Reflects the Chemical Changes of Aging Degeneration in the Human Intervertebral Disk,” Journal of Rheumatology Supplement, Vol. 27, 1991, pp. 42-43.
- T. J. Mosher and B. J. Dardzinski, “Cartilage MRI T2 Relaxation Time Mapping: Overview and Applications,” Seminars in Musculoskeletal Radiology, Vol. 8, No. 4, 2004, pp. 355-368. doi:10.1055/s-2004-861764
- A. Fujiwara, T. H. Lim, H. S. An, N. Tanaka, C. H. Jeon, G. B. Andersson and V. M. Haughton, “The Effect of Disc Degeneration and Facet Joint Osteoarthritis on the Segmental Flexibility of the Lumbar Spine,” Spine, Vol. 25, No. 23, 2000, pp. 3036-3044.
- C. Chaput, D. Padon, J. Rush, E. Lenehan and M. Rahm, “The Significance of Increased Fluid Signal on Magnetic Resonance Imaging in Lumbar Facets in Relationship to Degenerative Spondylolisthesis,” Spine, Vol. 32, No. 17, 2007, pp. 1883-1887.
- P. Jayakumar, C. Nnadi, A. Saifuddin, E. Macsweeney, and A. Casey, “Dynamic Degenerative Lumbar Spondylolisthesis: Diagnosis with Axial Loaded Magnetic Resonance Imaging,” Spine, Vol. 31, No. 10, 2006, pp. E298- E301.
- T. Nightingale, A. MacKay, R. H. Pearce, K. P. Whittall and B. Flak, “A Model of Unloaded Human Intervertebral Disk Based on NMR Relaxation,” Magnetic Resonance in Medicine, Vol. 43, No. 1, 2000, pp. 34-44. doi:10.1002/(SICI)1522-2594(200001)43:1<34::AID-MRM5>3.0.CO;2-7
- B. Ludescher, J. Effelsberg, P. Martirosian, G. Steidle, B. Markert, C. Claussen and F. Schick, “T2- and DiffusionMaps Reveal Diurnal Changes of Intervertebral Disc Composition: An in Vivo MRI Study at 1.5 Tesla,” Journal of Magnetic Resonance Imaging, Vol. 28, No. 1, 2008, pp. 252-257. doi:10.1002/jmri.21390
- G. Lyons, S. M. Eisenstein and M. B. Sweet, “Biochemical Changes in Intervertebral Disc Degeneration,” Biochimica et Biophysica Acta, Vol. 673, No. 4, 1981, pp. 443-453. doi:10.1016/0304-4165(81)90476-1
- N. L. Marinelli, V. M. Haughton, A. Munoz and P. A. Anderson, “T2 Relaxation Times of Intervertebral Disc Tissue Correlated with Water Content and Proteoglycan Content,” Spine, Vol. 34, No. 5, 2009, pp. 520-524.
- A. Fujiwara, K. Tamai, M. Yamato, H. S. An, H. Yoshida, K. Saotome and A. Kurihashi, “The Relationship between Facet Joint Osteoarthritis and Disc Degeneration of the Lumbar Spine: An MRI Study,” European Spine Journal, Vol. 8, No. 5, 1999, pp. 396-401. doi:10.1007/s005860050193
- W. H. Kirkaldy-Willis and H. F. Farfan, “Instability of the Lumbar Spine,” Clinical Orthopaedics & Related Research, Vol. 165, 1982, pp. 110-123.
- M. M. Panjabi, M. H. Krag and T. Q. Chung, “Effects of Disc Injury on Mechanical Behavior of the Human Spine,” Spine, Vol. 9, No. 7, 1984, pp. 707-713.
- N. Boos, A. Wallin, T. Gbedegbegnon, M. Aebi and C. Boesch, “Quantitative MR Imaging of Lumbar Intervertebral Disks and Vertebral Bodies: Influence of Diurnal Water Content Variations,” Radiology, Vol. 188, No. 2, 1993, pp. 351-354.
- N. Roberts, D. Hogg, G. H. Whitehouse and P. Dangerfield, “Quantitative Analysis of Diurnal Variation in Volume and Water Content of Lumbar Intervertebral Discs,” Clinical Anatomy, Vol. 11, No. 1, 1998, pp. 1-8. doi:10.1002/(SICI)1098-2353(1998)11:1<1::AID-CA1>3.0.CO;2-Z
- L. J. Grobler, P. A. Robertson, J. E. Novotny and J. W. Ahern, “Decompression for Degenerative Spondylolisthesis and Spinal Stenosis at L4-5. The Effects on Facet Joint Morphology,” Spine, Vol. 18, No. 11, 1993, pp. 1475-1482. doi:10.1097/00007632-199318110-00012
- M. Sharma, N. A. Langrana and J. Rodriguez, “Role of Ligaments and Facets in Lumbar Spinal Stability,” Spine, Vol. 20, No. 8, 1995, pp. 887-900. doi:10.1097/00007632-199504150-00003
- T. Toyone, T. Ozawa, K. Kamikawa, A. Watanabe, K. Matsuki, T. Yamashita and Y. Wada, “Facet Joint Orientation Difference between Cephalad and Caudad Portions: A Possible Cause of Degenerative Spondylolisthesis,” Spine, Vol. 34, No. 21, 2009, pp. 2259-2262. doi:10.1097/BRS.0b013e3181b20158
- H. Takashima, T. Takebayashi, M. Yoshimoto, Y. Terashima, H. Tsuda, K. Ida and T. Yamashita, “Correlation between T2 Relaxation Time and Intervertebral Disk Degeneration,” Skeletal Radiology, Vol. 41, No. 2, 2012, pp. 163-167. doi:10.1007/s00256-011-1144-0