Journal of Materials Science and Chemical Engineering
Vol.03 No.12(2015), Article ID:62352,14 pages
10.4236/msce.2015.312014
Carbonization of Chlorinated Organic Residual Liquid for Energy Source Generation
Yongquan Ge1, Wenqi Zhang1*, Gang Xue2, Jiachang Zhao1
1College of Chemistry and Chemical Engineering, Shanghai University of Engineering Science, Shanghai, China
2College of Environmental Science and Engineering, Donghua University, Shanghai, China

Copyright © 2015 by authors and Scientific Research Publishing Inc.
This work is licensed under the Creative Commons Attribution International License (CC BY).
http://creativecommons.org/licenses/by/4.0/


Received 30 November 2015; accepted 26 December 2015; published 29 December 2015
ABSTRACT
Chlorinated organic residual liquid is produced from the distillation process of new refrigerants production. It is difficult to be treated by traditional water treatment process and incineration process. In this study, a carbonization process at atmospheric pressure was used to convert this residual liquid to carbonaceous product and organic gas in 2 h at 230˚C or 260˚C. The carbonaceous product was characterized by scanning electron microscope, Fourier-transform infrared spectrometer and thermo gravimetric analysis. The element composition and the high heat value of these products were similar to anthracite and lignite, respectively, showing that they could be used as alternative fuels. The components of organic gas were analyzed using gas chromatography-mass spectrometry and the gas had potential for incineration.
Keywords:
Organic Residual Liquid, Chlorinated Organics, Carbonization, Incineration, Alternative Fuel

1. Introduction
Montreal Protocol on the ozone-depleting substances has great effects on the refrigerant substitution process [1] . However, chlorinated organic residual liquid is produced from the distillation process of new refrigerant production. With complicated organic matter composition, deep brown color and pungent odor, this residual liquid consists entirely of organics and contains no water. The disposal of the residual liquid has become a bottleneck of new refrigerant development.
Low concentration chlorinated organic compounds in water environment can be degraded by microorganism [2] [3] , oxidation [4] and reduction [5] - [7] process. And high concentration organic residual liquid is often treated by incineration process [8] [9] . However, the practice of a fluorine chemical industry company showed that incineration process was impeded by the agglomeration of this residual liquid on the spray nozzle. The residual liquid may be burning by other incineration methods, for example, rotary kiln technology [10] . But the incineration also causes problems of high cost, serious secondary pollution and waste of resources.
Hydrothermal carbonization (HTC) is a thermochemical process converting organic feedstock into carbonaceous product under moderate temperatures (180˚C - 350˚C) and autogenous pressures in the presence of water [11] - [13] . For the chlorinated organic residual liquid, HTC process has several disadvantages, including high reaction pressure (4 MPa), large dosage of additives and long reaction time (12 h). In addition, it is found that some volatile compounds in raw residual liquid and the intermediate product are difficult to be carbonized in the closed experimental system of HTC process, and these volatile compounds may even affect the reaction proceeds [12] .
In this study, a carbonization process at atmospheric pressure was used to treat this residual liquid to recovery carbonaceous product in short time without additives. The carbonaceous product was evaluated as an alternative fuel. The released gas was collected for incineration.
2. Experimental
2.1. Experimental Materials
The residual liquid was obtained from Juhua Group Corporation in Zhejiang, China. All chemicals applied in the framework of this contribution were reagent or analytical grade, and were purchased from Sinopharm Chemical Reagent Co., Ltd. (China). The reactor is Micro intelligent high pressure reaction kettle YZPR-100 purchased from Shanghai Yanzheng Experiment Instrument Co., Ltd. (China).
2.2. Experimental Method
Figure 1 shows the schematic diagram of experimental set-up. The reactor is made of stainless steel. The lined has a 45 mm internal diameter and 85 mm height (Volume is 100 ml.) and is made of Teflon. The reactor is heated by electricity and the temperature is controlled by a temperature control system. The system pressure is monitored by a pressure gauge. Gas absorption device consists of two conical flasks and the absorbing liquid is ethyl acetate.
In each batch experiment, 22.5 g (15 mL) of residual liquid was put into the reactor. The reactor was heated to the desired reaction temperature (230˚C or 260˚C) with a heating rate of 10˚C/min. The reaction temperature was maintained until there was no gas to release and reaction time (about 2 h) was recorded. Afterward, the reactor was cooled to room temperature and then the carbonaceous product was obtained. The products at 230 and 260˚C were marked as S230 and S260, respectively. The released gas was absorbed and its organic components were analyzed using gas chromatography-mass spectrometry (GC-MS).
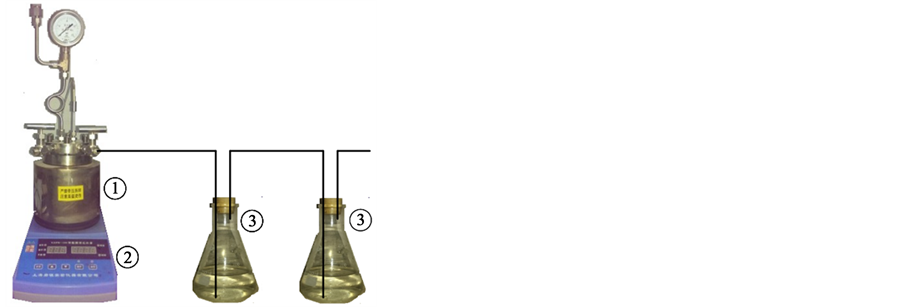
Figure 1. Schematic diagram of experimental set-up. 1―reactor; 2― temperature control system; 3―gas absorbing device.
The yield of product was calculated using the following equation.

2.3. Characterization Methods
Surface morphology was examined by scanning electron microscope (SEM) (HITACHI S-3400, Japan). Surface functional groups were analyzed by Fourier-transform infrared spectrometer (FTIR) (Nicolet AVATAR 370, USA). The elemental composition was determined using elemental analyzer (vario EL cube III, Germany). Test methods for moisture, ash, volatile matter (VM) and fixed carbon (FC) were based on proximate analysis of coal (GB212-91, China). Thermogravimetric analysis (TGA) was carried out by thermogravimetric analyzer (STA PT-1000, Germany). The organic components of the residual liquid and gas were analyzed using GC-MS (SHIMADZU QP-2010, Japan).
3. Results and Discussion
3.1. Characteristics of the Carbonaceous Products
3.1.1. Carbonaceous Product Yield
The carbonaceous product yields of S230 and S260 were 31.93 and 14.04 wt%, respectively, showing that high temperature led to a significant reduction in carbonaceous product yield. The yield decreases as the temperature rises. Presumably, more amount of gas may release at higher temperatures.
3.1.2. SEM
Figure 2 shows the surface morphologies of the carbonaceous products with different carbonization temperatures. It was seen in Figure 2 that the morphology of the two samples were dense massive structure without poresor pathways. However, some parts of S230 exhibited fibrous and flaky structures and these structures disappeared at higher temperature as showed in the image of S260. Some lines were found on the surface of the two samples and implied that the carbonaceous product formed layer by layer.
In the traditional HTC process, the structure of hydrochar was related to the water-solubility of feedstock. For water-soluble feedstock, hydrochar tends to be spherical particles, such as cellulose [14] . For water-insoluble feedstock, hydrochar tends to keep the original structure, such as lignin [15] . The residual liquid was water-in- soluble, which caused that the carbonaceous product tended to form blocks.
3.1.3. FTIR Spectra
Various functional groups of the resulting carbonaceous products were characterized by FTIR. Figure 3 shows
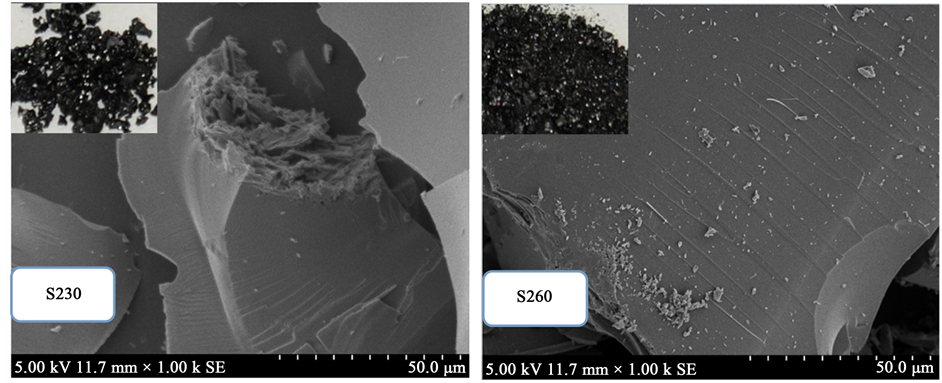
Figure 2. Photograph and SEM images of S230 and S260.
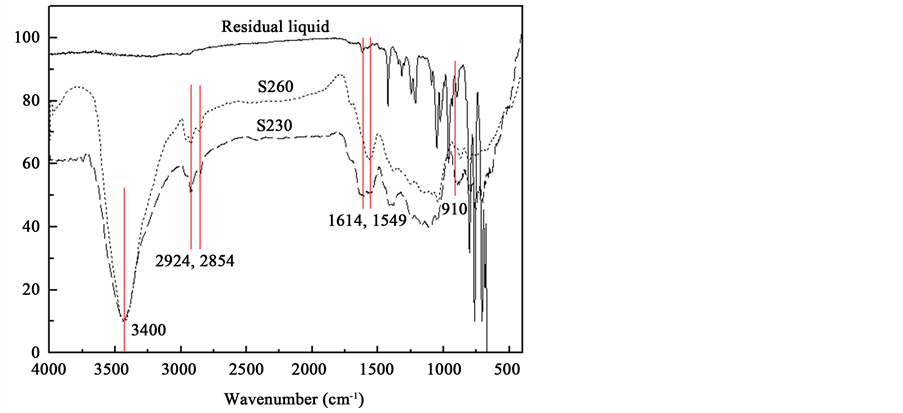
Figure 3. FTIR spectra of the residual liquid, S230 and S260.
the FTIR spectra of the raw residual liquid, S230 and S260. Compared to the raw residual liquid, the carbonaceous products exhibited significant different absorption bands.
The band at 3400 cm−1 was attributed to -OH stretching vibration in hydroxyl groups. The band at 1614 cm−1 implied the stretching vibration of -C=O in ketone and amide groups [16] . This is probably related to the introduction of oxygen functional groups in the carbonization process. Small amount of air in the reactor may participate in oxidation. Another important reason is that carbon atoms at the defect sites of carbon materials are highly active. After annealing and decomposition at high temperature to lose their covalent bonds, they rapidly capture oxygen from air environment under room temperature to form various types of oxygen groups [17] . Asymmetric and symmetric -C-H stretching of methylene groups were identified at 2956 cm−1 and 2844 cm−1 [18] , respectively. The peak at 1549 cm−1 was assigned to the -C=C stretching in aromatic ring carbons and it increased after the carbonization. In addition, the increase peak of S230 and S260 at 910 cm−1 was attributed to the out-of-plane bending vibration in aromatic nucleus -CH structure, which suggested that more aromatic compounds generated during the carbonization.
3.1.4. Ultimate Analysis
The ultimate analysis of the residual liquid, S230 and S260 are listed in Table 1. By comparing the residual liquid, C content of S230 and S260 increased from 22.05 to 49.93 and 60.42 wt%, respectively, showing that C was enriched in the carbonization process. Cl content of S230 and S260 decreased from 75.44 to 43.03 and 33.00 wt%, respectively, suggesting the dechlorination in the carbonization process. C content of S260 was higher than that of S230 and Cl content of S260 was lower than that of S230, showing that S260 was better than S230 as fuel. O content of S230 and S260 increased from 0.00 to 5.17 and 4.51 wt%, respectively, proving that oxygen functional groups were formed [17] .
Figure 4 indicates the classification of the carbonaceous product as a solid fuel based upon Van Krevelen diagram [19] . For comparison, H/C vs. O/C atomic ratios of the residual liquid, anthracite, bituminous, lignite, and peat were also plotted in the Van Krevelen diagram. S230 and S260 were approaching the region of anthracite and bituminous respectively, implying that their element compositions were similar to anthracite and bituminous, respectively.
3.1.5. Proximate Analyses
Table 2 presents the proximate analyses and the high heat values (HHV) of S230 and S260. The fuel ratio (FC/VM) ranks carbonaceous product as an alternative fuel. Channiwala and Parikh [20] have developed a unified correlation to predict HHV of solid fuel expressed by elemental composition:

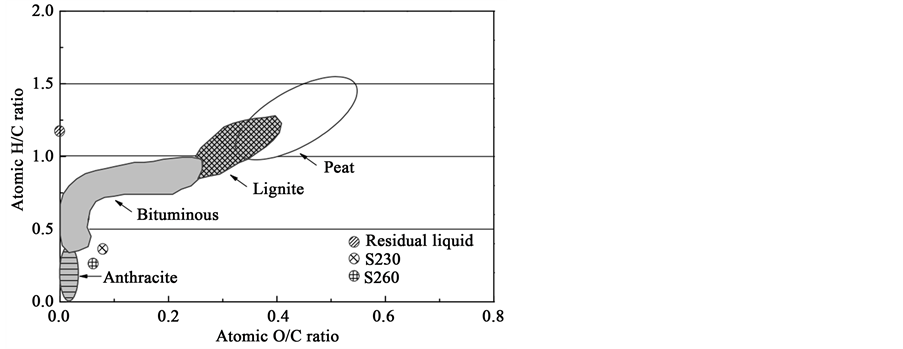
Figure 4. Van Krevelen diagram for the residual liquid, S230 and S260.

Table 1. Ultimate analysis of the residual liquid, S230 and S260.
Table 2. Proximate analyses and combustion heat of S230 and S260.
where C, H, S, O, N and A represent the mass percentages on dry basis of carbon, hydrogen, sulfur, oxygen, nitrogen and ash contents of fuels, respectively.
Moistures of S230 and S260 were low, because they were obtained from an open system at high temperature. FC/VM and HHV of S260 was higher, which revealed that S260 had a better rank as an alternative fuel. However, Ash of S260 was higher due to the release of more volatile components of the raw residual liquid at higher temperature.
3.1.6. Combustion Behavior Analysis
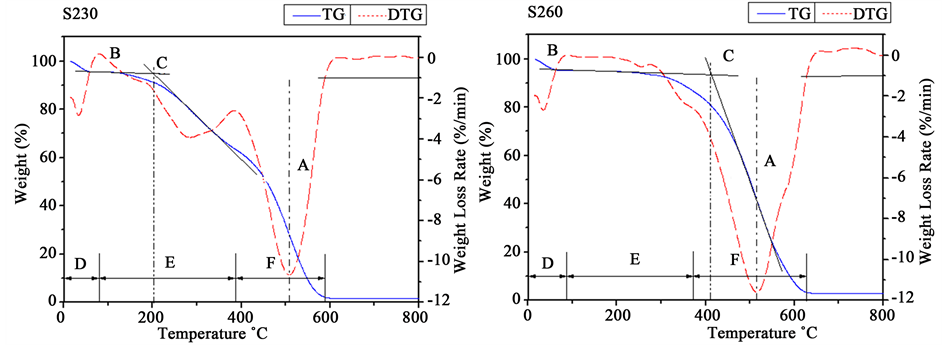
Figure 5 illustrates the combustion profiles of the carbonaceous products. For a better evaluation of the different combustion behaviors, the entire combustion profile was divided into several stages according to the rate of weight loss in the DTG curve [21] . Table 3 lists the combustion stages, characteristic temperatures and residue of the carbonaceous product.
As shown in Figure 5, the weight loss of S230 and S260were in the temperature range of 79˚C - 587˚C and 87˚C - 628˚C, respectively. A peak was exhibited in Stage due to lose of moisture content.
Stage E of S230 and S260 were in the temperature range of 79˚C - 385˚C and 87˚C - 371˚C, respectively.
 (a) (b)
Figure 5. TG-DTG curves for combustion profiles of S230 (a) and S260 (b). Notes, temperature range, 20˚C - 800˚C; heating rate, 20˚C/min; air flow rate, 20 mL/min; an atmospheric pressure.
Table 3. Combustion stages, characteristic temperatures and residue of the carbonaceous products.
Notes: Stage D―Dehydration process, Stage E―Devolatilization and combustion phase, Stage F―Char combustion phase, Last stage―Burnout phase, Ti―Ignition temperature, Tm―Maximum combustion rate temperature, Tb―Burn out temperature (Tb).
S230 had a distinct peak, which was due to the loss of high VM of S230. But S260 did not have the stage F of S230 and S260 products took place in the temperature range of 385˚C - 588˚C and 371˚C - 628˚C for the further release of VM and char combustion, respectively [22] [23] .
In Table 3, Ti refers to the temperature at which fuels begin to burn. Ti is a critical parameter to minimize fire and explosion as solid fuel [22] . Tm corresponds to DTG peak temperature. Tb refers to the temperature at which the rate of weight loss diminishes to 1 wt%/min at the end of the combustion profile.
Ti of S260 had a great increase of 211˚C, which implied more difficulty for ignition. This can be explained by the decrease of VM [23] . Tm of S230 and S260 were similar. Therefore, they needed similar reaction time to achieve the maximum decomposition rate. Especially, Tb of S260 was increased by almost 41˚C, which implies that it had a higher HHV and needed longer reaction time to achieve the complete combustion.
3.2. Released Gas Composition
The organic components of the residual liquid, gases releasing at the temperature of 230˚C and 260˚C were analyzed by GC-MS, as shown in Table 4.
The residual liquid consisted of 3,3,6,6,9,9,12,12-octachloropentacyclo[9.1.0.0(2,4).0(5,7).0(8,10)] dodecane, endosulfan II, 1,1,2,3,3-pentachloro-propane, 1,2,3,3-tetrachloro-1-propene and 1,1,1,2,2,3,3,3-octachloropro- pane. Endosulfan II was not detected at 230˚C but it was detected at 260˚C, implying that they began to evaporate at 260˚C. 1,1,2,3,3-Pentachloro-propane was not detected at 230˚C and 260˚C, showing that it did not evaporate at 230 and 260˚C. At 230˚C, the components of the released gas not only came from organics in residual liquid, but also the newly generated products. For example, carbon tetrachloride, 1-chlorobutane and methyl- 3-(dichloromethyl)-4,4-dichloro-2-butenoate generated in the dechlorination process. At 260˚C, more new products generated, for example, dicyclopenta-2,4-dienyl-german (II), 1,1,4-trichloro-1,2-butadiene and trichloromethane. Some components were detected at 230˚C but they were not detected at 260˚C, for example, 1- chlorobutane, 2,4,6-trichlorobenzonitrile and 9-chloro-bicyclo[6.1.0]nona-1(8),2,4,6-tetraene, showing that their
Table 4. The organic components of the residual liquid, gases releasing at the temperature of 230˚C and 260˚C.
n.d.: not detectable (below detection limit).
further reaction occurred at the high temperature. These releasing released gases had potential for incineration without the agglomeration on the spray nozzle.
4. Conclusion
The residual liquid was effectively converted to carbonaceous products. The carbonaceous products could be used as an alternative fuel. The element compositions of S230 and S260 were similar to those of anthracite and bitumen, respectively. Different reaction temperatures had an obvious effect on the yield and quality of carbonaceous products. At 260˚C, the carbonaceous product yield was low, but its HHV was high. The released gas could be incinerated without the agglomeration.
Acknowledgements
This study was financially supported by China State Construction Innovation Project (CSCEC-2012-Z-14), Shanghai Education Research and Innovation Project (No: 11ZZ176, 12YZ153) and Shanghai University of Engineering Science Innovation Fund for Graduate Students (No: E1-0903-14-01113).
Cite this paper
YongquanGe,WenqiZhang,GangXue,JiachangZhao, (2015) Carbonization of Chlorinated Organic Residual Liquid for Energy Source Generation. Journal of Materials Science and Chemical Engineering,03,95-108. doi: 10.4236/msce.2015.312014
References
- 1. Hashemi, H., Babaee, S., Mohammadi, A.H., Naidoo, P. and Ramjugernath, D. (2015) Clathrate Hydrate Dissociation Conditions of Refrigerants R404A, R406A, R408A and R427A: Experimental Measurements and Thermodynamic Modeling. The Journal of Chemical Thermodynamics, 90, 193-198.
http://dx.doi.org/10.1016/j.jct.2015.06.035 - 2. Mattes, T.E., Alexander, A.K. and Coleman, N.V. (2010) Aerobic Biodegradation of the Chloroethenes: Pathways, Enzymes, Ecology, and Evolution. FEMS Microbiology Reviews, 34, 445-475.
http://dx.doi.org/10.1111/j.1574-6976.2010.00210.x - 3. Maymó-Gatell, X., Nijenhuis, I. and Zinder, S.H. (2011) Reductive Dechlorination of Cis-1,2-dichloroethene and Vinyl Chloride by “Dehalococcoides Ethenogenes”. Environmental Science & Technology, 35, 516-521.
http://dx.doi.org/10.1021/es001285i - 4. Djebbar, K., Zertal, A. and Sehili, T. (2006) Photocatalytic Degradation of 2,4-Dichlorophenoxyactic Acid and 4-Chloro-2-methylphenoxyacetic Acid in Water by Using TiO2. Environmental Technology, 27, 1191-1197.
http://dx.doi.org/10.1080/09593332708618732 - 5. Arnold, W.A., Winget, P. and Cramer, C.J. (2002) Reductive Dechlorination of 1,1,2,2-Tetrachloroethane. Environmental Science & Technology, 36, 3536-3541.
http://dx.doi.org/10.1021/es025655+ - 6. Su, C. and Puls, R. (1999) Kinetics of Trichloroethene Reduction by Zerovalent Iron and Tin: Pretreatment Effect, Apparent Activation Energy, and Intermediate Products. Environmental Science & Technology, 33, 163-168.
http://dx.doi.org/10.1021/es980481a - 7. Lowry, G.V. and Reinhard, M. (1999) Hydrodehalogenation of 1- to 3-Carbon Halogenated Organic Compounds in Water Using a Palladium Catalyst and Hydrogen Gas. Environmental Science & Technology, 33, 1905-1910.
http://dx.doi.org/10.1021/es980963m - 8. Sevon, D.W. and Cooper, D.J. (1991) Modeling Combustion Efficiency in a Circulating Fluid Bed Liquid Incinerator. Chemical Engineering Science, 46, 2983-2996.
http://dx.doi.org/10.1016/0009-2509(91)85003-G - 9. Swithenbank, J., Basire, S., Wong, W.Y., et al. (1999) Sludge Incineration in a Spinning Fluidized Bed Incinerator. Proceedings of the 15th International FBC Conference, Savannah, 16-19 May 1999.
- 10. Bujak, J. (2015) Thermal Treatment of Medical Waste in a Rotary Kiln. Journal of Environmental Management, 162, 139-147.
http://dx.doi.org/10.1016/j.jenvman.2015.07.048 - 11. Mumme, J., Eckervogt, L., Pielert, J., et al. (2011) Hydrothermal Carbonization of Anaerobically Digested Maize Silage. Bioresource Technology, 102, 9255-9260.
http://dx.doi.org/10.1016/j.biortech.2011.06.099 - 12. Funke, A. and Ziegler, F. (2010) Hydrothermal Carbonization of Biomass: A Summary and Discussion of Chemical Mechanisms for Process Engineering. Biofuels, Bioproducts & Biorefining, 4, 160-177.
http://dx.doi.org/10.1002/bbb.198 - 13. Libra, J.A., Ro, K.S., Kammann, C., et al. (2010) Hydrothermal Carbonization of Biomass Residuals: A Comparative Review of the Chemistry, Processes and Applications of Wet and Dry Pyrolysis. Biofuels, 2, 71-106.
http://dx.doi.org/10.4155/bfs.10.81 - 14. Dinjus, E., Kruse, A. and Troger, N. (2011) Hydrothermal Carbonization-1. Influence of Lignin in Lignocelluloses. Chemical Engineering & Technology, 34, 2037-2043.
http://dx.doi.org/10.1002/ceat.201100487 - 15. Titirici, M.M., Thomas, A., Yu, S.H., Muller, J.O. and Antonietti, M. (2007) A Direct Synthesis of Mesoporous Carbons with Bicontinuous Pore Morphology from Crude Plant Material by Hydrothermal Carbonization. Chemistry of Materials, 19, 4205-4212.
http://dx.doi.org/10.1021/cm0707408 - 16. Li, M., Li, W. and Liu, S.X. (2011) Hydrothermal Synthesis, Characterization, and KOH Activation of Carbon Spheres from Glucose. Carbohydrate Research, 346, 999-1004.
http://dx.doi.org/10.1016/j.carres.2011.03.020 - 17. Li, X.B., Biswas, S. and Drzal, L.T. (2013) High Temperature Vacuum Annealing and Hydrogenation Modification of Exfoliated Graphite Nanoplatelets. Journal of Engineering, 2013, 1-10.
http://dx.doi.org/10.1155/2013/638576 - 18. Silva, J.D.O., Filho, G.R., Meireles, C.D.S., et al. (2012) Thermal Analysis and FTIR Studies of Sewage Sludge Produced in Treatment Plants. The Case of Sludge in the City of Uberlandia-MG, Brazil. Thermochimica Acta, 528, 72-75.
http://dx.doi.org/10.1016/j.tca.2011.11.010 - 19. Van Krevelen, D.W. (1993) Coal. 3rd Edition, Elsevier Science Publishers, Amsterdam.
- 20. Channiwala, S.A. and Parikh, P.P. (2002) A Unified Correlation for Estimating HHV of Solid, Liquid and Gaseous Fuels. Fuel, 81, 1051-1063.
- 21. He, C., Giannis, A. and Wang, J.Y. (2013) Conversion of Sewage Sludge to Clean Solid Fuel Using Hydrothermal Carbonization: Hydrochar Fuel Characteristics and Combustion Behavior. Applied Energy, 111, 257-266.
http://dx.doi.org/10.1016/j.apenergy.2013.04.084 - 22. Xu, M. and Sheng, C. (2011) Influences of the Heat-Treatment Temperature and Inorganic Matter on Combustion Characteristics of Cornstalk Biochars. Energy & Fuels, 26, 209-218.
http://dx.doi.org/10.1021/ef2011657 - 23. Biagini, E. and Tognotti, L. (2006) Comparison of Devolatilization/Char Oxidation and Direct Oxidation of Solid Fuels at Low Heating Rate. Energy & Fuels, 20, 986-992.
http://dx.doi.org/10.1021/ef0503156
NOTES

*Corresponding author.