Computational Chemistry
Vol.05 No.01(2017), Article ID:73616,13 pages
10.4236/cc.2017.51004
Quantum Chemistry Prediction of Molecular Lipophilicity Using Semi-Empirical AM1 and Ab Initio HF/6-311++G Levels
Ouanlo Ouattara, Nahossé Ziao*
Laboratoire de Thermodynamique et de Physico-Chimie du Milieu, UFR SFA, Université NanguiAbrogoua, Abidjan, Côte d’Ivoire

Copyright © 2017 by authors and Scientific Research Publishing Inc.
This work is licensed under the Creative Commons Attribution International License (CC BY 4.0).
http://creativecommons.org/licenses/by/4.0/


Received: September 19, 2016; Accepted: January 15, 2017; Published: January 19, 2017
ABSTRACT
Reliable prediction of lipophilicity in organic compounds involves molecular descriptors determination. In this work, the lipophilicity of a set of twenty-three molecules has been determined using up to eleven quantum various descriptors calculated by means of quantum chemistry methods. According to Quantitative Structure Property Relationship (QSPR) methods, a first set of fourteen molecules was used as training set whereas a second set of nine molecules was used as test set. Calculations made at AM1 and HF/6-311++G theories levels have led to establish a QSPR relation able to predict molecular lipophilicity with over 95% confidence.
Keywords:
Molecular Lipophilicity, Molecular Descriptors, Quantum Chemistry, Statistical Analysis

1. Introduction
The informations contained in molecular structure can be accessed and described by the mean of various physicochemical quantities named descriptors. For decades, many studies have been conducted to determine empirically or compute these descriptors and it is well known that they actually can describe molecular structures [1] [2] [3] . In quantum chemistry, the computed descriptors, obviously, will be favoured. The aim of our work is to determine the molecular descriptors that can reliably predict the molecular lipophilicity by quantum chemistry methods. The suitable descriptors will be selected from an initial set of eleven, only taking into account the ones who are highly correlated with the molecular lipophilicity while being independent one from each other, in pairs. The whole process will lead to establish and validate by statistical methods, a performant QSPR model.
2. Computational Details
2.1. Training and Test Sets Molecules
Both training and test sets are constituted from a sample of twenty-three aromatic compounds with known experimental values [4] of molecular lipophilicity expressed as logPexp, where Pexp is the experimental value of octanol-water partition’s coefficient. The training set corresponds to fourteen molecules and test set, nine molecules (Table 1). All molecules are codified CAi, the i running from 1 to 23.
2.2. Computational Theories Levels and Softwares
All molecules have been fully optimized using GAUSSIAN 03 [5] software at semi-em- pirical AM1 method and ab initio HF/6-311++G method. The basis set 6-311++G is sufficient, especially, the use of both polarization and diffuse functions is not necessary since we are not in a case of intermolecular study. Two other softwares have been used, according their specificities, to do statistical analysing of the results and to plot graphics, i.e. XLSTAT [6] and EXCEL [7] .
2.3. Statistical Analysing
QSPR study needs a statistic analysis all along the validation process. In this work, we used the multiple linear regression analysis method [8] [9] , corresponding to the below general equation:

 : Property studied;
 : explanatory variables (descriptors) of the studied property;
 : model regression coefficients. Excel software directly provides these linear regression equations with the regression analysis tool. The final choice of predictive descriptors is based on two fundamental criteria for selecting descriptors set, according Vessereau [10] . The first criterion requires that there must be a linear dependency between the property studied and the descriptors. For each descriptor, one must have
  where R is the linear correlation coefficient. The second criterion indicates that the descriptors must be independent each from other, so we must have
  where
where  is the partial correlation coefficient between descriptors i and j. XLSTAT software directly provides these coefficients. In the case of simple linear regression [11] , expressions of R and
  are:
are:

The determination coefficient  [12] is given by the following equation:

TSS: Total Sum of Squares; ESS: Extended Sum of Squares; RSS: Residual Sum of Squares. A linear regression equation significancy is drawn from Fisher’s coefficient (F) [13] . The higher this coefficient is, the better the linear regression equation is.


Table 1. Training setand test set samples molecules and theirli pophilicities.
n: number of molecules; p: number of explanatory variables.
The predicting power of a model can be obtained from five Tropsha’s criteria [14] [15] . If at least three of the criteria are satisfied, then the model will be considered efficient in predicting the property studied. These criteria are:
Criterion 1: ; Criterion 2:
 ; Criterion 3:
  and
and

Criterion 4:  and
and ; Criterion 5:
2.4. Molecular Descriptors Selection
There are thousands of molecular descriptors from the literature and quantum chemical calculations. For our study, we considered eleven quantum descriptors (Table 2).
Table 3 and Table 4 give the values of the quantum descriptors at AM1 and HF/ 6-311++G levels respectively. These values were used to calculate correlation linear coefficient R, the partial coefficient correlation  and to establish regression models.
According to Table 5, the rejected descriptors have a correlation coefficient value less than 0.50 and those selected have a coefficient greater than 0.50. We hold the following results. At semi-empirical level, AM1, the selected descriptors are  and
and . At ab initio level HF/6-311++G, the selected descriptors are
 and
and . The last step is to verify the criterion 2 (Table 6 and Table 7). According to Table 6, the descriptors
  and
and  are dependent. This leads us to consider two groups of descriptors at AM1 level. In the group 1, the selected de-
Table 2. List of eleven quantum descriptors.
Table 3. Values of the training set quantum descriptors at AM1 level.
Table 4. Values of the test set quantum descriptors at HF/6-311++G level.
scriptors are Energy of the HOMO ( ), Basicity by hydrogen bonding (
 ) and Sum of absolutes values of net electrical charges of Mulliken (
 ). For the group 2, the selected descriptors are Basicity by hydrogen bonding (
 ), Chemical electronegativity (
 ) and Sum of absolutes values of net electrical charges of Mulliken (
 ).
).
According to Table 7, the descriptors  and
and  are dependent. This leads us to consider two groups of descriptors for the level calculation HF/6-311++G. So, we can
Table 5. Selection of quantum descriptors according criterion 1 [10] at AM1 and HF/6-311++G levels.
Table 6. Selection of quantum descriptors according criterion 2 [10] at AM1 level.
settled two groups. For the first group 3, descriptors selected are Energy of the HOMO ( ), Basicity by hydrogen bonding (
 ), Chemical hardness (
 ), Chemical softness (
 ), Smallest negative charge of the molecule (
 ), Sum of absolutes values of net electrical charges of Mulliken (
 ). For the last group 4, the selected descriptors are Basicity by hydrogen bonding (
 ), Chemical electronegativity (
 ), Chemical hardness (
 ), Chemical softness (
 ), Smallest negative charge of the molecule (
 ) and Sum of absolutes values of net electrical charges of Mulliken (
 ).
).
3. Results and Discussion
3.1. Prediction of Lipophilicity at Semi-Empirical Level AM1 (Model 1)
Figure 1 shows that the group 2 quantum descriptors retained are linearly dependent on molecular lipophilicity. The actual plot on Figure 1 is . Indeed, there are several descriptors corresponding to a single value of
 , and it has
Table 7. Selection of quantum descriptors according criterion 2 at HF/6-311++G level.

Figure 1. Graphs  at semi-empirical AM1 level.
been impossible with the software Excel to plot on a same graph .
.
The quantum descriptors of group 2 were used for the establishment of Model 1 because they give a more significant regression equation in the sense of Fisher than group 1.
Model 1:


According to the statistical t_test, the importance of quantum descriptors in Model 1 is in the following descending order: . In Table 8 are various statistical parameters for Model 1 validation. Table 8 shows that the Model 1 has a very high predictive capability, since up to 95.60%, of the test molecules have their game lipophilicities predicted. This means that Model 1 can be used to reliably predict the aromatic compounds unavailable lipophilicities.
Verification of Tropsha criteria for Model 1.
1) ; 2)
; 2) ; 3)
; 3) 
4) ; 5)
; 5)  and
and 
All values satisfy Tropsha’s criteria. Model 1 is retained as predictive model of molecular lipophilicity. Statistical parameters are gathered in Table 8.
3.2. Prediction of Lipophilicity at Ab Initio Level HF/6-311++G (Model 2)
Figure 2 shows that there is indeed a linear dependence between the quantum descriptors of group 4 and the molecular lipophilicity. The quantum descriptors of group 4 were used for the establishment of Model 2 as they give a more significant regression equation in the sense of Fisher than group 3.
Model 2:


According to the statistical t_test, the importance of quantum descriptors in Model 2 is in the following descending order: . Table 9 shows the various statistical parameters for validating the Model 2. Table 9 shows that the Model 2 has a low predictive ability (
 ), since only 59.71%, of the test molecules have their game lipophilicities predicted. This means that the Model 2 cannot be used to reliably
Table 8. Statistical parameters of the Model 1 (Semi-empirical level AM1).
predict the aromatic compounds unavailable lipophilicities.
Verification of Tropshacriteria for Model 2.
1) ; 2)
; 2) ; 3)
; 3) 
4) ; 5)
; 5)  and
and 
All Tropsha criteria, excepted criterion 4, are not satisfied. Model 2 established at HF/6-311++G level is validated, since , but is not efficient in predicting the lipophilicity. He is dismissed as a model for lipophilicity prediction. This unsuitable prediction of lipophilicity is certainly due to the use of an extended basic function, taking into account the diffuse functions on all atoms. The use of diffuse functions seems unefficient when calculating lipophilicity. Statistical parameters are gathered in Table 9.

Figure 2. Graphs  at ab initio HF/6-311++G level.
Table 9. Statistical parameters of the Model 2 (ab initio level HF/6-311++G).
3.3. Correlation between the Predicted and Experimental Values of Lipophilicity
Figure 3 and Figure 4 represent the following graphs  depending
  for internal validation (LOO) and external of our models.

Figure 3. Graph  of Model 1.
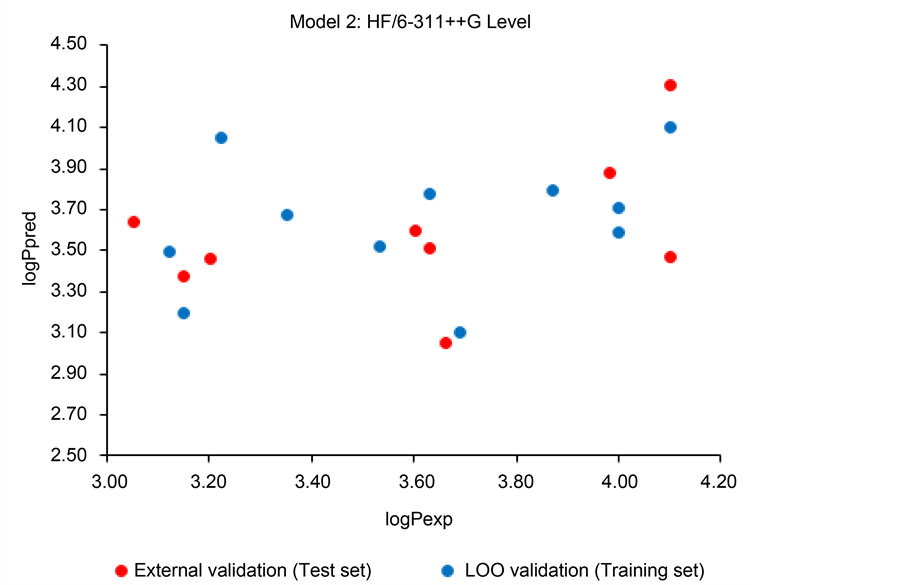
Figure 4. Graph  of Model 2.
Figure 3 shows that there is, indeed, a strong correlation between the predicted and the experimental lipophilicity according Model 1. The contrary is observed at Figure 4, for Model 2. In the latter case, it can be seen a large dispersion of the points cloud and no linear plot could be obtained. Here is the confirmation that Model 1 is highly performant, but not Model 2.
4. Conclusion
QSPR methodology and quantum chemical methods were used to establish predictive models of molecular lipophilicity. In this work, we identified four groups of quantum descriptors according to the basic criteria usually used for descriptors selection. The results showed that many descriptors strongly correlate lipophilicity. From these descriptors, we have established two lipophilicity prediction models. The statistical analysis led us to select only the semi-empirical (AM1) based model. On the other hand, ab initio (HF/6-311++G) based model was rejected because of its low predictive power. Furthermore, the main descriptors that strongly influence the lipophilicity are, from of the selected model, the Basicity by hydrogen bonding ( ), Chemical electonegativity (
 ) and the Sum of absolutes values of net electrical charges of Mulliken (
 ). The ab initio based model unefficiency could be due to the use of high theory level, and tends to indicate that high theory levels, and specifically diffuse functions addition, are not suitable for molecular lipophilicity calculation. The performance of the semi-empirical based model could indicate that lipophilicity property is not strongly linked to electronic effect in molecules.
Cite this paper
Ouattara, O. and Ziao, N. (2017) Quantum Chemistry Prediction of Molecular Lipophilicity Using Semi-Empirical AM1 and Ab Initio HF/6- 311++G Levels. Computational Chemistry, 5, 38-50. http://dx.doi.org/10.4236/cc.2017.51004
References
- 1. Karelson, M. (2000) Molecular Descriptors in QSAR/QSPR. Wiley, New York.
- 2. Todeschini, R. and Consonni, V. (2000) Handbook of Molecular Descriptors. Wiley, Hoboken.
https://doi.org/10.1002/9783527613106 - 3. Karelson, M., Lobanov, V.S. and Katritzky, A.R. (1996) Quantum-Chemical Descriptors in QSAR/QSPR Studies. Chemical Reviews, 96, 1027-1044.
https://doi.org/10.1021/cr950202r - 4. Sangster Research Laboratories (1989) Suite M-3, 1270 Sherbrooke ST. West, Montreal, Quebec, Canada H3G 1H7. Received July 21, Revised Manuscript January 30.
- 5. Gaussian 03, Revision C.01, Frisch, M.J., Trucks, G.W., Schlegel, H.B., Scuseria, G.E., Robb, M.A., Cheeseman, J.R., Montgomery, Jr., J.A., Vreven, T., Kudin, K.N., Burant, J.C., Millam, J.M., Iyengar, S.S., Tomasi, J., Barone, V., Mennucci, B., Cossi, M., Scalmani, G., Rega, N., Petersson, G.A., Nakatsuji, H., Hada, M., Ehara, M., Toyota, K., Fukuda, R., Hasegawa, J., Ishida, M., Nakajima, T., Honda, Y., Kitao, O., Nakai, H., Klene, M., Li, X., Knox, J.E., Hratchian, H.P., Cross, J.B., Adamo, C., Jaramillo, J., Gomperts, R., Stratmann, R.E., Yazyev, O., Austin, A.J., Cammi, R., Pomelli, C., Ochterski, J.W., Ayala, P.Y., Morokuma, K., Voth, G.A., Salvador, P., Dannenberg, J.J., Zakrzewski, V.G., Dapprich, S., Daniels, A.D., Strain, M.C., Farkas, O., Malick, D.K., Rabuck, A.D., Raghavachari, K., Foresman, J.B., Ortiz, J.V., Cui, Q., Baboul, A.G., Clifford, S., Cioslowski, J., Stefanov, B.B., Liu, G., Liashenko, A., Piskorz, P., Komaromi, I., Martin, R.L., Fox, D.J., Keith, T., Al-Laham, M.A., Peng, C.Y., Nanayakkara, A., Challacombe, M., Gill, P.M.W., Johnson, B., Chen, W., Wong, M.W., Gonzalez, C. and Pople, J.A. (2004) Gaussian, Inc., Wallingford.
- 6. XLSTAT Version 2014.5.03 Copyright Addinsoft 1995-2014 (2014) XLSTAT and Addinsoft are Registered Trademarks of Addinsoft.
https://www.xlstat.com - 7. Microsoft® Excel® 2013 (15.0.4420.1017) MSO (15.0.4420.1017) 64 Bits (2013) Partie de Microsoft Office Professionnel Plus.
- 8. Cornillon, P.A. and AtznerLober, E.M. (2007) Régression théorie et Applications. Springer Verlag, Paris.
- 9. Rencher, A.C. and Schaalje, G.B. (2008) LinearModels in Statistics. 2nd Edition, John Wiley & Sonc, Inc., Hoboken.
- 10. Vessereau, A. (1988) Méthodes statistiques en biologie et en agronomie. Lavoisier (Tec & Doc). Paris, 538 p.
- 11. Weisberg, S. (2005) Applied Linear Regression. 3th Edition, John & Sonc, Inc., Hoboken.
- 12. Chatterje, S. and Hadi, A.S. (2006) Regression Analysis by Example. 4th Edition, John Wiley & Sonc, Inc., Hoboken.
https://doi.org/10.1002/0470055464 - 13. Depiereux, E., Vincke, G. and Dehertogh, B. (2005) Biostatistics.
- 14. Golbraikh, A. and Tropsha, A. (2002) Beware of q2!. Journal of Molecular Graphics and Modelling, 20, 269-276.
https://doi.org/10.1016/S1093-3263(01)00123-1 - 15. Tropsha, A., Gramatica, P. and Gombar, V.K. (2003) The Importance of Being Earnest: Validation Is the Absolute Essential for Successful Application and Interpretation of QSPR Models. QSAR & Combinatorial Science, 22, 69-77.
https://doi.org/10.1002/qsar.200390007 - 16. Abraham, M.H. (1993) Scales of Solute Hydrogen-Bonding: Their Construction and Application to Physicochemical and Biochemical Processes. Chemical Society Reviews, 22, 73-83.
https://doi.org/10.1039/cs9932200073 - 17. Cardenas-Jiron, G.I., Gutierrez-Oliva, S., Melin, J. and Toro-Labbe, A. (1997) Relations betweenPotential Energy, ElectronicChemicalPotential, and Hardness Profiles. The Journal of Physical Chemistry A, 101, 4621-4627.